
By
Wieczorek, G.F., Larsen, M.C., Eaton, L.S., Morgan, B.A. and Blair, J. L.
U.S. Geological Survey
Open File Report 01-0144
Heavy rainfall from the storm of December 14-16, 1999 triggered thousands of landslides on steep slopes of the Sierra de Avila north of Caracas, Venezuela. In addition to landslides, heavy rainfall caused flooding and massive debris flows that damaged coastal communities in the State of Vargas along the Caribbean Sea. Examination of the rainfall pattern obtained from the GOES-8 satellite showed that the pattern of damage was generally consistent with the area of heaviest rainfall. Field observations of the severely affected drainage basins and historical records indicate that previous flooding and massive debris-flow events of similar magnitude to that of December 1999 have occurred throughout this region. The volume of debris-flow deposits and the large boulders that the flows transported qualifies the 1999 event amongst the largest historical rainfall-induced debris flows documented worldwide.
A storm on December 14-16, 1999, caused catastrophic landslides and flooding along a 40-km coastal strip north of Caracas from La Guaira to Naiguita, in the northern coastal state of Vargas, Venezuela (Fig. 1). Damage to communities and infrastructure was extensive. In Vargas more than 8000 individual residences, and 700 apartment buildings were destroyed or damaged (Salcedo, 2000). Roads, telephone, electricity, water and sewage systems were severely disrupted. Total economic losses are estimated at $1.79 Billion (Salcedo, 2000). Early estimates suggested that between 5,000 and 50,000 people may have perished (Brandes, 2000; Sancio and Barríos, 2000; Salcedo, 2000; and USAID, 2000), the figure of 30,000 is now generally cited as the approximate number of fatalities (USAID, 2000). An accurate estimate of the number of deaths was difficult to determine. Many people were buried or carried out to sea by the debris flows and flooding and only about 1000 bodies were recovered. No recent census figures were available for Vargas (estimated population of 300,000 prior to this event), so the death toll may have amounted to as much as 10% of the local population, a further indication of the severity of this event.
The topography of this region of coastal Venezuela is extremely steep and rugged. The crest of the Sierra de Avila reaches 2,700 m within about 6-10 km of the coast. The rivers and streams of this mountainous region drain to the north and emerge from steep canyons onto alluvial fans before emptying into the Caribbean Sea. In Vargas little relatively flat area is available for development with the exception of the alluvial fans.

Click image for larger version.
Figure 1. Map of Venezuela showing location of area (rectangle) in Vargas State affected by landslides and flooding triggered by storm of December 14-16, 1999 north of Caracas. Affected area shown in rectangle is shown in detail in Fig. 2.
Although the severity of damage to structures and roads was extreme, the landslides and flooding that were triggered by the intense rainfall were not unique in this region or elsewhere in Venezuela. Historical records indicate that similar hydrologic events leading to severe flooding and/or landslides have occurred in this region in February 1798; August 1912, January 1914; November 1938, May 1944, November 1944, August 1948, and February 1951 (Salcedo, 2000). On average, at least one or two high-magnitude flash-flood or landslide events per century have been recorded in this region since the 17th century (Larsen et al., 2000). Using Spanish archives, Röhl (1950) provided a detailed summary of flash floods and debris flows in La Guaira in February 1798 that caused extensive damage to (219) homes and government buildings, and destroyed all bridges. The high magnitude of this two-day event forced Spanish soldiers to place cannons cross-wise in front of the upstream-facing entrance of a fort, located near the stream channel, to prevent debris from pouring into the structure. Examination of deposits exposed on terraces and along the banks of river channels reveals a record of prehistoric floods and debris flows as well.
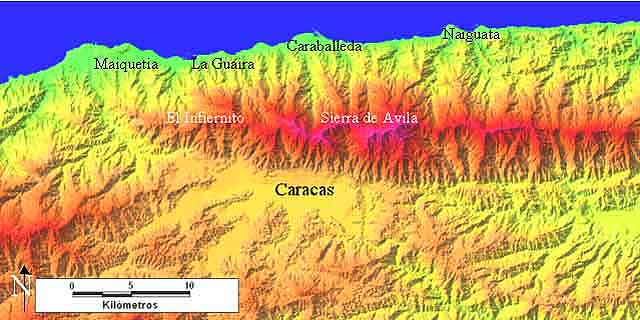
Figure 2. Shaded relief map of the Venezuela coastline north of Caracas between Maiquetia and Naiguata affected by abundant landslides and flooding in December 1999 (modified from Urbani et al., 2000).
Examination of selected aerial photographs along the coastal region in the State of Vargas allows comparison of the extent of damage caused by a February 1951 event with that of the December 1999 storm (MARN, 1999; F. Urbani, written commun., 2000). The 1951 event was smaller with respect to the amount of rainfall, number of landslides on hillsides, and the relative scale of debris flows and flooding in the main channels and deposition on the fans. During the February 1951 event, rainfall of 282 mm was recorded at Maiquetia (43 m msl), whereas at the higher elevation of El Infiernito (1750 m msl) rainfall of 529 mm was recorded; rainfall at higher elevations of the El Avila were about double of amounts recorded along the coast. The rainfall total at Maiquetia in the December 1999 storm (911 mm) was notably larger in 1999 than in February of 1951 (282 mm). In Vargas the development and population growth on the alluvial fans that has occurred since the 1950’s has increased the risk from such events.
Debris flow and landslide disasters have recently occurred elsewhere in Venezuela. On September 9, 1987, the Río Limón drainage, located in the State of Aragua approximately 100 km west of Caracas, was impacted by heavy rainfall. A measured 174 mm of rain fell in less than 5 hours, triggering shallow landslides that quickly transformed into debris flows. About 20,000 people who were returning from a weekend at the beach were isolated by the debris flows that damaged or destroyed approximately 1500 homes, 500 cars, three bridges, and 25 km of roads. About 210 people were killed, 400 injured, and more than 30,000 temporarily isolated by the event (Audemard et al., 1989; Schuster et al., in press). Landslides also regularly pose problems in low-income “barrios” of Caracas where the potential for property damage is generally low, but loss of life is high, and in higher-income areas where property damage can be high, but loss of life is low (Schuster et al., in press).
This study examines the meteorologic, geologic, hydrologic and topographic characteristics of landslides and flooding produced during the storm of mid December 1999 in northern Venezuela. The study examined the hillsides and channels of nine drainage basins severely affected by the storm. The characteristics of landslides initiating on steep hillsides were examined for their size, geometry, type of slope movement and nature of geologic materials. Measurements were made of channel and alluvial fan width, gradient, and depositional depth, as well as the maximum size of boulders transported in the flows. The stratigraphy and fabric of deposits were examined to identify the type of deposits as well as the (chronology) sequence of flooding and debris flows. Detailed measurements were made of debris-flow deposit thicknesses and boulder sizes on the Caraballeda fan, which when analyzed in conjunction with pre- and post- topographic maps (before and after the December 1999 event) allowed calculation of the total volume of deposits. Rainfall estimates determined from GOES-8 satellite data were used in conjunction with ground measurements to reconstruct the spatial and temporal distribution of rainfall. Eyewitness accounts of timing of debris-flow events were compared to the timing of rainfall intensity and duration. Structural and non-structural methods that could be useful for hazards mitigation in this region were reviewed.
The timing and intensity of rainfall of the storm of December 14-16, 1999, was unusual because the rainy season in coastal Venezuela normally lasts from May through October. Beginning in early December of 1999, the interaction of a cold front with moist southwesterly flow from the Pacific Ocean towards the Caribbean Sea resulted in an unusually wet period over coastal northern Venezuela. Moderately heavy amounts of rainfall during the first week of December were followed by extremely heavy rainfall beginning on December 14 and lasting through December 16. The total 3-day rainfall along the coast at the International Airport at Maiquetia (43 m above mean sea level) for a 52-h span on December 14-16 totaled 911 mm (from 1945 on Dec. 15 to 2345 on Dec. 17, UTC); individual daily rainfall for the month of December at Maiquetia is shown in Fig. 3. Hourly rainfall from 6 to 7 am on the morning of December 16 measured 72 mm. These amounts and intensities of rainfall were highly exceptional for this region; the daily totals (380.7 and 410.4 mm) for both December 15 and 16 at Maiquetia exceeded the 1000-yr probability rainfall event for this location (Martinez, 2000).
Click image for larger version.
Figure 3. Daily rainfall (mm) for December 1-18, 1999 at Maiquetia (Urbani, 2000).
A limited number of rainfall measurements of this storm were available, particularly within the heavily damaged region of Vargas. A spatial and temporal representation of distribution of rainfall was available from the GOES 8 satellite NOAA/NESDIS rainfall estimator. The GOES data spans 52 hours, from 1945 on Dec. 15 to 2345 on Dec. 17, UTC. There are 104 1/2-hour data sets, with the 0145, Dec. 15, data set missing. These rainfall estimates have been computed using a relation between rainfall rate and cloud top temperature determined from infrared sensors on the GOES 8 satellite (Vicente et al., 1998). In previous storms ground-based rainfall measurements in this region indicate that the higher elevations towards the crest of the Sierra de Avila receive about twice as much rainfall as the regions along the coast (Salcedo, 2000). A map of rainfall contoured from the GOES 8 data with a cell size of 4 x 4 km shows that the heaviest rainfall occurred within 8 km of the coast and the higher elevations of the Sierra de Avila roughly centered over the mid to upper part of the San Julián basin upstream of Caraballeda (inset on Plate 1). Rainfall decreased towards Caracas on the southern side of the crest of the Sierra de Avila and to the east of Naiguata and to the west towards Maiquetia along the coast. These areas of heavy rainfall centered over the San Julián and adjacent drainage basins roughly corresponded to the areas that suffered the most abundant landslides and most severe flooding and debris-flow damage. Limited comparison of the ground-based measurements revealed that the rainfall totals from remotely sensed data were inconsistent with ground-based values. The factors that influenced the accuracy of remotely sensed rainfall data include spatial registration and map projection, as well as prevailing wind direction, cloud orientation, and topography.
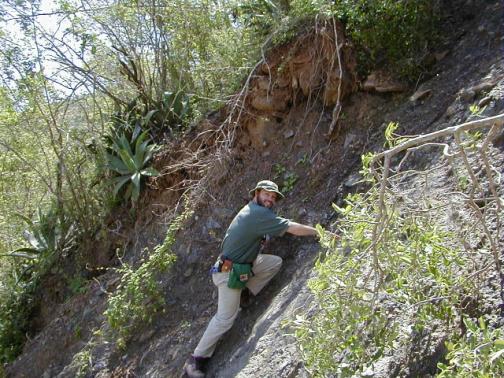
The geology of Caracas and the northern coastal region of Venezuela has been mapped and described by Dengo (1953), Wehrmann (1969), Urbani and Ostas (1989), Urbani et al. (1997), and Salcedo (2000). With the exception of the Quaternary channel and alluvial fan deposits, the geology of this region consists mainly of metamorphic rocks. Exposures of the Tacagua Formation (Mesozoic) (Fig. 4), consisting of graphitic, epidote schists parallels the coast and extend about 1 km inland. The soils developed over these schists are relatively thin, 0.5- to 3.0-m thick (Salcedo, 2000), red (Munsell Color 10R), and fine-grained. They are found frequently as a clayey colluvial deposit overlying partially-to-deeply weathered, strongly foliated bedrock. The A-horizon is generally less than 0.3 m thick; however, bedrock weathering is commonly 2 m or more (Merifield, 2001). Physical properties of these soils, including grain-size distribution, plasticity, specific gravity, and water content were reported by Salcedo (2000) for several drainages.
Click image for larger version.
Figure 4. Red blocky colluvial soil on steep slope underlain by Tacagua Formation exposed in landslide scarp in Quebrada Alcantarilla watershed (Plate 1).
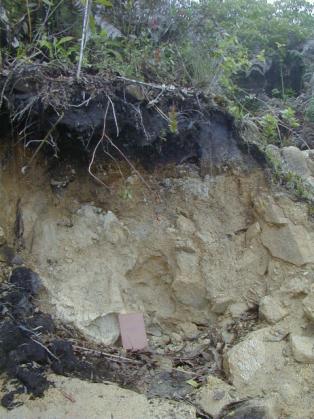
Further inland of the Tacagua Formation, quartz-plagioclase-mica gneiss and feldspar schist of the San Julián Formation (Paleozoic), and augen (quartz-mica) gneiss of the Peña de Mora Formation (Precambrian) (Fig. 5) extend to the crest of the Sierra de Avila. Soils developed over these two formations are likewise both thin, sandy, and lighter (tan-grey) in color over shallow weathered bedrock. The soils developed over these metamorphic rock units are believed to be thin because of the higher rates of erosion induced by the steep topography.
Click image for larger version.
Figure 5. Thin tan sandy soil with blocky rock fragments over weathered gneiss of the Peña de Mora Formation exposed in landslide scarp. Notebook in foreground is about 20 cm long.
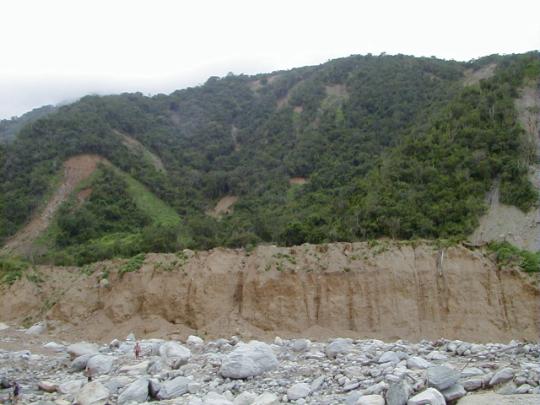
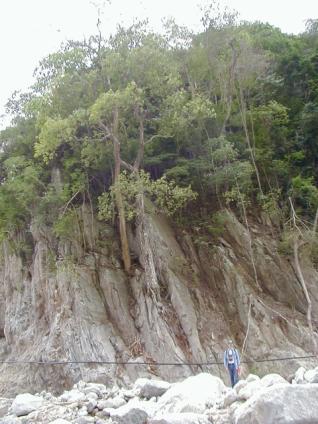
Terraces consisting of prehistoric debris-flow and flood deposits are elevated 10-20 m above the current stream channels, suggesting contemporaneous tectonic uplift of the coastal range combined with accelerated incision of the channels (Fig. 6). An arid period associated with the late Pleistocene has been correlated with elevated terraces having similar deposits of bouldery debris over bedrock located about 100 km west of the Vargas region (Schubert, 1985). Scouring of channels and removal of alluvium in the December 1999 event exposed eroded bedrock benches above the apices of the fans, with apparent vertical steps ranging from about 0.5 to 2 m high above the current levels of the channels. These benches are suggestive of tectonic uplift and accelerated bedrock channel incision in this region. Stallard (1988) has suggested an uplift rate of 2-5 m/1000 years for terraces at the northern terminus of the Andes in northwestern Venezuela. However, most of the Quaternary faults in this region are described as having right lateral, rather than vertical displacements, such as the San Sebastian fault, (Audemard et al., 2000), although the offshore Quaternary faults could have a substantial vertical component of movement. Near the International Airport at Maiquetia, the fault scarp contact between Pliocene Cabo Blanco Formation and the Mesozoic Tacagua Formation shows vertical offset (Audemard et al., 2000; Michael Machette, oral commun., 2001).
The alluvial fans in Vargas are not deeply incised. Typically they are slightly higher in elevation (about 5 m) towards the axis of the fan than on the flanks, with only relatively shallow incision of a couple of meters by the active stream channels. The minimal steam entrenchment suggests that the long-term rate of delivery of material from the upper watersheds to the fans is equal to or exceeds the rate of removal of material by the stream. The steep mountainous topography with basal accreting fans is consistent with a youthful geomorphic stage of alluvial-fan development in this region (Sorriso-Valvo, 1988).
Click image for larger version.
Figure 6. Prehistoric terrace of flood and debris-flow deposits about 20 m thick above current channel of Quebrada San Julián near Caraballeda. Note people on left for scale among recently deposited car-size boulders in channel.
During field examination in April and July of 2000 nine watersheds were examined (Camurí Chiquito, San Julián, Cerro Grande, Camurí Grande, Alcantarilla, Seca, El Cojo, San José de Galipán, and Osorio—located on Plate 1) in the region. Emphasis was given to hillsides where landslides initiated and on channels that experienced flooding and/or debris flows. Sites of field measurements and observations are identified and located on Plate 1; values of measurements from these sites are included in appendices A and B. Additional photographs illustrating features at these sites are referenced on Plate 1.

Click image for larger version.
Figure 7. Coalescing shallow landslides initiated on steep hillsides in soils developed over bedrock of Tacagua Formation. Shallow slides initiated on concave or planar slopes coalesced with other slides as they traveled into channels. Transmission tower, 30 m high, (upper right) for scale.
Abundant and widespread landslides occurred on steep slopes within areas underlain by schist and gneiss from near the coast to slightly over the crest of the Sierra de Avila. Some hillsides were entirely denuded by single or coalescing failures (Fig.7). In terms of classification of types of slope movement (Varnes, 1978), most landslides initiated as thin earth (soil) slides or debris slides (soil with pieces of rock), as indicated by shallow sliding surfaces within soil or weathered, foliated, and jointed rock. With the addition of more water from either the hillslopes or the channels these slides of loose soil and rock liquefied into debris flows. This process of debris-flow mobilization initiating from shallow slides is widely recognized (Ellen and Fleming, 1987). A few isolated larger rock slides, and rotational or block slides of earth or rock, were also observed.
In most cases, debris flows entrained additional colluvium while traveling down steep hillside paths. Upon entering main channels, the debris flows incorporated stream alluvium from the channel and colluvium from channel banks, ranging in size from fine-grained material to extremely large boulders (fig. 8).
Click image for larger version.
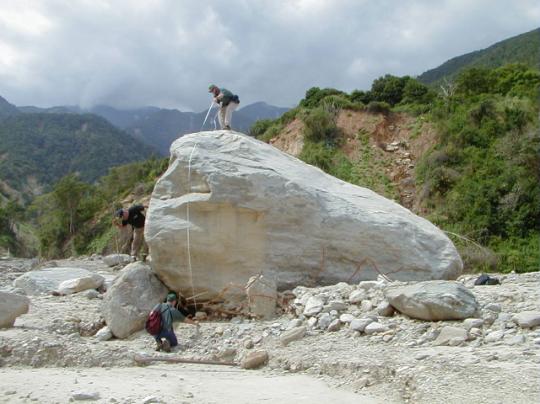
Figure 8- Large (11.3 x 5.0 x 3.5 m) sub-rounded gneissic boulder deposited in center of channel of Quebrada Camurí Chiquito. Boulder was deposited atop reinforced concrete pad with strands of steel rebar visible along base of boulder.
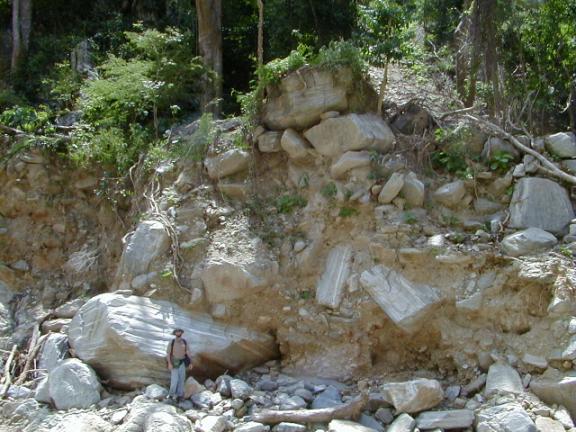
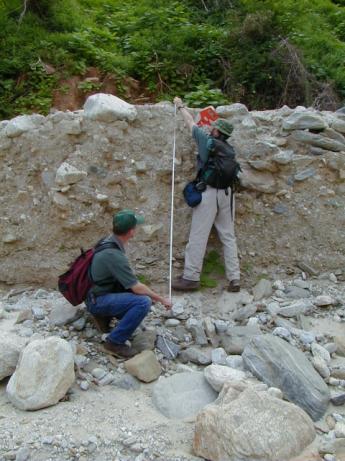
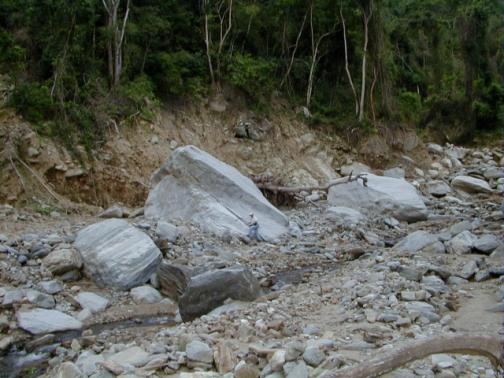
The undermining and collapse of prehistoric debris-flow deposits along the banks of channels was one mechanism by which large boulders became incorporated into the 1999 flows (Fig. 9). Sub-rounded to sub-angular large gneissic boulders derived from the Peña de Mora Formation, which crops out at higher elevations within the Sierra de Avila, were found in channels and alluvial fan deposits near the coast, in areas underlain by the Tacagua Formation. The underlying geology and in situ weathering characteristics suggests that these boulders have been transported at least several kilometers, probably by multiple episodes of flood/debris flow over a period of many thousands of years.
Measurements of hillside morphology included hillside inclination, and dimensions of initial slides including thickness, width, and length (Fig. 10). Noted were the composition of materials involved in sliding and whether the site showed evidence of previous sliding. Most slides occurred within the top 0.5-2.0 m of soil and/or weathered schist or gneiss, although deeper earth slumps or rock block slides were rarely noted. The width of slides varied greatly, with a mean of 19.5 m and standard deviation of +/- 20 m (landslide source data included in Appendix A). Some smaller slides coalesced to denude larger sections of hillsides. Stratigraphic sequences exposed in main scarps indicated some reactivation of previous landslides.
Click image for larger version.
Figure 9. Prehistoric debris-flow deposit (7.7-m thick) undermined in channel bank of Quebrada San José de Galipán. Fully matrix-supported texture with randomly oriented sub-angular large gneissic boulders from the Peña de Mora Formation gneiss deposited in a sandy matrix. Top of deposit which is matrix free produced by winnowing of debris flow by recessional and/or secondary overland water flows.
Measurements indicated that landslides initiated on slopes ranging from 30 to greater than 60 degrees, and the slopes that failed had a mean value of 42 degrees with a standard deviation of +/- 7.7 degrees (N=26). Salcedo (2000) reported a mean initial slope value of 38.5 degrees with a standard deviation of +/- 5.1 degrees (N=15). These comparable mean values of original slope inclination before failure might actually be slightly low because of a sampling bias in this steep terrain limited the measurements to slopes that could be safely ascended for measurement without climbing equipment.
Bedrock structure in this region strongly influences slope stability. In locations where the direction of steeply dipping foliation of the schist and gneiss is towards an open slope face, conditions are favorable for sliding (Fig. 11). The steeply dipping foliation in many part of this region (Dengo, 1953) in combination with exceptional storm events has inhibited the development of thick soils. The steep inclination of the slopes frequently exceeds the frictional resistance (angle of internal friction) of the sandy soils in this region, suggesting that other sources of strength, such as internal cohesion, soil suction (negative pore pressure), soil structure, or contribution of vegetative root strength, must contribute to the apparent stability of steep slopes. Similarly high values of slope inclination have been reported for initiation of debris flows in Brazil (Wolle and Hachich, 1989).
Click image for larger version.
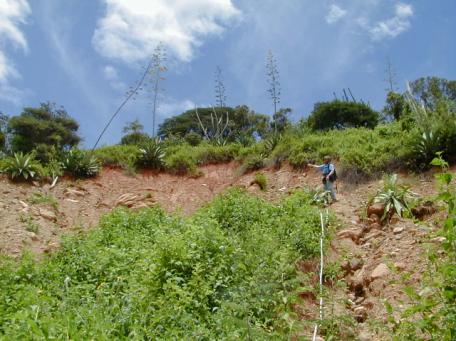
Figure 10. Measuring dimensions of debris slide, 1-2 m deep on 35 degree slope in red colluvial soil developed over Tacagua Formation in Cerro Grande watershed. Revegetation of the center of the landslide scarp occurred between mid-December 1999 and early April 2000.
Hillside soils involved in landsliding were predominantly silty sands and silty gravelly sands (SM), or clayey sands and clayey gravelly sands (SC) according to the Unified Soil Classification System (Salcedo, 2000). Using an infinite slope analysis, Salcedo (2000) showed that for similar sandy soils with a typical effective angle of friction between 30 and 40 degrees, an effective cohesion of 1 t/m2 (1.29 psi or 8.9 kPa) would be required for stability on slopes equal to or greater than 40 degrees. For these types of “sandy” cohesionless soils, such values of cohesion would be unusually high and hence stability of such soils would be unlikely, unless additional resistance to sliding was added by the strength of tree roots or capillary soil suction (Wolle and Hachich, 1989). In his observations of landslide failure scars in this region, Merifield (2001) found that root penetration was generally confined to the thin topsoil layer, except in a few cases where roots penetrated along open fractures of joints or foliation. Roots made up less than an estimated 5 percent of the slip surface, a rather low value compared to slopes elsewhere (Merifield, 2001), so root strength alone was not sufficient to account for the apparent stability of soil on steep slopes in this region. In light of the probable low cohesive strength available from soil and roots in this setting and marginal stability dependent on soil suction under dry conditions, it is not unusual that during an extreme hydrologic event the strength of thin soils on steep slopes was insufficient to resist sliding as demonstrated by the abundant and widespread landslides that stripped hillsides of their soil cover.
Click image for larger version.
Figure 11. Channel bank exposing steeply foliated schist with thin soil cover and thick vegetation. Bedrock has been exposed by 1999 debris flow in channel.
The main channels and fans of the nine watersheds we examined displayed a complex sequence of deposition. The sedimentology exposed in most channels suggested evidence of both flooding and debris-flow processes; however, the types of flow processes, stratigraphy, and thickness of deposits typically varied along the length of a channel and onto the fan. Deposits in most channels and fans showed that flooding had preceded debris-flow activity. Many of the fans experienced multiple pulses of debris flows, some of them highly destructive, and deposited large boulders and tree trunks amidst a sandy matrix on nearly all the fans. Flooding in the later stages of the storm subsequently incised these fluvial and debris-flow deposits (Fig. 12). Measurements at individual stations of the range of thickness of deposits and depths of flow are included in Appendix B and are summarized for each watershed in Table 2.
The degree of matrix support of coarser clasts observed in deposits varied from fully matrix supported to fully clast-supported deposits. The association between flow processes and depositional texture was gradational as characterized by Keaton et al. (1988) with debris-flow deposits having fully matrix-supported, unsorted, unstratified clasts, transitional flow with partially matrix-supported clasts, and hyperconcentrated sediment flow with a fully clast-supported texture. The surface of some deposits was matrix free as a result of winnowing of debris-flow deposits by recessional and/or secondary overland water flows (Moscariello and Deganutti, 2000).

Figure 12. Remnant of 1999 bouldery debris-flow deposit (~ 2 m thick) incised by latter flooding with subsequent fine-grained flood deposits in foreground in the channel of Río Camurí Chiquito. Grain-to-grain, partially matrix-supported randomly oriented boulders indicative of transitional flow (Keaton et al., 1988).
The confluence of debris flows from lower-order tributaries into the main channels added additional sediment to maintain the debris flows in the main channels. We noted that below tributary junctions, the thickness of debris-flow deposits was increased in many locations. In some drainages the authors found evidence of a few isolated temporary blockages of the main channel with remnants of large boulders and timber, caused by a debris flow from a tributary entering a main channel. However, there was no evidence of sedimentation upstream of these blockages, suggesting that the blockages were short-lived and that the volume of flow in the main channels was sufficiently great to quickly overwhelm any blockage. Reports that channel blockages (Sancio and Barrios, 2000) were the source of the destructive debris-flow surges or pulses observed on the fans were not generally confirmed by field evidence. However based on the evidence we saw for the short duration of the few blockages and the several kilometer length of the channels before reaching the fans, we ascertained that these reports had probably noted the characteristic front or snout of a debris-flow pulse that was not necessarily the consequence of the collapse of a blockage.
In most of the drainages the sequence of flooding and debris-flow deposition during the storm was confirmed by eyewitness accounts (Table 1). Flooding was generally observed beginning after 8 p.m. local time (Atlantic Standard Time (AST)) on the evening of December 15. Some residents fled from the vicinity of the river overtopping its banks and remained atop nearby houses, watching the events unfold. The first eyewitness reports of debris flows or events with descriptions of crashing rocks occurred about 8:30 pm on December 15 on the Quebrada San Julián (Table 1). Other possible debris-flow events , e.g. “rumbling noise and vibration of rocks”, occurred between 2 and 3 a.m. on December 16. Another series of debris flows was observed between 5 and 7 a.m.; the last series of debris flows was reported between 8 and 9 a.m. on December 16. Flooding was noted in a few channels between 7 and 9 a.m. on December 16 and lasted until late in the afternoon of December 16, and eroded many of the debris-flow deposits within channels.
The variation of flood/debris-flow depositional processes along the channels can be attributed to various factors, particularly the location of the junctions with tributaries and whether these tributaries were experiencing debris flows or flooding. In the highest parts of the drainages that were easily accessible, about 4 km inland, bedrock channels had been severely scoured and had been left almost devoid of sediment. Although vegetation trim lines were identified on the channel sides, it was not possible to determine whether the channel sediments had been removed by flood, debris flow, or an intermediate variety of flow (transitional flow or hyperconcentrated flow, see Pierson and Costa, 1987; Keaton et al., 1988; and Scott et al., in press). The dilution of debris flow by inflow from a flooding tributary to a transitional flow or hyperconcentrated flows could also have occurred in the higher parts of drainages. In almost all drainages debris-flow deposits were traced from the distal ends of the fans uplslope to about 2-3 kilometers of the coast (Fig. 13). Additionally, the deposition extended laterally beyond the shorelines as subaqueous fans for some tens of meters (Larsen et al., 2001). The thickness of subaqueous deposition from the 1999 event could not be determined because of the lack of pre-event bathymetric surveys. The subaqueous deposits were probably less than 1m- thick, reasoned from observations of subaerial, thin-bedded, dominantly fine-grained deposits grading into the coast. A characterization of the type(s), sequence and thickness of deposition, and maximum boulder size within each drainage and on fans is given in Table 2.
Click image for larger version.
Figure 13. Debris-flow deposit, 2.9 m-thick, incised by subsequent flooding of channel in Río Camurí Chiquito. Fine-grained matrix supports coarse particles.
The average velocities during flooding were estimated by measuring the maximum size of transported boulders (Appendix B). Costa (1983) and Clarke (1996) developed empirical relationships dependent on boulder diameter for estimating the average velocity accompanying flood discharge. These methods determine the critical (competent bed) velocity required to initiate boulder movement. Because of slightly different means of measuring the boulder diameter, Costa’s equation results in a velocity estimate about 40% greater than that of Clarke. The authors also estimated flow velocities from superelevation on channel bends. These are sites where flows reached higher elevations on the outside of channel bends than on the inside. Based on the cross-channel flow surface angle, radius of curvature of the channel bend, and channel slope, the approximate mean velocity of flow can be calculated (Costa, 1984).
The average velocities of the flows ranged from 4 to 14.5 m/s using methods by Clarke (1996) and Costa (1983), and were based on measurements of the largest transported boulders (Fig. 14). A slightly lower range of velocities from 3.3 to 13.6 m/s was determined for several dozen sites based on measurements of superelevation on channel bends. Direct comparison between these two methods was possible at only six sites. Assuming the superelevation method as that most applicable to debris flows, the methods by Clark (1996) and Costa (1983) based on boulder size overestimated the velocity by about 28% and 68%, respectively. The velocity based on superelevation probably better represents the actual flow velocity of a debris flow or flood because the calculation is independent of fluid density (Costa, 1984, p. 304). The methods of Costa (1983) and Clarke (1996), are based on average velocity necessary for initial movement of a boulder along the channel bed in a clear water flood. This technique probably overestimates the velocity because a debris flow suspends boulders within a matrix and has a density greater than clear water making it capable of transporting boulders with a slightly lower velocity.
Click image for larger version.
Figure 14. Large boulder (6m x 4.6m x 1.6m) deposited within a coarse sandy gravelly matrix on a channel slope of 6 degrees in Quebrada El Cojo (Sta 4-10-16). Average velocity of 7-11 m/s necessary for fluvial bedload transport of boulder as determined by Clarke’s (6.8-7.5 m/s) and Costa’s (10.9 m/s) methods, respectively.
The heterogeneous nature of a debris-flow surge (Hungr, 2000) which includes a high, steep, bouldery front followed by a lower slurry of coarse particles in suspension and finally a dilute tail suggests why equations for velocity based on bedload transport of large boulders during flooding are inadequate to represent such a complex process. In addition, velocities based on boulder size should be used with caution because it was not known how the largest boulders had actually been transported, whether by fluvial transport of rolling or sliding along the bottom of the channel in a dilute fluid, or whether suspended in a granular matrix by a debris flow. Where the large boulders were found within a matrix, the evidence strongly supports transport by debris flow. At other sites the largest boulders are isolated in the channel and all other sediments removed by subsequent flooding, so that it is not possible to determine the mode of transport.
Another important factor to consider when calculating velocities based on boulder size is the supply or availability of large boulders. Unless a supply of a wide size range of boulders is continuously available throughout the length of the channel, the method can lead to an underestimation of velocity. For most of the channel reaches that we examined, the remaining prehistoric debris-flow deposits exposed in the channels and banks provided a plentiful supply and wide range of boulder sizes. The dimensions of the largest boulders found in prehistoric deposits and their estimated velocities based on size for fluvial transport are shown in red type in Appendix B. Evidence showed that prehistoric deposits were not only thicker, but contained larger boulders than documented in the December 1999 event. In terms of hazard assessment, the December 1999 event should not be assumed to be the highest magnitude storm possible event in this region.
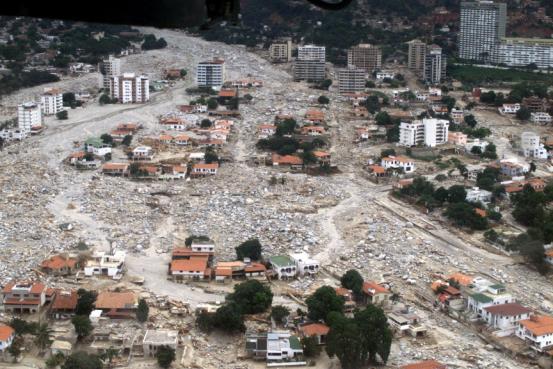
The large fan of the Quebrada San Julián at Caraballeda was one of the most heavily damaged areas in the December 1999 event (Fig. 15). The thickness of deposition, maximum size of transported boulders, and size of inundated area were all notably larger in this drainage in comparison to other watersheds.
Caraballeda was one of the more intensively developed communities with many highrise buildings and large individual multi-story houses. At the fan apex, the peak volume of flow, probably during a debris-flow surge, exceeded the channel capacity resulting in multiple stream avulsions and subsequent flows spreading bouldery debris throughout the community. The flow overcame the channel in several places, notably wherever sections or lineaments of the channel changed direction. Pre-1951 topographic maps show the channel of the Quebrada San Julián taking a more or less straight path across the western part of the fan. Photographs of the February 1951 event (MARN, 1999) show deposition limited to the channel through the eastern part of the fan. In the events of December, 1999 the channel avulsed high on the fan and followed the pre-1951 course. Whereas the 1951 event was adequately contained within the eastern channel, the flows of 1999 roughly followed the channel that existed prior to 1951.
Click image for larger version.
Figure 15. Aerial view of debris-flow deposition resulting in widespread destruction on the Caraballeda fan of the Quebrada San Julián. Avulsion of the main channel (left side of photo) resulted in deposits up to 6-m in thickness and totaling about 1.8 million cubic meters of bouldery debris. Secondary new flood channels are visible through center of fan to the lower right of photo (Photo by Lawson Smith, US ACE).
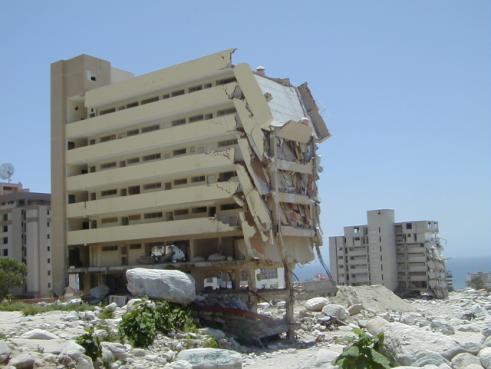
Outside of the main channel, flows inundated the second story of several apartment buildings, causing their partial collapse (Fig. 16), and also buried or completely destroyed many 2-story residential structures. Further down the fan, flows followed the paths of streets and openings between houses; the deposition of debris thinned, but still exceeded one meter in thickness at several locations. Only about a third of the original area of the Caraballeda fan was inundated by debris flows in this event; however, buildings on the entire fan are built upon previous debris-flow deposits (Plate 2).
We measured degree of slope, depositional thickness, and boulder size from the fan apex to the distal end of the fan near the coastline (Appendix B). Data collected of the extent and thickness of the deposits was used to map the distribution and thickness of deposits and to estimate the total volume of deposits on the fan. In addition, we obtained pre- and post-event digital topography on the Caraballeda fan from the Ministerio del Ambiente y Recursos Naturales (MARN) that enabled us to determine topographic changes due to the storm event and to numerically model the total depositional volume on the fan for comparison with the field derived estimates of total volume.
Click image for larger version.
Figure 16. Apartment in Caraballeda extensively damaged by passage of debris-flow front at least 3.5 m in height, leaving boulders (> 1m) on second floor of structure.
Total deposition on the subaerial fan was calculated using two different methods. In the field we measured deposit thickness, or if necessary, indications of the depth of flow where material had been removed from cleanup. Where material had been removed mudlines on houses and other structures were used as an approximate measure of deposit thickness. Total depositional volume of 1.9 million cubic meters was determined from field measurements using 3-dimensional modeling software (Earth Vision Version 5.11 from Dynamic Graphics, Inc., 2000). This volume is a minimum because it neglects the amount of material that remained in the main channel after the event, but was removed by the time of our visits (Fig. 17). The same software was also used for comparison of pre-and post- topography on the fan and the results show a depositional volume of 1.8 million cubic meters. Plate 3 shows a plot of contoured thickness of deposits using the comparison of pre- and post-event topography. The determination of volume by comparison of pre- and post- topography is the preferred method due to modifications on the fan by the time of our field work, although both values differ by only approximately 10% .
The significance of the volume of deposits on the Caraballeda fan can be ascertained from comparison with other large debris flows worldwide (Table 3). Using a magnitude scale, M, of the log of depositional volume suggested by Keaton et al.(1988), the magnitude of debris-flow deposits on the Caraballeda fan (M=6.3) is amongst the largest on record from rainfall-induced debris flows; however, even the largest of rainfall-induced debris flows are at least an order of magnitude smaller than the largest triggered by volcanic explosions, eruptions, or earthquakes.
Click image for larger version.
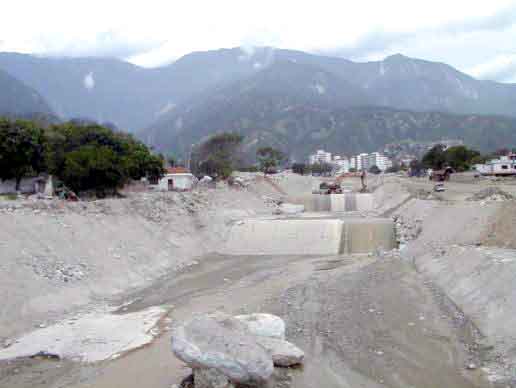
Figure 17. Excavated channel of the Quebrada San Julián on the eastern portion of Caraballeda fan. Debris flow and flood waters overflowed channel at this point midway on the fan. Concrete base of channel (left) dates to post-1951 flood recovery efforts. Channel was probably partially refilled with sediment príor to the events of December 1999. Note bulldozer in channel for scale.
We measured deposits between 4 and 5-m thick in the center of the fan, located where two major avulsions occurred from the main channel of Quebrada San Julián. Values of deposit thickness are given in Appendix B for station locations shown on Plate 3. The thickest deposits were near the middle of the fan (between stations 7-8-14 and 7-12-33) where two-story houses were either completely destroyed or partially buried (Fig. 18). At this locale, the fan slopes ranged between 5 and 6 degrees, and the maximum thickness of deposits was 5.3 m as determined by comparing pre- and post- topography. Mapping the shoreline from post-event aerial photographs showed that subaqueous deposition had extended the shoreline at Caraballeda by about 40 to 60 meters. Deposits on slopes of 2 to 4 degrees slope near the (pre-event) shoreline were predominantly fine-grained and less than about 0.5 m thick. Although post-event bathymetry exists, no pre-event data of sufficient resolution was available to determine the thickness of subaqueous deposits. The volume of subaqueous deposition beyond the extent of the new shoreline is probably not significant with respect to the volume of subaerial deposition.
Click image for larger version.
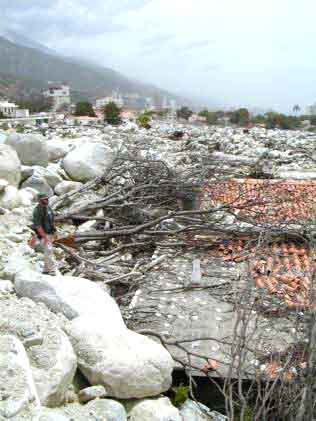
Figure 18. Roof of a one-story residence buried by debris flow in center of Caraballeda fan. View eastward across area inundated by bouldery debris flow.
We measured the size of about 100 boulders deposited in the center of the fan along short traverses (10-40 m in length), recording the lengths of the major three axes for all boulders (defined as greater than 256 mm). In terms of nominal diameter, equal to the cubic root of the product of these dimensions, the mean nominal diameter of boulders deposited at stations 7-8-14 and 7-12-33 was 0.75 and 0.99 m, respectively, with larger boulders being deposited slightly further down the fan towards station 7-12-33 (Plate 2). The slope gradient at station 7-8-14 was 4 degrees, whereas at station 7-12-33 the slope steepness was 6 degrees. For comparison, 11 boulders deposited about 2 km upstream on slopes of 5.5 degrees in the Río San Julián channel (sta. 4-5-7) had a mean nominal diameter of 1.20 m. These values of mean nominal diameter and slope steepness reflect our observations that for the larger transported and deposited boulders there was a proportional relationship between boulder size and slope steepness. This relationship is consistent with an expected decrease in flow velocity and reduced energy for transport of large boulders with decreasing slope steepness.
Prehistoric flood/debris-flow deposits were exposed along channel banks in most of the observed watersheds. The dimensions of large boulders in these prehistoric deposits as well as the deposit thickness were recorded (Appendix B). The sizes of boulders and thicknesses of prehistoric deposits are at least as large as those of December 1999 and in several areas, greater, indicating that the December 1999 event was not necessarily the largest event to have occurred in this region.
The age of previous events and the average recurrence of flood/debris flow events in the Quebrada San Julián and other drainages is important for rebuilding and mitigation considerations. Aerial photo interpretation and field examinations indicate that prehistoric and historical debris-flow deposits cover much of the Caraballeda fan with thickness and size of boulders comparable to the 1999 event (Plate 2). Although a flooding/debris-flow event occurred in 1951 on this fan, the extent of this event evident in aerial photographs (MARN, 1999) was minor in comparison to the 1999 event. Since 1951, extensive development has occurred on this fan, and is reflected in the magnitude of loss of life and property in 1999.
Prehistoric flood and debris-flow deposits are exposed along the banks of the Río San Julián and on the flanks of the Caraballeda fan. At Plaza de Piedras, located high above the active channel on the eastern side of the fan (Sta. 7-7-17) at an elevation of approximately 75 m, a house built in 1917 sits on a boulder terrace with the largest boulder of approximately 2.9 cubic meters (A-axis 2.8 m) (Fig. 19). On the western side of the fan at about the same elevation (Sta 7-6-13, 14, 15), a thick (~ 17 m) sequence of multiple (2?) flood/debris flow deposits include gneissic boulders (A-axis 1.5 m) in a brownish-yellow, slightly cemented sandy matrix. Similarly thick deposits with large boulders in a sandy yellow matrix could be roughly traced upstream from the western side of the fan for about 0.5 km along the western banks of the Río San Julián. In a fresh exposure (between Sta. 7-10-5 and 7-10-7) located on the western channel banks we found organic carbon in paleosols above and below a thick (10 m) debris-flow deposit, containing large subrounded gneissic boulders (A-axis of 2-3 m) suspended in a sandy matrix. The dates from the carbon samples recovered from the paleosols bracketed the debris-flow deposit between the upper dates of 3720 +/- 50 yBP, 3750 +/- 40 yBP and the lower date of 4267 +/- 38 yBP. Closer examination of this exposure and mapping the lateral extent of this deposit is necessary to determine if this sequence of coarse bouldery deposits may represent a single episode or several different debris-flow events within the span of about 500 years. Although we observed prehistoric debris-flow deposits in other watersheds, exploration for dateable materials to bracket their ages was not conducted.
Click image for larger version.
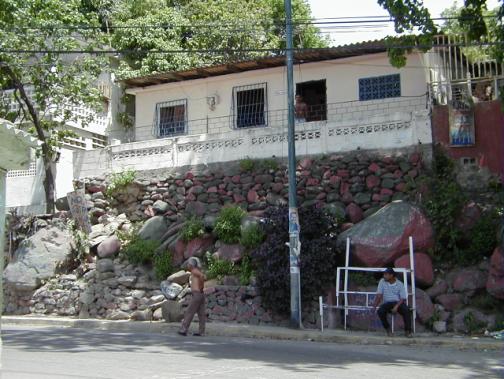
Figure 19. Structure at Plaza de Piedras in the eastern older portion of Caraballeda. This “House of Stones” built around 1917 predated the flood and debris-flow events of 1951 on the Caraballeda fan.
The high magnitude and resulting consequences of damage from debris flows and flooding triggered by the December 1999, event indicates that mitigation is necessary to minimize future loss of life and property damage from events of similar or greater magnitude. The selection and design of appropriate mitigation measures depends upon the rate of recurrence of events with different magnitude, and the economics, feasibility, and acceptability of preventing damage and casualties (United Nations, 1996b). More comprehensive field studies and analysis of the historic and prehistoric flood and debris-flow events of this region are necessary to proceed with disaster mitigation planning (United Nations, 1996c). In particular, it is necessary to determine the M (magnitude)-F (frequency) relationship between these events in sufficient detail for proceeding with implementation of costly structural mitigation measures (United Nations, 1996b).
Approaches to debris-flow hazard mitigation can be generally separated into those involving construction of some type of physical structures and those involving non-structural measures. The non-structural measures for debris-flow hazard mitigation include removing or converting existing development, discouraging development, and regulating development (Erley and Kockelman, 1981). Non-structural measures can be especially cost effective if the areas in question are subject to frequent debris flows, such as is the case in the State of Vargas, Venezuela. Land-use regulations can be used to reduce hazards by limiting the type or amount of development in hazardous areas. A community can zone hazard-prone areas for open space uses, such as parks, grazing, or certain types of agriculture. Alternately, within high hazard zones, the intensity of development can be kept to a minimum. Preventing redevelopment of areas of suspected high susceptibility to future hazards, e.g. Carmen de Uria and Quebrada Seca, may be more cost effective than structural mitigation measures.
In the case of the Caraballeda fan, several non-structural planning methods can be employed to minimize damage from future debris flows. Employing setbacks of perhaps 30 m beyond the top of banks along stream channels would limit damage in smaller magnitude events. Likewise, clustering of development to avoid building on or near ephemeral channels on fans would also help to minimize future damage. To the extent that most of the large apartment houses withstood the force of the debris flows without collapsing during the December, 1999 event, such structures were safer than individual one- and two-story residences and prevented more casualties. Thus, seeking shelter in these large multi-story structures could prevent loss of life. Likewise, even such a small step as orienting a building so that its length is oriented parallel to the direction of flow will minimize the width of building exposed to a debris flow. Additionally, orienting streets to generally parallel the downslope direction of the fan helps them to serve as overflow channels, limiting potential damage to structures.
Monitoring, warning, and evacuation can also be considered as other non-structural approaches to hazard mitigation. In order to increase the ability of emergency managers to respond to future potential events, early warning systems based on weather forecasts and rainfall information could be developed. Enhanced weather forecasting is needed for the Caribbean and the northern coastal parts of Venezuela. For example, in cooperation with the U.S. National Weather Service (NWS), the USGS developed a real-time landslide warning system that was used to issue the first public regional warning for debris flows in the United States during the storms of 12-21 February 1986 in the San Francisco Bay region (Keefer et al., 1987). These warnings were conveyed to local officials in the San Francisco Bay region responsible for emergency services, who deployed resources in areas likely to be affected.
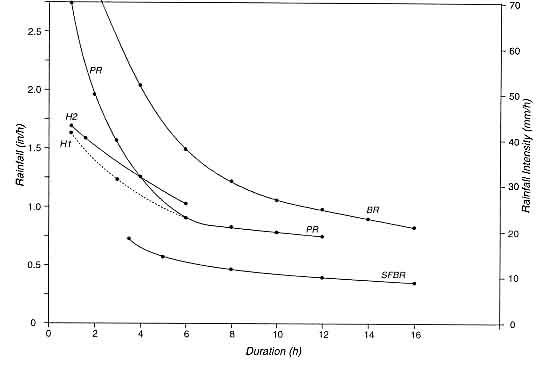
Rainfall intensity-duration thresholds for triggering of landslides have been widely identified in many different climates and geologic settings. For example in Italy, a series of rainfall thresholds have been identified for different regions (Govi and Sorzana (1980); Cancelli and Nova (1985); Crosta (1998); Annunziati et al. (2000); and Deganutti et al. (2000)). Rainfall thresholds have similarly been identified for other regions including the Blue Ridge mountains of central Virginia (Wieczorek et al., 2000), Hawaii (Wilson et al., 1992), Puerto Rico (Jibson, 1989; Larsen and Simon, 1993), and the San Francisco Bay region of California (Cannon and Ellen, 1985); some of these thresholds are shown in figure 20. In order to develop rainfall thresholds for the State of Vargas, it would be necessary to document the amount of rainfall necessary to trigger floods and landslides in several different storms. Documentation of storm events that are insufficient to trigger landslides (null events) is necessary for defining the threshold. Although the historical data from previous events are very useful, additional data from hourly recording rain gages near areas of flooding and landsliding is necessary for refining the threshold. Historical data of flooding events should be carefully reviewed to determine the magnitude and extent of damage to develop such measure of the amount of rainfall.
Click image for larger version.
Figure 20. Comparison of rainfall thresholds for triggering of debris flows. Debris-flow thresholds for the Blue Ridge (BR) (Wieczorek et al., 2000), Hawaii (H1, H2) (Wilson et al., 1992), San Francisco Bay region (SFBR) (Cannon and Ellen, 1985), and Puerto Rico (PR) (Jibson, 1989; Larsen and Simon, 1993).
A real-time network of rainfall monitoring used in conjunction with rainfall intensity-duration threshold curves can serve as a basis for a regional landslide warning system in Venezuela. In Hong Kong a system of about 50 automated rain gages monitors rainfall in real time and provides information on critical rainfall to civil defense authorities (Hansen et al., 1995; Brand, 1995). A real-time landslide warning system that operated in the San Francisco Bay region, California used a real-time rainfall monitoring system and National Weather Service satellite based quantitative rainfall forecasts in comparison with rainfall thresholds for issuing landslide warnings (Wilson et al., 1993).
Several components are necessary for a warning system to be effective in the coastal area of northern Venezuela. Detailed maps depicting areas that are at high risk of debris-flow activity are essential. These zones should be canvases with an automated network of rainfall stations upstream of areas susceptible to debris flows; this gives authorities the ability to issue warnings or evacuations if heavy rainfall is likely to exceed the intensity-duration thresholds. Although radar (NEXRAD) or satellite thermal sensors (GOES-8 Rainfall Estimator) may provide indications of relative rainfall amounts, such data must be calibrated to provide sufficiently accurate information to serve as the basis for emergency warnings and evacuation.
Public education on how to respond to warnings and safe means of evacuation are at least as important as the establishment of a prediction and warning system. A discussion of evacuation issues is presented by United Nations (1996d). The lack of sufficient evacuation routes along the coast of Vargas is a paramount problem. The single highway along the coast was extensively blocked during the December 1999 event, making both evacuation and post disaster recovery extremely difficult. Building additional or alternate roads, along with augmenting heliport and port facilities, could facilitate evacuation and disaster relief.
In some situations Acoustic Flow Monitors (AFM’s) that detect the specific frequency of ground motion caused by debris flows, and their telemetered linkage to downstream sirens and emergency response centers can provide valuable warning time. Automated detection and warning systems have been developed and employed in Alaska, Ecuador, and Philippines and can detect ground vibrations of passing debris flows, infer the relative magnitude of the flow, and transmit alarms to receivers downstream, allowing time for evacuation. Seismic sensors placed next to channels have been used to detect and warn of approaching debris flows (LaHusen, 1990; 1998). Arrays of AFM’s are installed at Mount Rainier, Washington, to provide warnings to cities more than 50 km from the volcano. Flows will be detected at least 30 minutes before they can reach the main populated areas (Scott, 2000). However, for most of the communities in Vargas, the relatively short distances of less than 4 km from the mid and upper drainages to the fans would leave very little time for warning and practically no time for evacuation.
Tripwire systems have also been widely employed to detect oncoming debris flows, but as with other warning systems the channels of potential debris flow path must be well known and sufficiently long for the advance warning to be practically useful for rapidly moving debris flows. For example, for the trip wire installed (after the December, 1999 event) on the Río San Julián, about 3 km upstream, warning of a debris flow traveling at an average mean velocity of 10 m/s would be only 5 minutes for the developed part of Caraballeda. Similar to AFM’s, tripwires would not provide adequate time for warning and evacuation in the communities along the coast of Vargas. In addition, false trip wire warnings are easily caused by vandalism.
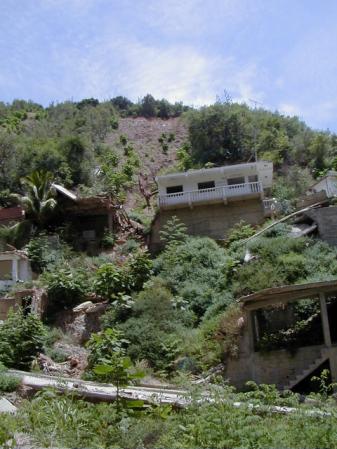
Areas such as the Vargas State where debris-flow activity and risk are high, but complete and rapid evacuation is not feasible, the Education for Self Warning and Evacuation (ESWEV) may be applicable. The distinct acoustic signal of an approaching debris flow can be recognized and has saved lives when appropriately responded to by an educated public. As documented in case studies by Scott (2000), the education of the populace to the potential risks and means of minimizing the risk from debris flows by their personal actions can be effective in minimizing casualties. Lives can be saved by the simple advice to those in potential flow pathways to seek higher ground without delay after any ground tremor perceived as an earthquake or any rumbling noise from upstream. Unfortunately, seeking higher ground during such catastrophic events as the December 1999 storm is hazardous in itself, because many landslides can start from higher locations on hillsides. In the community along the Quebrada Seca, 13 people were killed when hit by a rapidly moving landslide as they sought higher ground on the ridge above their houses (Fig. 21). Particularly in potential flow pathways prominently posted signs conveying the ESWEV message may be applicable as a part of an educational program for the hazard of debris flows.
Click image for larger version.
Figure 21. Relatively small landslide above Quebrada Seca that local residents said was responsible for killing 13 people climbing hillside to seek safety.
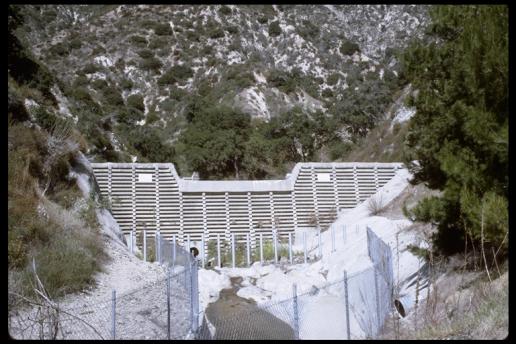
Within channels and on fans, the most common method of entrapment of flowing debris is by check dams or by debris basins (figs. 22, 23). Structures of this nature have a high initial cost and generally require annual or more frequent maintenance. For debris basins surrounded by residential development, the capability to remove material may be necessary on a 24-hr basis during storms (fig. 24). These structures could be made compatible with park and recreation areas by creating open space. Debris-flow check dams have been extensively employed in Europe, Japan, China, Indonesia, Canada, and to a lessor extent, in the United States. An assessment of structural flood and debris-flow control measures on alluvial fans prepared by USACE (1993) presents a number of useful case studies in the United States evaluating the effectiveness of measures. Details of the design and implementation of structural debris-flow defenses are summarized by Hungr et al. (1987) and Baldwin et al. (1987). VanDine (1996) presents the theoretical basis and many different examples of structural measures with design details for controlling debris flows in channels and on fans.
The utility of employing structural measures in this region of Venezuela depends upon the cost and degree of safety that can be provided against a particular magnitude and frequency of anticipated event. Takahashi et al. (2001) have examined some of the drainages and fans in the Vargas region that were strongly affected by flooding and suggested various structural measures. For the largest boulders that were transported by debris flows during the December 1999 event in most of the drainages, channel modifications, check dams, and other structural measures would be largely impractical. In addition, the large amount of uprooted trees and other vegetative debris in the December, 1999 event caused avulsions from many channels and would severely challenge the design and expected performance of structural measures. Further studies are necessary within each watershed to answer specific design questions, particularly for the magnitude of event for which they should be designed.
Click image for larger version.
Figure 22. Upstream view of concrete crib-type check dam with low-flow center section in southern California. (photograph by Los Angeles County Flood Control District).

Click image for larger version.
Figure 23. Downstream view of debris basin with concrete spillway and metal grate drain near Salt Lake City, Utah (photograph by Jeffrey Keaton).

Click image for larger version.
Figure 24. Removal of recent debris-flow deposits on February 10, 1978 from behind debris basin in Shields Canyon in southern California following severe storms. Note emergency generator for lights at upper end of basin to allow continuous removal of material after dark (photograph by Los Angeles County Flood Control District).
This work was supported by the U.S.Geological Survey (USGS), the Venezuela Ministry of Environment and Natural Resources (MARN), and the USAID Office of Foreign Disaster Assistance. Special thanks are expressed to Prof. Franco Urbani, University of Central Venezuela, for his enthusiastic support in the field and for providing key geologic insights. Virginia Jimenez Diaz of MARN provided digital mapping information necessary for analyzing volumes of deposition on the fan at Caraballeda. The efforts of Alicia Moreau Dominguez, MARN, were indispensable for support of field vehicles and logistics. Prof. Francisco Perez of the University of Texas, Prof. Paul Merrifield of UCLA, and Daniel Salcedo provided very useful information by sharing the results of their investigations of the Venezuelan events. Harry McWreath of the USGS assisted with the acquisition and analysis of the GOES-8 satellite rainfall data. Kevin Scott and Jack Epstein of the USGS provided excellent reviews of the draft manuscript that resulted in significant improvements to the final text.
Annunziati, A., Focardi, A., Focardi, P., Martello, S., and Vannocci, P., 2000, Analysis of the rainfall thresholds that induced debris flows in the area of Apuan Alps – Tuscany, Italy (19 June 1996 storm, in Claps, P. and Siccardi, F., Mediterranean Storms (Proceedings of the EGS Plinius Conference, Maratea, Italy, October 1999, Editoriale Bios, Cosenza, Italy, pp. 485-493
Audemard, F.A., De Santis, F., Montes, L., Lugo, M. and Singer, A., 1989, El Alud Torrencial del 6-9-1987 del Río Limón, al norte de Maracay, Estado Aragua (The 06-09-1987 debris flow of Río Limon, north of Maracay, Aragua State): Universidad Central de Venezuela, Caracas, Geos, n. 29, Sept. 1989, p. 250-260.
Audemard, F.A., Machette, M.N., Cox, J.W., Dent, R.L., and Haller, K.M., 2000, Map and database of Quaternary faults in Venezuela and its offshore regions: U.S. Geological Survey Open-File Report 00-018, 78p.
Baldwin, J.E., Donley, H.F., and Howard, T.R., 1987, On debris flow/avalanche mitigation and control, San Francisco Bay area, California, in Costa, J.E., and Wieczorek, G.F., eds., Debris flows/avalanches: Process, recognition and mitigation, Geological Society of America, Reviews in Engineering Geology, v. 7, pp. 223-236.
Brand, E.W., 1995, Keynote Paper: Slope instability in tropical areas: in Bell (ed.,), Proceedings of the Sixth International Symposium on Landslides, 10-14 February 1992, Christchurch, New Zealand, A.A. Balkema, Rotterdam, v. 3, pp. 2031-2051.
Brandes, H., 2000, The Venezuela flash floods and debris flows of 15-16 December 1999: Landslide News, Japan Landslide Society, v. 13, p. 5-7
Calcaterra, D., Parise, M., Palma, B., and Pelella, L., 2000, Multiple debris flows in volcaniclastic materials mantling carbonate slopes: in Wieczorek, G.F., and Naeser, N.D., eds., Debris-Flow Hazards Mitigation: Mechanics, Prediction, and Assessment: Proceedings of the Second International Conference, Taipei, Taiwan, August 16-18, 2000, A.A. Balkema, Rotterdam, p. 99-107
Cancelli, A., and Nova, R., 1985, Landslides in soil debris cover triggered by rainstorms in Valtellina (Central Alps-Italy), Proceedings 4th International Conference Field Workshop on Landslides, Tokyo, pp. 267-272.
Cannon, S.H., and Ellen, S.D., 1985, Rainfall conditions for abundant debris avalanches in the San Francisco Bay region, California: California Geology, v. 38, n. 12, pp. 267-272.
Clarke, A.O., 1996, Estimating probable maximum floods in the Upper Santa Ana basin, Southern California, from stream boulder size: Environmental & Engineering Geoscience, v. 2, pp. 165-182.
Costa, J.E., 1983, Paleohydraulic reconstruction of flash-flood peaks from boulder deposits in the Colorado Front Range: Geological Society of America Bulletin, v. 94, pp. 986-1004.
Costa, J.E., 1984, Physical geomorphology of debris flows, in Costa, J.E., and Fleisher, P.J., eds., Developments and Applications of Geomorphology, Springer-Verlag, New York, p. 268-317.
Crosta, G., 1998, Regionalization of rainfall thresholds: an aid to landslide hazard evaluation, Environmental Geology, International Journal of Geosciences, Special Issue: Hydrological triggers of diffused landsliding, Springer-Verlag, v. 35, n. 2-3, pp. 131-145
Deganutti, A.M., Marchi, L., and Arattano, M., 2000, Rainfall and debris-flow occurrence in the Moscardo basin (Italian Alps): in Wieczorek, G.F., and Naeser, N.D., eds., Debris-Flow Hazards Mitigation: Mechanics, Prediction, and Assessment: Proceedings of the Second International Conference, Taipei, Taiwan, August 16-18, 2000, A.A. Balkema, Rotterdam, pp. 67-72.
Dengo, Gabriel, 1953, Geology of the Caracas Regions, Venezuela: Bulletin of the Geological Society of America, v. 64, pp. 8-37.
Ellen, S.D., and Fleming, R.W., 1987, Mobilization of debris flows from soil slips, San Francisco Bay region, California, in Costa, J.E., and Wieczorek, G.F., eds., Debris flows/avalanches: Process, recognition and mitigation, Geological Society of America, Reviews in Engineering Geology, v. 7, pp. 31-40.
Erley, Duncan, and Kockelman, W.J., 1981, Reducing landslide hazards: a guide for planers, American Planning Association, Planning Advisory Service Report Number 359, 29p.
Glancy, P.A. and Bell, J.W., 2000, Landslide-induced flooding at Ophir Creek, Washoe County, Western Nevada, May 30, 1983: U.S. Geological Survey Professional Paper 1617, 94 p.
Govi, Marío, and Sorzana, P.F., 1980, Landslide susceptibility as a function of critical rainfall amount in the Piedmont Basin (North-Western Italy), Studia Geomorphologica Carpatho-Balcanica, v. 14, pp. 43-61.
Hansen, A., Franks, C.A.M., Kirk, P.A., Brimicombe, A.J., and Tung, Fung, 1995, Application of GIS to hazard assessment, with particular reference to landslides in Hong Kong: in Carrara, Alberto, and Guzzetti, Fausto, eds., Geographical Information Systems in Assessing Natural Hazards, Kluwer Academic Publishers, pp. 273-298.
Hungr, Oldrich, Morgan, G.C., VanDine, D.F., and Lister, D.R., 1987, Debris flow defenses in British Columbia, in Costa, J.E., and Wieczorek, G.F., eds., Debris flows/avalanches: Process, recognition and mitigation, Geological Society of America, Reviews in Engineering Geology, v. 7, pp. 201-222.
Hungr, Oldrich, 2000, Analysis of debris flow surges using the theory of uniformly progressive flow, Earth Surface Processes and Landforms, v. 25, pp. 483-495.
Jibson, R.W., 1989, Debris flows in southern Puerto Rico, in Schultz, A.P., and Jibson, R.W., eds., Landslide processes of the eastern United States and Puerto Rico: Geological Society of America Special Paper 236, pp. 29-55.
Keaton, J.R., Anderson, L.R., and Mathewson, C.C., 1988, Assessing debris flow hazards on alluvial fans in Davis County, Utah, in Fragaszy, R.J., ed., Twenty-fourth Annual Symposium on Engineering Geology and Soils Engineering: Publications and Printing, Washington State University, Pullman, Washington, pp. 98-108.
Keaton, J.R., and Mathewson, C.C., 1988, Stratigraphy of alluvial fan flood deposits: in Abt, S.R., and Gessler, J., eds., Hydraulic Engineering, Proceedings of the 1988 National Conference, Colorado Springs, Colorado, American Society of Civil Engineers, New York, p. 149-154.
Keefer, D.K., Wilson, R.C., Mark, R.K., Brabb, E.E., Brown, W.M. III, Ellen, S.D., Harp, E.L., Wieczorek, G.F., Alger, C.S., and Zatkin, R.S., 1987, Real-time landslide warning during heavy rainfall: Science, v. 238, p. 921-925.
LaHusen, R.G., 1990, Debris-flow detection system, in: The eruption of Redoubt Volcano, Alaska, December 14, 1989-August 31, 1990, U.S. Geological Survey Circular 1061.
LaHusen, R.G., 1998, Detecting debris flows using ground vibrations: U.S. Geological Survey Fact Sheet FS-236-96.
Larsen, M.C., and Simon, Andrew, 1993, A rainfall-intensity-duration threshold for landslides in a humid-tropical environment, Puerto Rico: Geografiska Annaler, v. 75A, n. 1-2, pp. 13-23.
Larsen, M.C., Wieczorek, G. F., Eaton, L.S., and Torres-Sierra, H., 2000, The Venezuela landslide and flash flood disaster of December 1999, 2nd Plinius Conference, October, 2000, Sienna, Italy, 4 p.
Larsen, M.C., Wieczorek, G.F., Eaton, L.S., and Torres-Sierra, H. , 2001, Natural hazards on alluvial fans: the debris flow and flash flood disaster of December 1999, Vargas State, Venezuela, in W.F. Sylva, ed., Proceedings of the 6th Caribbean Islands Water Resources Congress, Mayaguez, Puerto Rico, February 22-23, 2001, unpaginated CD.
Lips, E.W., and Wieczorek, G.F., 1990, Recurrence of debris flows on an alluvial fan in Central Utah: American Society of Civil Engineers, Proceedings of International Symposium Hydraulics/Hydrology of Arid Lands, San Diego, California, July 30- August 2, 1990, p. 555-560.
MARN, 1999, Cronica Cartografica de la Catastrofe de Venezuela: Ministerio del Ambiente y de los Recursos Naturales (MARN), Servicio Autonomo de Geografia y Cartografia Nacional, 15 p.
MARN, 2000, Comison ambiental para la evaluation y tratamiento intergral de las cuencas torrenciales del Estado Vargas, Informe de advance: Marzo, 2000, 43 p.
Martinez, E., 2000, Evento Meteorologico sobre el Litoral Central en Diciembre 1999: Informe inedito.
Merifield, P.M., 1992, Surficial slope failures: the role of vegetation and other lessons from the 1978 and 1980 rainstorms, in B.W. Pipkin and R.J. Proctor, eds., Engineering geology practice in southern California, Special Publication No. 4, Southern California Section, Association of Engineering Geology, Star Publishing Co., Belmont, California, p. 613-637.
Merifield, P.M., 2001, Observations on the December 1999 catastrophic debris flows and floods in Venezuela in: Proceedings of the 6th Annual Engineering Geology and Geotechnical Engineering Symposium, Las Vegas, Nevada, March 28-30, 2001, p.
Moscariello, A. and Deganutti, A.M., 2000, Sedimentary and hydrologic processes of a debris-flow dominated alluvial fan-Moscardo Fan, Italy: in Wieczorek, G.F., and Naeser, N.D., 2000, eds., Debris-Flow Hazards Mitigation: Mechanics, Prediction, and Assessment: Proceedings of the Second International Conference, Taipei, Taiwan, August 16-18, 2000, A.A. Balkema, Rotterdam, p. 301-309.
Newhall, C.G., and Punongbayan, R.S., eds., 1996, Lahars, lahars, and more lahars, in Fire and Mud, Eruptions and Lahars of Mount Pinatubo, Philippines: University of Washington Press, p. 893.
Pierson, T.C., and Costa, J.E., 1987, A rheologic classification of subaerial and sediment-water flows, in Costa, J.E., and Wieczorek, G.F., eds., Debris flows/avalanches: Process, recognition and mitigation: Geological Society of America, Reviews in Engineering Geology, v. 7, p. 1-12.
Plafker, G., and Ericksen, G. E., 1978, Nevados Huascarán Avalanches, Peru: in Voight, B., ed., Rockslides and Avalanches, 1 Natural Phenomena: New York, Elsevier, p. 277- 314.
Röhl, E., 1950, Los Diluvios en las Montañas de la Cordillera de la Costa. Boletín de la Academia de Ciencias Físicas, Matemáticas y Naturales, Venezuela, v.38, p.1-28.
Salcedo, D.A., 2000, Los flujos torrenciales catastróficos de Diciembre de 1999, en el estado Vargas y en Caracas: Características y lecciones apprendidas. Memorias XVI Seminario Venezolano de Geotecnia, Caracas. p. 128-175.
Sancio, R.T., and Barrios, Rosalba, 2000, Disaster in Venezuela: the floods and landslides of December 1999. Natural Hazards Observer, v. 24, n. 4, p. 1-2.
Schubert, Carlos, 1985, Aluviones colgantes en la cordillera de la costa: indicio de aridez durante el quaternario tardio, Acta Científica Venezolana, v. 36, p. 201-202.
Schuster, R.L., Salcedo, D.A., and Valenzuela, L., in press, Catastrophic landslides of South America, S. Evans and J. DeGraff, eds., Reviews in Engineering Geology, v. 14, Geological Society of America, pp.
Scott, K.M., 2000, Precipitation-triggered debris-flow at Casita Volcano, Nicaragua: Implications for mitigation strategies in volcanic and tectonically active steeplands: in Wieczorek, G.F., and Naeser, N.D., eds., Debris-Flow Hazards Mitigation: Mechanics, Prediction, and Assessment: Proceedings of the Second International Conference, Taipei, Taiwan, August 16-18, 2000, A.A. Balkema, Rótterdam, p. 3-13.
Scott, K.M., Vallance, J.W., Kerle, Norman, Macías, J.L., Strauch, Wilfried, and Devóli, Graziella, in press,Catastrophic, precipitation-triggered lahar at Casita volcano, Nicaragua–Flow transformations, flow bulking, and future mitigation strategies.
Sorriso-Valvo, M., 1988, Landslide-related fans in Calabria: in Harvey and Sasa, eds., Geomorphic Proceses in Environments with Strong Seasonal Contrasts, v., 1, Catena suppl. 13, p. 109-121.
Stallard, R. F., 1988, Weathering and erosion in the humid tropics, in Larman and Meybeck, eds., Physical and Chemical Weathering in Geochemical Cycles, Kluwer Academic Publishers, Dordecht, Holland, pp. 225-246.
Takahashi, T., Nakagawa, H., Maki, N., Jauregui, E., Chigira, M., Onda, Y., and Aguirre-Pe, J., 2001, Flood and sediment disasters caused by the 1999 heavy rainfall in Venezuela: Research Report on Natural Disasters, Sponsored by the Ministry of Education, Science, Sports and Culture (Japan), Grant No. 11800020, CD, February, 2001.
United Nations, 1996a, Mudflows, Experience and Lessons Learned from the Management of Major Disasters, Chapter 8, Case Histories: United Nations Department of Humanitarian Affairs, Geneva, p. 71-124.
United Nations, 1996b, Mudflows, Experience and Lessons Learned from the Management of Major Disasters, Chapter 4, Mudflow prevention: United Nations Department of Humanitarian Affairs, Geneva, p.21-42.
United Nations, 1996c, Mudflows, Experience and Lessons Learned from the Management of Major Disasters, Chapter 5,Mudflow disaster mitigation planning: United Nations Department of Humanitarian Affairs, Geneva, p.43-50.
United Nations, 1996d, Mudflows, Experience and Lessons Learned from the Management of Major Disasters, Chapter 6, Evacuation: United Nations Department of Humanitarian Affairs, Geneva, p. 51-60.
Urbani, F. and Ostos, M., 1989, El Complejo Avila, Cordillera de La Costa, Venezuela. Geos, UCV, Caracas, (29): 205-217.
Urbani, F., O., Contreras, L., García de los Salmones, I., Sabino, A., Aranguren, R., Uzcátegui, and Baena, J., 1997. Cartografía geológica de flanco sur del macizo de El Avila desde Maripérez hasta Izcaragua, Cordillera de la Costa, D.F. y estado Miranda, Venezuela. Mem. VIII Congr. Geol. Venezolano, Caracas, en prensa
Urbani F., Rodriguez J. A.; Barbosa L., Rodriguez S., Melo L., Cano L. and Vivas V., 2000, Geologia del estado Vargas, Venezuela. Simposio Internacional Los aludes torrenciales de Venezuela de diciembre de 1999, Univ. Central Venezuela. Faculti. Ingenieria, Caracas. November.
USACE, 1993, Assessment of structural flood-control measures on alluvial fans: US Army Corps of Engineers Hydrologic Engineering Center, prepared for Federal Emergency Management Agency, 76 p.
USAID, 2000, Venezuela Factsheet, February, 2000. USAID-Office of Foreign Disaster Assistance, 2 p.
VanDine, D.F., 1996, Debris flow control structures for forest engineering, Province of British Columbia Ministry of Forests Research Program, 68 p.
Varnes, D.J., 1978, Slope movement types and processes: in Schuster, R.L., and Krizek, R.J., eds., Landslides Analysis and Control, Special Report 176, Transportation Research Board, National Academy of Sciences, Washington, D.C., p. 11-33.
Vicente, G.A., Scofield, R.A., and Menzel, W.P, 1998, The operational GOES Infrared rainfall estimation technique, Bulletin of American Meteorological Society, v. 79, pp. 1883-1898.
Wehrmann, M., 1969, Mapa Geologico de la Region Colonia Tovar-Guatire: IV Congreso Geologico Venezolano, MinisteRío de Minas e Hidrocarburos, scale 1:100,000.
Wieczorek, G.F., Harp, E.L., and Mark, R.K., and Bhattacharyya, A.K., 1988, Debris flows and other landslides in San Mateo, Santa Cruz, Contra Costa, Alameda, Napa, Solano, and Sonoma Counties, and factors influencing debris-flow distribution, in Ellen, S.D., and Wieczorek, G.F., eds., Landslides, floods, and marine effects of the January 3-5, 1982 storm in the San Francisco Bay region, California: U.S. Geological Survey Professional Paper 1434, p. 133-161.
Wieczorek, G.F., Morgan, B.A., and Campbell, R.H., 2000, Debris-flow hazards in the Blue Ridge of central Virginia: Environmental & Engineering Geoscience, v. VI, n. 1, p. 3-23.
Wilson, R.C., Mark, R.K., and Barbato, G.E., 1993, Operation of a real-time warning system for debris flows in the San Francisco Bay area, California: in Shen, H.W., Su, S.T., and Wen, F., eds., Hydraulic Engineering ’93, Proceedings of the 1993 Conference, Hydraulics Division, American Society of Civil Engineers, San Francisco, CA, July 25-30, 1993, v. 2., pp. 1908-1913.
Wilson, R.C., Torikai, J.D., and Ellen, S.D., 1992, Development of rainfall warning thresholds for debris flows in the Honolulu District, Oahu: U.S. Geological Survey Open-file Report 92-521, 45 p
Wolle, C., and Hachich, W., 1989, Rain-induced landslides in southeastern Brazil: Proceedings of the XII International Congress on Soil Mechanics and Foundation Engineering, Río de Janeiro, Brazil, pp. 1639-1642.
Tables
2. Characterization of flood and debris-flow deposition in examined watersheds.
3. Comparison of depositional volume of debris flows worldwide.
Plates
2. Debris-Flow Deposits and Contours of Maximum Boulder Size on the Caraballeda Fan, Venezuela
3. Debris-Flow and Flood Deposit Thickness for December, 1999 Storm on the Caraballeda Fan, Venezuela
Appendices
A. Measurements of site characteristics of landslides
B. Measurements of deposits in channels Large file (549 kb)
Photo Gallery of all images with highest resolution images available.
| AccessibilityFOIAPrivacyPolicies and Notices | |
| |
|