skip header
USGS: science for a changing world - www.usgs.gov
U.S. Geological Survey Open-File Report 03-001
Surficial Sediment Data from the Gulf of Maine, Georges Bank, and Vicinity: A GIS Compilation

BROWSE MAPS

Skip Table of Contents group; go to browse mapsOFR03-001 Home: return to OFR03-001 homepageINTRODUCTION: Go to introduction and project background descriptionNOMENCLATURE: Go to the section describing size distributions and sediment classificationBROWSE MAPS: current selectionDATA CATALOG: Go to data catalog and browse data and metadata listDATA DICTIONARY: Go to data dictionary describing data field attributesPHOTO GALLERY: Go to photo gallery with images of ships and samplers involved in the collection of the data presented in this report.REFERENCES: Go to bibliography listing to view suggested referencesRELATED WEBSITES: Go to a list of related websitesACKNOWLEDGMENTS: view acknowledgmentsCONTACTS: view contact informationDISCLAIMER: view disclaimer informationREADME: view readme informationblank.

VISUALIZING THE TEXTURAL DATA

Although also provided in ASCII (.txt) and Microsoft Excel (.xls) formats, the data available on this report are supplied in Environmental Systems Research Institute, Inc. (ESRI), shapefile format to be viewed and processed with a Geographic Information System (GIS) application (e.g. ArcView, ArcExplorer, MapInfo). Users without a GIS application Overview of data distribution and classification. package capable of importing the data or users simply wishing to view browse graphics of the data may do so either by selecting linked areas on the interactive map below or through the table located near the bottom of this page. Browse graphics showing the extent of sample locations for individual data sets can be viewed on the Data Catalog page of this report.

Color coding is used to illustrate the surficial sediment distribution documented by the point coverages. Samples for which full grain-size data are available were assigned classifications based on definitions found in Shepard (1954). Classification was approximated for those samples for which only lithologic descriptions or partial data are available. In displaying the textural descriptors, the general ranking principle of the main constituents (e.g. gravel, sand) and modifying constituents (e.g. sandy, silty) follows in order of decreasing coarseness from warmer to cooler colors. Specifically, the color display follows this pattern:


Red - sediment whose main phase is gravel (>50%); also rocky bottom, boulders


Orange - sediment with significant amounts of gravel (>10%, but <50%)


Yellow - sediment whose main phase is sand without significant gravel or mud


Light Green - sediment whose main phase is sand (>50%) with significant silt or clay


Dark Green - sediment with significant sand, silt, and clay


Light Blue - sediment whose main phase is silt (>50%) with significant sand or clay


Blue - sediments whose main phase is silt without significant sand or clay


Light Purple - sediment whose main phase is clay (>50%) with significant sand or silt


Purple - sediments whose main phase is clay without significant sand or silt


Black - bedrock 

SEDIMENT DISTRIBUTION MAPS

To access PREVIEW images showing sample locations and the distribution of surficial sediments from selected areas off the northeastern U.S., click within the desired box from the map below.  A PREVIEW image in GIF format will be displayed in a new browser window.  A larger PREVIEW image in JPEG format may be selected from the new browser window. The PREVIEW images may also be found by browsing the /maps directory located at the top level of this report. The user may select to view the maps with a system program and may be opened in an appropriate graphics application (such as Corel Draw or Adobe Illustrator). Instructions for downloading the full-resolution maps may be found by going here.

Index map to allow visual selection of detailed images showing the distribution of surficial sediments from selected areas.

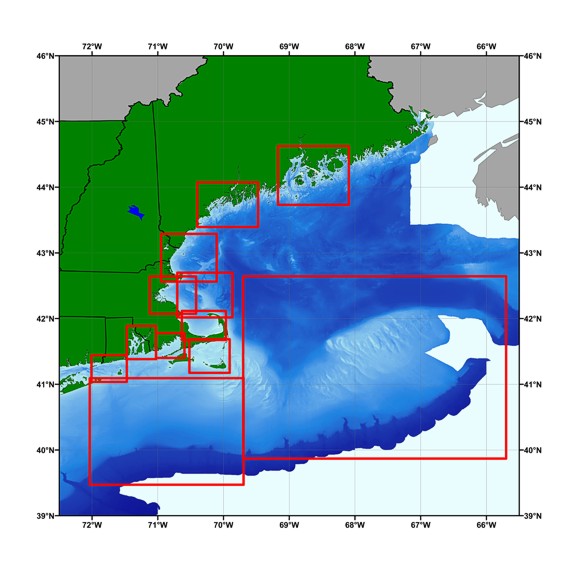
Index map of available detailed images showing the
distribution of surficial sediments from selected areas.

Images showing the distribution of surficial sediments from selected areas can also be viewed through the table below. The sediment textural classification color scheme is as described above. Selecting an image map from the GEOGRAPHIC AREA  column will display a small preview image in GIF format  in a new browser window.  A larger PREVIEW image in JPEG format may be selected from the new browser window.  All PREVIEW images have been reduced for optimum viewing with a web browser. Because the PREVIEW images have been reduced to a standard length of 1250 pixels, please note that the images will not be of the same scale.   

Get free Adobe Acrobat Reader; link to Adobe To access a larger resolution version of an individual map, the user is advised to download the desired PDF FILE.  To view the PDF document requires the latest version of Adobe Acrobat Reader or similar software.  If you wish to download the latest version of Acrobat Reader free of charge, click here.

GEOGRAPHIC AREA

PREVIEW

PDF FILE

Overview of surficial sediments off the northeastern United States overview 30 X 30 in
48 X 48 in
Penobscot Bay to
Frenchman Bay,ME
penobscotbay Tabloid
Casco Bay to
Boothbay Harbor, ME
cascobay Tabloid
New Hampshire Inner Shelf region: Gloucester, MA to Ogunquit, ME nhinnershelf Tabloid
Boston Harbor and Massachusetts Bay, MA bostonharbor Tabloid
Stellwagen Bank and Massachusetts Bay region, MA stellwagenbank Tabloid
Cape Cod Bay, MA capecodbay Tabloid
Nantucket Sound and
Vineyard Sound, MA
nantucketsound Tabloid
Buzzards Bay and
Vineyard Sound, MA
buzzardsbay Tabloid
Narragansett Bay, RI and Southeastern Massachusetts narragansett Tabloid
Block Island Sound, RI blockisland Tabloid
Southern New England Shelf,
MA to RI; "mud patch" south of Martha's Vineyard, MA
mudpatch Tabloid
Georges Bank region: Northeast Channel to
Nantucket Shoals
georgesbank Tabloid

Downloading a selected file with Microsoft Internet Explorer

To download a data file while using Microsoft Internet Explorer, the user should select the desired file by placing the system pointer on the file name from the data list and pressing the right mouse button. This will display a pull-down menu from which the user should drag the mouse to highlight "Save target as ..." and release the mouse button. Internet explorer will then prompt the user to specify the name and location of where the selected data file should be saved.

Downloading a selected file with Netscape

To download a data file while using the Netscape browser, the user should select the desired file by placing the system pointer on the file name from the data list and pressing and holding the right mouse button. This will display a pull-down menu from Netscape. The user should drag the mouse to highlight "Save this link as ..." and release the mouse button. Netscape will then prompt the user to specify the name and location of where the selected data file should be saved. Different operating systems and newer versions of Netscape might work somewhat differently.


skip index

OFR03-001 Home | Introduction | Nomenclature | Browse Maps | Data Catalog | Data Dictionary

[an error occurred while processing this directive]