

Map of Coastal
Vulnerability
 |
RESULTS
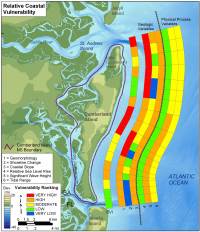 |
| Figure 5. Relative Coastal Vulnerability for Cumberland Island National Seashore. Click on figure for larger image. |
The CVI values calculated for Cumberland Island range from 7.75 to 17.89. The mean CVI value is 12.66; the mode is 16.00 and the median is 13.06. The standard deviation is 3.27. The 25th, 50th, and 75th percentiles are 9.0, 13.0 and 15.5, respectively.
Figure 5 shows a map of the coastal vulnerability index for Cumberland Island National Seashore. The CVI scores are divided into low, moderate, high, and very high-vulnerability categories based on the quartile ranges and visual inspection of the data. CVI values below 9.0 are assigned to the low vulnerability category. 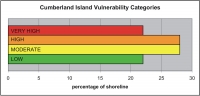 |
| Figure 6. Percentage of Cumberland Island shoreline in each CVI category. Click on figure for larger image. |
Values from 9.0 to 13.0 are considered moderate vulnerability. High-vulnerability values lie between 13.01 and 15.5. CVI values above 15.5 are classified as very high vulnerability. Figure 6 shows the percentage of Cumberland Island shoreline in each vulnerability category. Nearly 30 km (19 miles) of shoreline is evaluated along the national seashore. Of this total, twenty-two percent of the mapped shoreline is classified as being at very high vulnerability due to future sea-level rise. Twenty-eight percent is classified as high vulnerability, twenty-eight percent as moderate vulnerability, and twenty-two percent as low vulnerability.
|
|