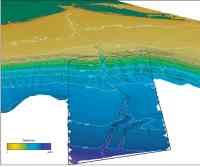
 | Figure 1. Perspective view, looking toward the northwest, of a portion of the continental shelf incised by the Hudson Shelf Valley, and the slope and rise incised by the Hudson Canyon. The black line outlines the limits of the survey carried out by the NOAA Ship Ronald H. Brown shown on Sheet 1 and Sheet 2.
|
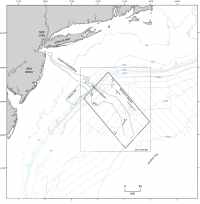 |
Figure 2. Map showing the location of the Hudson Canyon on the continental slope and rise offshore of the northeast United States. Data presented on Sheet 1 and Sheet 2 are from the NOAA Ship Ronald H. Brown survey of the Hudson Canyon (limits outlined by the heavy black line), supplemented by multibeam surveys of the Hudson Shelf Valley (Butman and others, 2003), the Hudson Canyon (WHOI), and the outer shelf (STRATAFORM) (Goff and others, 1999), and by the NOAA Coastal Relief Model. Light gray lines are the location of widely-spaced 3.5- and 10-kHz subbottom profiles. Lines labeled A-G are locations of profiles shown in figure 10.
|
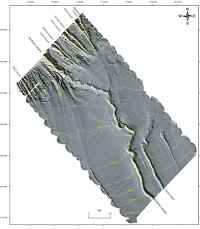 |
Figure 3. Map showing shaded-relief image of the sea floor created by exaggerating the bathymetry ten times and then artificially illuminating the relief with a light source positioned 30 degrees above the horizon from an azimuth of 45 degrees. This illumination reduces some of the artifacts in the along-track direction visible in the companion image on Sheet 1 and enhances the northwest-southeast-trending bathymetric features on the continental rise.
|
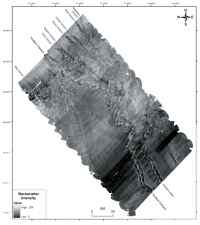 |
Figure 4. Map showing the backscatter intensity derived from the multibeam data. The backscatter intensity is presented here as an 8-bit gray-scale image with high backscatter values shown as white and light gray and low-backscatter values shown as dark gray and black.
|
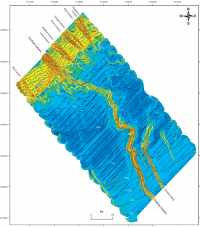 |
Figure 5. Map showing slope of the sea floor. The slope is typically 3-5° over the continental slope, less than 0.5° over the upper continental rise, and 0.5-1.2° over the lower rise. The slopes of the canyon walls range from 5-25°.
|
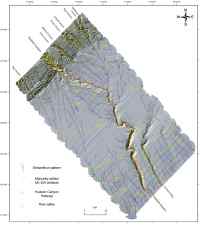 |
Figure 6. Map showing streamflow drainage for areas draining at least 1,000 pixels (10 square km). The streamflow pattern shows drainage into Hudson Canyon from the northeast, the down-slope drainage along the mass-transport pathways to the southwest of Hudson Canyon, and downslope drainage characterized by numerous individual pathways on the lower rise. The unnaturally straight northeast-southwest trending streamflow lines that run parallel to the ship track, especially noticeable in the southwest corner of the map, result from errors in the multibeam data at the outer edges of the swaths.
|
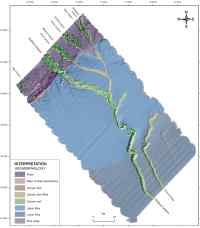 |
Figure 7. Geomorphic provinces identified in the survey area.
|
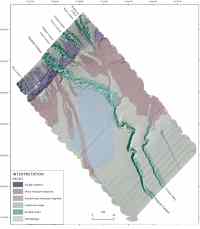 |
Figure 8. Map of sea-floor environments based on backscatter intensity, physiography, and subbottom characteristics revealed in widely spaced 3.5- and 10-kHz subbottom profiles.
|
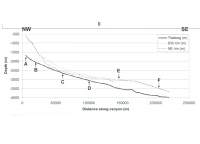 |
Figure 9. Profiles showing the morphology of Hudson Canyon. Map (I) shows the location of the profiles shown in panels II and III. Panel II shows profiles along the thalweg of Hudson Canyon as well as along the northeastern and southwestern rims of the canyon. The profiles are based on measurements every 5 km along the thalweg and coinciding measurements on the two canyon rims from lines perpendicular to the thalweg. The canyon has the most relief on the upper continental slope, the least relief on the upper rise along the stretch of the canyon adjacent to the sediment-wave field, and increased relief on the lower rise. Cross-canyon profiles nearly perpendicular to the canyon thalweg (III) also illustrate the change in canyon relief across the survey area. Locations of profiles in Panel III are shown on the map (I) as well as by the lettered arrows on Panel II.
|
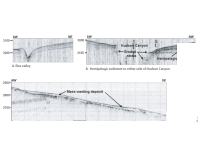 |
Figure 10. High-resolution seismic profiles showing (A) a lower continental rise valley that is cut into hemipelagic sediment and maintained by preferentially reduced sedimentation within the valley, (B) outcrop of older strata on the walls of Hudson Canyon and hemipelagic deposits to either side of the canyon, (C) outcrop of older strata on the walls of Ryan Canyon where it crosses the lower continental slope, (D) mass-wasting scarp on the lower continental slope northeast of Hudson Canyon, (E) mass-wasting scarp on the middle continental slope southwest of Hudson Canyon, (F) mass-transport deposit on the continental rise northeast of Hudson Canyon showing the deposit's seismically transparent nature and rough surface, and (G) mass-transport deposit overlying hemipelagic sediment and partially filling a valley on the upper continental rise. Profile locations shown in figure 2.
 To view files in PDF format, download free copy of Adobe Acrobat Reader. To view files in PDF format, download free copy of Adobe Acrobat Reader. |