Digital Mapping Techniques '04— Workshop Proceedings
U.S. Geological Survey Open-File
Report 2004–1451
Completion of the First Phase of the Kentucky Digital Geologic Mapping Program
Kentucky Geological Survey, Room 228 Mining and Minerals Resources Building,
University of Kentucky, Lexington, Kentucky 40506
Telephone: (859) 257-5500; Fax: (859) 257-1147; e-mail: wanderson@uky.edu
abstract
The Kentucky Geological Survey (KGS) has completed the vectorization of the 707 geologic quadrangle maps (7.5 × 7.5-minute) that cover the state. Under the National Cooperative Geologic Mapping Program and other State funding awards from 1996-2004, this milestone was reached in May 2004. It provides Kentucky with complete digital geologic map coverage at a scale of 1:24,000. At the completion of each year’s contractual phase of data capture and attribution, the project deliverables consisted of (1) a hard-copy map product (1:100,000-scale) and (2) the digital geologic data (both as individual quadrangles and as compiled geologic data layers, which represent spatially referenced features including faults, formation contacts, coal beds, fossil, and quarry locations. In 2005, these maps will be compiled into 32 individual 1:100,000-scale geologic maps by edge-matching each boundary (Figure 1). In the process of this compilation, the 1:24,000-scale geologic map data are generated for separate release as Digitally Vectorized Geologic Quadrangles (DVGQ’s). Some of these DVGQ’s have already been released to the public, the remainder are undergoing final review, editing, and file processing. In addition to the new DVGQ product, seven of the compiled 30 × 60 minute geologic quadrangle maps (1:100,000-scale) have been published in a new Geologic Map series at KGS.
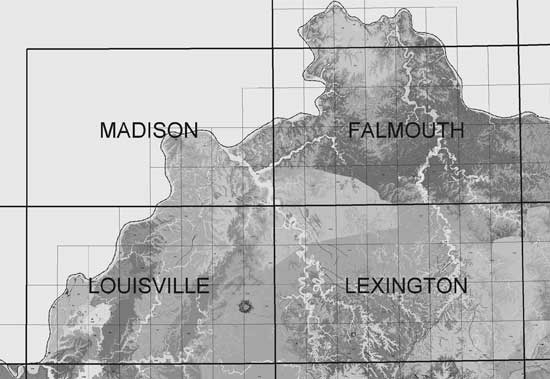 |
| Figure 1. A part of central Kentucky showing geology of four 1:100,000-scale
published maps, each covering an area of 30 × 60 minutes. These maps were
compiled from digital 1:24,000-scale geologic quadrangle data (up to 32
of these 1:24,000-scale quadrangles occur in each map; their outlines are
shown by the thin black lines). |
During the past decade, the KGS Digital Mapping Program employed over 50 staff and students, who converted geologic quadrangle maps into digital format at a cost of about $3.8 million. The geologic quadrangle maps that were digitized were created during the Kentucky Geological Survey–U. S. Geological Survey mapping program from 1960 to 1978, which mapped the entire state at 1:24,000-scale, at a cost of $20.9 million. That original mapping program employed over 250 geologists. The dedicated work of many people in both programs made the mapping of Kentucky possible, and provides the most detailed digital geologic maps of any large area in the United States.
Challenges and Lessons Learned
Challenges during the first phase of the Digital Geologic Mapping Program included: (1) maintaining sustained funding levels, (2) discriminating between disparate mapping philosophies used during the original mapping, (3) resolving complex stratigraphic problems, and (4) establishing standards for GIS platforms, vectorization, attribution, and database issues.
Many of the original geologic mappers had different mapping philosophies, and we categorized them as “lumpers or splitters” of stratigraphic units. Some of the more common issues dealt with were stratigraphic name changes, incorrect correlation of formation contacts, and lumping of minor members or splitting of formations. Normal facies, lithologic, and geologic changes in rocks and in their nomenclature also had a great impact on stratigraphic correlation.
KGS instituted a stratigraphic committee to resolve many of the stratigraphic inconsistencies, but many correlation issues could not be addressed until digitizing began. This caused many problems in edge matching adjacent quadrangles, and is unavoidable when dealing with stratigraphy in sedimentary rocks. Facies changes, pinchouts, unconformities, fluvial and marine channels, and transgressive sequences were also a major influence on the lithostratigraphic representation of rocks as portrayed on geologic quadrangle maps. Because different mappers often worked in adjacent quadrangles at different times, many of the quadrangles did not correlate properly. Each of these problems made it challenging to create the 30 × 60 minute quadrangles, but their resolution also revealed new geologic features or interpretations which had not been previously mapped
.Early in the program, KGS created several committees to address the issues of computer systems, GIS platforms, database organization, vectorization and attribution (Anderson and others, 1997). The committee’s decisions would affect the capture, classification, content, and storage of geologic map data. ArcInfo and ArcView are robust GIS software and were used to capture the data. KGS was a founding participant in the North American Data Model (NADM) Steering Committee, and continues to contribute to that body through the Data Model Design Team (Weisenfluh, 2001). The Kentucky data have been used as a prototype database for developing the NADM (Soller and others, 2002).
Because more than 50 employees were digitizing quadrangles, some issues arose regarding the standard procedure for digitizing. Initially, we used an automatic vectorization procedure (Anderson and others, 1997). Many of our staff did not like this method because of the time required for post-digitizing cleanup and because the resultant vector lines were very jagged; this occurred where lines were closely spaced, causing the autovectorizing routine to “jump” from one line to a line nearby. Therefore, many of our staff preferred to use the manual method for digitizing to resolve those problems. Another important issue was how many vertices to use on rounded contact lines, since the more vertices used, the longer the time required to complete a quadrangle. KGS created an in-house manual describing the procedure for digitizing geologic quadrangles in order to create a standard digital product. With refinement of our work process (sometimes through trial and error), modification of our techniques, and the maturity of the staff both in technical ability and responsibility, we created three or more teams and were able to complete our data capture ahead of our original schedule.
The Kentucky Spatial Database
KGS has a long history of providing access to geologic information via the Internet and has sought to distribute its tabular and spatial databases to the public (Anderson and others, 1999; Curl, 2000). As the databases grew, the complexity of serving the data in an efficient manner became more important. During the initial stages of digital mapping, KGS began to examine the issues of serving the spatial data via the Internet. KGS formed the Geospatial Analysis Section to specifically address the problems of managing and serving the large amount of geologic map data being generated.
KGS decided to construct and maintain its own spatial databases, composed of a large geologic map database with numerous related, specialized databases (Anderson and others, 1999; Weisenfluh and others, 2002). ArcSDE was chosen as the software platform to manage these data. Data layers are being prepared in a single-coordinate system and datum (NAD 83, decimal degrees or Kentucky Single Zone) to simplify data integration. The specialized KGS databases (oil, water, coal, sample locations, and minerals) are maintained in a relational database, but have been spatially enabled by adding locations to feature classes in SDE (Weisenfluh and others, 2002).
Demand for the data
Within weeks of the first release of our digital data, numerous Federal and State agencies and University researchers actively sought it. One University purchased the entire DVGQ set before it was even completed. Other Federal and State agencies and private industry have sought this digital data for environmental, mapping, planning, land use, engineering and exploration purposes.
Derivative Maps
The 7.5-minute DVGQ dataset is the basis of, and fundamental map for, many derivative products that KGS is and will be developing in the future. Currently, we are producing county geologic maps, planning and land use county maps, and hydrologic atlases for each county. A prototype of a karst potential index map (Crawford and Currens, 2004) has been developed and demonstrated by using lithologic characteristics of each geologic map unit in a GIS environment. Geologic hazards maps and mineral resource are being considered for future products as derivative maps.
References
Anderson, W.H., Morris, L.G., and Sparks, T.N., 1997, Semi-automated data capture for vectorizing geologic quadrangle maps in Kentucky, in Soller, D.R., ed., Proceedings of a Workshop on Digital Mapping Techniques: Methods for Geologic Map Data Capture, Management, and Publication: U.S. Geological Survey Open-File Report 97–269, p. 9–13, accessed at http://pubs.usgs.gov/of/1997/of97-269/anderson.html.
Anderson, W.H., Sparks, T.N., Patton, J., and Yang, X.Y., and Sergeant, R.E., 1999, Integration of digital geologic databases and a map database in Kentucky, in Soller, D.R., ed., Digital Mapping Techniques ’99—Workshop Proceedings: U.S. Geological Survey Open File Report 99–386, p. 123–125, accessed at http://pubs.usgs.gov/of/1999/of99-386/anderson1.html.
Crawford, M.M., and Currens, J.C., 2004, Digital Geologic data and a new karst potential index map: a work in progress (abstract): Geological Society of America, Abstracts with Programs, Vol. 36, No. 2, p. 137.
Curl, D.C., 2000, Integrated geospatial data: Irvine 30 × 60 minute quadrangle, east-central Kentucky, in Soller, D.R., ed., Digital Mapping Techniques ’00—Workshop Proceedings: U.S. Geological Survey Open-File Report 00–325, p. 175–176, accessed at http://pubs.usgs.gov/of/2000/of00-325/curl.html.
Soller, D.R., Brodaric, Boyan, Hastings, J.T., Wahl, Ron, and Weisenfluh, G.A., 2002, The central Kentucky prototype: An object-oriented geologic map data model for the National Geologic Map Database: U.S. Geological Survey Open-File Report 02–202, 40 p., accessed at http://pubs.usgs.gov/of/2002/of02-202/.
Weisenfluh, G.A., 2001, Map unit descriptions and the North American Data Model, in Soller, D.R., ed., Digital Mapping Techniques ’01—Workshop Proceedings: U.S. Geological Survey Open-File Report 01–223, p. 79–86, accessed at http://pubs.usgs.gov/of/2001/of01-223/weisenfluh.html.
Weisenfluh, G.A., Eaton, N.K., Nelson, K., 2002, Distributed spatial databases—The MIDCARB Carbon Sequestration Project, in Soller, D.R., ed., Digital Mapping Techniques ’02—Workshop Proceedings: U.S. Geological Survey Open-File Report 02–370, p. 13–19, accessed at http://pubs.usgs.gov/of/2002/of02-370/weisenfluh.html.