For General P-T Conditions In The Deep-Water Bering Sea Basins:
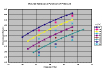
These 4 graphs and 1 data table provide calculated reference points for pressures between 30
and 52 MPa, temperatures between 4° and 80°C. Differences at a constant temperature
can be viewed as the effect of water depth differences on gas compression at a constant
depth below sea floor. Differences at a constant pressure can be viewed as the effect of
differing geothermal gradients on gas compression at a constant depth below sea surface, or
at a constant depth below sea floor if water depth is also constant.
|
Figure 1. Volume Ratio as a Function of Pressure
(84 Kb)
|
|
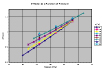
Figure 2. Z-Factor as a Function of Pressure
(68 Kb)
|
|
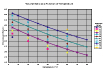
Figure 3. Volume Ratio as a Function of Temperature
(96 Kb)
|
|
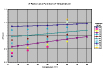
Figure 4. Z-Factor as a Function of Temperature
(76 Kb)
|

|
Table 1. Calculated Values: Volume Expansion Ratio and Z-Factor
(80 Kb)
|
For the Specific P-T Conditions in the Central Aleutian Basin:
This suite of graphs and associated table provide calculated points of specific relevance to the
pressure-temperature conditions expected in the central Aleutian Basin, as a function of depth
below sea floor. Sea floor depth is taken to be 3600 m for this example. Geothermal temperature
gradient of 60°C/km is based on Hein et al. (1978) and Langseth et al. (1980). Hydrostatic
pressure is approximated to be linear with depth. The base of natural gas hydrate stability under
these conditions is ~360 m below seafloor , at ~25.6 °C and 39.6 MPa.
|
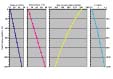
Figure 5. Aleutian Basin P-T Path: Pressure, Temperature, Volume Ratio and Z-Factor as a
function of Depth Below Sea Floor
(100 Kb)
|

|
Table 2.Calculated Values: Aleutian Basin P-T Path
(68 Kb)
|
For General Reference (0-80°C, 1-60 MPa):
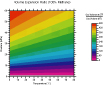
These volume expansion ratio contours are presented for general reference for 100% methane
gas. Values express the ratio of free gas volume at STP to free gas volume at the specified
pressures and temperatures. For comparison, note that the expected gas yield for dissociation
of natural gas hydrate is ~164 volumes of free gas at STP for every volume of solid
hydrate (Collett, 2000).
|
Figure 6. Volume Ratio Contours 0°-80°C, 1-60 MPa
(144 Kb)
|