Any use of trade, product, or firm names is for descriptive purposesonly and does not imply endorsement by theU.S. Government.
Although this Federal Geographic Data Committee-compliant metadatafile is intended to document the data set in nonproprietary form,as well as in ArcInfo format, this metadata file may include someArcInfo-specific terminology.
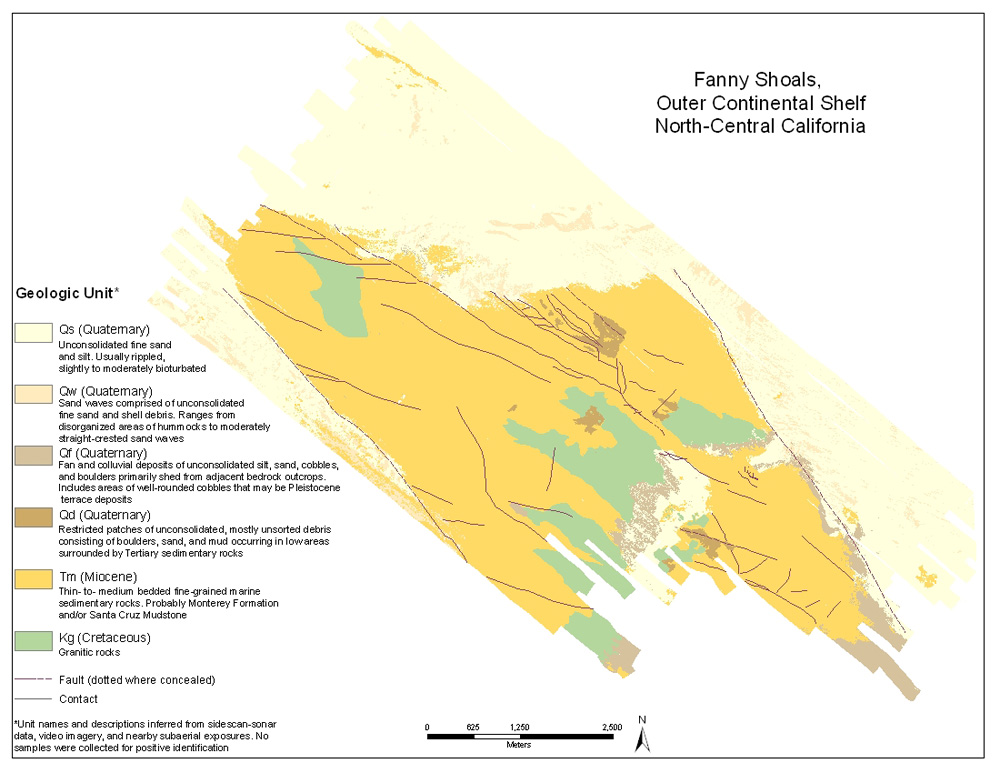
Golden, Nadine, 2005, Fanny Shoals Habitat polygons:.This is part of the following larger work.Online Links:
Golden, Nadine, 2005, Benthic Habitat and Geologic Mapping of the outer Continental Shelf of North-Central California Edition: 1.0: Open-File Report USGS OFR 2006-1177, U.S. Geological Survey, Coastal and Marine Geology Program, Western Coastal and Marine Geology, Santa Cruz, CA.Online Links:
This is a Vector data set.It contains the following vector data types (SDTS terminology):
The map projection used is NAD_1983_UTM_Zone_10N.
Planar coordinates are encoded using coordinate pair
Abscissae (x-coordinates) are specified to the nearest 0.000016
Ordinates (y-coordinates) are specified to the nearest 0.000016
Planar coordinates are specified in meters
The horizontal datum used is North American Datum of 1983.
The ellipsoid used is Geodetic ReferenceSystem 80.
The semi-major axis of the ellipsoid used is 6378137.
The flattening of the ellipsoid used is 1/298.2572222.
FIDGRIDCODEAlias: GRIDCODEData type: NumberWidth: 10
MEGA_IDAlias: MEGA_IDData type: StringWidth: 10
BOTTOM_IDAlias: BOTTOM_IDData type: StringWidth: 10
MSO_MCR_IDAlias: MSO_MCR_IDData type: StringWidth: 10
MDFIR_IDAlias: MDFIR_IDData type: StringWidth: 10
GEO_UNITAlias: GEO_UNITData type: StringWidth: 10
AreaAlias: AreaData type: StringWidth: 200
HAB_TYPEAlias: HAB_TYPEData type: StringWidth: 50
Benthic habitat classification attributes: megahabitat,bottom induration, meso-macrohabitat, and modifiers from Green and others,1999.CODE is a combination of the habitat attributes.MEGA_ID is S for ìShelf.îBOTTOM_ID is h for hard bottom, m for mixed hard and soft bottom, ors for soft sediment bottomMSO_MRC_ID are macrohabitats described in Greene and others 1999.MDFR_ID are modifiers to describe the texture or lithology of the seafloorand appear in the code preceded by an underscore (_).
The authors would like to thank the staff of the GFNMS, Jan Roletto, MBNMS, Jean de Marignac, and CBNMS, Dan Howard and Dale Roberts, for their support of this project. Fred Payne and Gerry Hatcher and the staff at the USGS Western Region Marine Facility expertly assisted with the mobilization, logistics and data acquisition. We would also like to thank the crew of the NOAA R/V MacArthur II.
(650) 329-5212 (voice)
(650) 329-5190 (FAX)
ranima@usgs.gov
These data are intended for science researchers, students, policymakers, and the general public. The data can beused with geographic information systems (GIS) softwareto display geologic and oceanographic information.
image mosaic sanp1m.img-------generation of entropy and homogeniety values----texscal
Program: TexScal vers. 2dUSGS Guy R. Cochrane gcochrane@usgs.gov02/01/2005 10:10:27W = 11, D = 1 wd=12 wd2=6Input matrix filename nufanf.imgLINES: 15389 SAMPLES: 18633Valid pixels processed: 129262505.000000bmin = 0 bmax = 254emin = 2.168136 emax = 4.731017 hmin = 0.011029 hmax = 1.334025entropy correction = 99.107233 homogeneity correction = 191.988461
texgen
Program TexGen vers. 2dUSGS Guy R. Cochrane gcochrane@usgs.govInput Matrix filename: nufanf.imgEntropy minimum value: 2.168136Homogeneity minimum value: 0.011029Entropy correction value: 99.107233Homogeneity correction value: 191.988461Output Entropy filename: nufanfent.imgOutput Homogeneity filename: nufanfhom.imgLINES: 15389 SAMPLES: 18633W = 11 D = 1Valid pixels processed: 129262505.000000
---------classification of rock (hard) areas-------------texsig created signature files used by texclass to generate output image files:
signature file: rock1.sigstarting line: 7253starting sample: 6228ending line: 7272ending sample: 6247texclassrange limit: 2percentage of habitat defined: 14.9, assigned DN = 255output image file: nufanfrock1.img
signature file: rock2.sigstarting line: 5675starting sample: 2045ending line: 5684ending sample: 2054texclassrange limit: 2percentage of habitat defined: 2.0, assigned DN = 255output image file: nufanfrock2.img
signature file: nrock1.sigstarting line: 6860starting sample: 6442ending line: 6879ending sample: 6461texclassrange limit: 2percentage of habitat defined: 1.9, assigned DN = 255output image file: nufanfnrock1.img
signature file: nrock2.sigstarting line: 6317starting sample: 4931ending line: 6326ending sample: 4940texclassrange limit: 2percentage of habitat defined: 0.4, assigned DN = 255output image file: nufanfnrock2.img
signature file: rock3.sigstarting line: 6437starting sample: 2386ending line: 6446ending sample: 2395texclassrange limit: 2percentage of habitat defined: 5.3, assigned DN = 255output image file: nufanfrock3.img
signature file: rock4.sigstarting line: 6349starting sample: 2385ending line: 6358ending sample: 2394texclassrange limit: 2percentage of habitat defined: 8.9, assigned DN = 255output image file: nufanfrock4.img
signature file: rock5.sigstarting line: 5936starting sample: 2262ending line: 5945ending sample: 2271texclassrange limit: 2percentage of habitat defined: 3.2, assigned DN = 255output image file: nufanfrock5.img
signature file: rock6.sigstarting line: 7861starting sample: 8840ending line: 7890ending sample: 8869texclassrange limit: 2percentage of habitat defined: 6.3, assigned DN = 255output image file: nufanfrock5.img
signature file: rock7.sigstarting line: 7801starting sample: 8860ending line: 7830ending sample: 8869texclassrange limit: 2percentage of habitat defined: 2.7, assigned DN = 255output image file: nufanfrock5.img
Combinednufanfrock1.imgnufanfrock2.imgnufanfrock3.imgnufanfrock4.imgnufanfrock5.imgnufanfrock6.imgnufanfrock7.imgnufanfnrock1.imgnufanfnrock2.img
converted to .tiff and sent to Nadine Golden for further processing
-----------classification of mixed areas-------------------texsig created signature files used by texclass to generate output image files:
signature file: sdwv2.sigstarting line: 5942starting sample: 12803ending line: 5961ending sample: 12822texclassrange limit: 2percentage of habitat defined: 8.4, assigned DN = 255output image file: nufanfsdwv2.img
signature file: sdwv4.sigstarting line: 4546starting sample: 9059ending line: 4565ending sample: 9078texclassrange limit: 2percentage of habitat defined: 9.5, assigned DN = 255output image file: nufanfsdwv4.img
Combinednufanfsdwv2.imgnufanfsdwv4.img
converted to .tiff and sent to Nadine Golden for further processing
-----------classification of soft areas-------------------texsig created signature files used by texclass to generate output image files:
signature file: mud1.sigstarting line: 3461starting sample: 4463ending line: 3470ending sample: 4472texclassrange limit: 2percentage of habitat defined: 7.7, assigned DN = 255output image file: nufanfmud1.img
signature file: mud2.sigstarting line: 10284starting sample: 17410ending line: 10293ending sample: 17419texclassrange limit: 2
signature file: mud3.sigstarting line: 2884starting sample: 4080ending line: 2889ending sample: 4084texclassrange limit: 2percentage of habitat defined: 1.3, assigned DN = 255output image file: nufanfmud3.img
signature file: mud4.sigstarting line: 3024starting sample: 4295ending line: 3033ending sample: 4304texclassrange limit: 2percentage of habitat defined: 3.4, assigned DN = 255output image file: nufanfmud4.img
signature file: mud5.sigstarting line: 3024starting sample: 4295ending line: 3043ending sample: 4314texclassrange limit: 2percentage of habitat defined: 8.6, assigned DN = 255output image file: nufanfmud5.img
signature file: mud6.sigstarting line: 2934starting sample: 4532ending line: 2943ending sample: 4541texclassrange limit: 2percentage of habitat defined: 5.9, assigned DN = 255output image file: nufanfmud6.img
signature file: mud7.sigstarting line: 3019starting sample: 4438ending line: 3028ending sample: 4447texclassrange limit: 2percentage of habitat defined: 5.5, assigned DN = 255output image file: nufanfmud7.img
signature file: mud9.sigstarting line: 7466starting sample: 10206ending line: 7485ending sample: 10225texclassrange limit: 2percentage of habitat defined: 2.6, assigned DN = 255output image file: nufanfmud9.img
signature file: mud10.sigstarting line: 7393starting sample: 10151ending line: 7402ending sample: 10160texclassrange limit: 2percentage of habitat defined: 7.5, assigned DN = 255output image file: nufanfmud10.img
signature file: mud11.sigstarting line: 7064starting sample: 10425ending line: 7073ending sample: 10434texclassrange limit: 2percentage of habitat defined: 1.3, assigned DN = 255output image file: nufanfmud11.img
signature file: mud12.sigstarting line: 7064starting sample: 10425ending line: 7083ending sample: 10444texclassrange limit: 2percentage of habitat defined: 5.4, assigned DN = 255output image file: nufanfmud12.img
Combinednufanfmud1.imgnufanfmud2.imgnufanfmud3.imgnufanfmud4.imgnufanfmud5.imgnufanfmud6.imgnufanfmud7.imgnufanfmud9.imgnufanfmud10.imgnufanfmud11.imgnufanfmud12.img
converted to .tiff and sent to Nadine Golden for further processing
//Created grids and polygons from image files from Jamie Conrad.1. Converted all images to grids in ArcInfo using imagegrid command
2. Converted grids to polygons for editing using ArcToolBox-->Conversion Tools-->From Raster-->Raster to Polygon(*Note: unchecked "simplify polygons")
3. Created a back layer for all other data.In this data set the all data layer was set to 170 gridcode to represent mixed areas.
4. Imported Granite layer from manual drawing of granite boundaries by Jamie Conrad done in Adobe Illustrator.
5. Edited, cleaned, polygons for individual layers:cleaned nadar dataconverted gridcode to correct grid code if signature was incorrect
6. Converted all edited polygons back to grids using ArcToolBox-->Conversion Tools-->t0 Raster-->Polygon to Raster
-------------------------------------------------------------------------------------------//Merged final grids to make one grid of all layers
1. Merged all grids in Spatial Analyst tool Raster Calculator-set option to Extent-->union of inputs.-used the merge command in raster calculator dialogue box
-------------------------------------------------------------------------------------------//Filtered grid to decrease number of polygons
steps:1. Filtered original grid using ArcToolBox-->Spatial Analyst Tools-->Generalization-->Majority FilterSettings:Number of Neighbors to Use: "4"Replacement Threshold: "Majority"
2. Filter process wiped out some of the smaller areas of sediment in the bedrock (non-granite) region.Went back to final grid before filter and copied the sediment areas within the bedrock. Copied these small mixed sediment regions to final polygon.
United States Geological Survey, Coastal and Marine Geology (CMG), 2005, Benthic Habitat and Geologic Mapping of the outer Continental Shelf of North-Central California.This is part of the following larger work.Online Links:
United States Geological Survey, Coastal and Marine Geology (CMG), 2005, USGS CMG InfoBank.Online Links:
Habitat polygons dervived in ArcGIS 9.1 from a georefereced sidescan sonar mosaictiff.
complete
No additional checks for topological consistency were performed on this data.
Are there legal restrictions on access or use of the data?
- Access_Constraints: None
- Use_Constraints: Not suitable for navigation
(650) 329-5212 (voice)
(650) 329-5190 (FAX)
ranima@usgs.go
Please recognize the U.S. Geological Survey (USGS) as the source ofthis information.Although these data have been used by the U.S. Geological Survey,U.S. Department of the Interior, no warranty expressed or impliedis made by the U.S. Geological Survey as to the accuracy of thedata.
The act of distribution shall not constitute any such warranty,and no responsibility is assumed by the U.S. Geological Survey inthe use of this data, software, or related materials.
(650) 329-5212 (voice)
(650) 329-5190 (FAX)
ranima@usgs.gov