U.S. Geological Survey Open-File Report 2008-1288
Geophysical Data Collected off the South Shore of Martha's Vineyard, Massachusetts
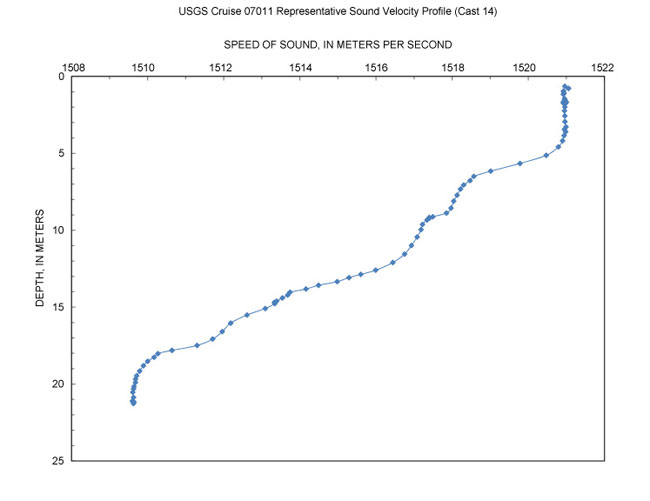 |
Figure 5. Representative sound velocity profile (SVP) displaying the speed of sound in the water column, in meters per second, versus water depth, in meters. These data were collected at SVP location 14 during USGS Cruise 07011. The data reveal the characteristic negative gradient, with presumably warmer surface waters overlying relatively cooler sub-surface waters.
|

![]() U.S. Department of the Interior |
U.S. Geological Survey
U.S. Department of the Interior |
U.S. Geological Survey
URL: https://pubsdata.usgs.gov/pubs/of/2008/1288/html/imagepages/figure5.html
Page Contact Information: Contact USGS
Page Last Modified: Wednesday, 07-Dec-2016 21:27:21 EST
