 |
|
| |||
| Open-File Report 2008–1322 |
By Scott E. Morlock, Chad D. Menke, Donald V. Arvin, and Moon H. Kim
This report is available below as PDF documents for viewing and printing.
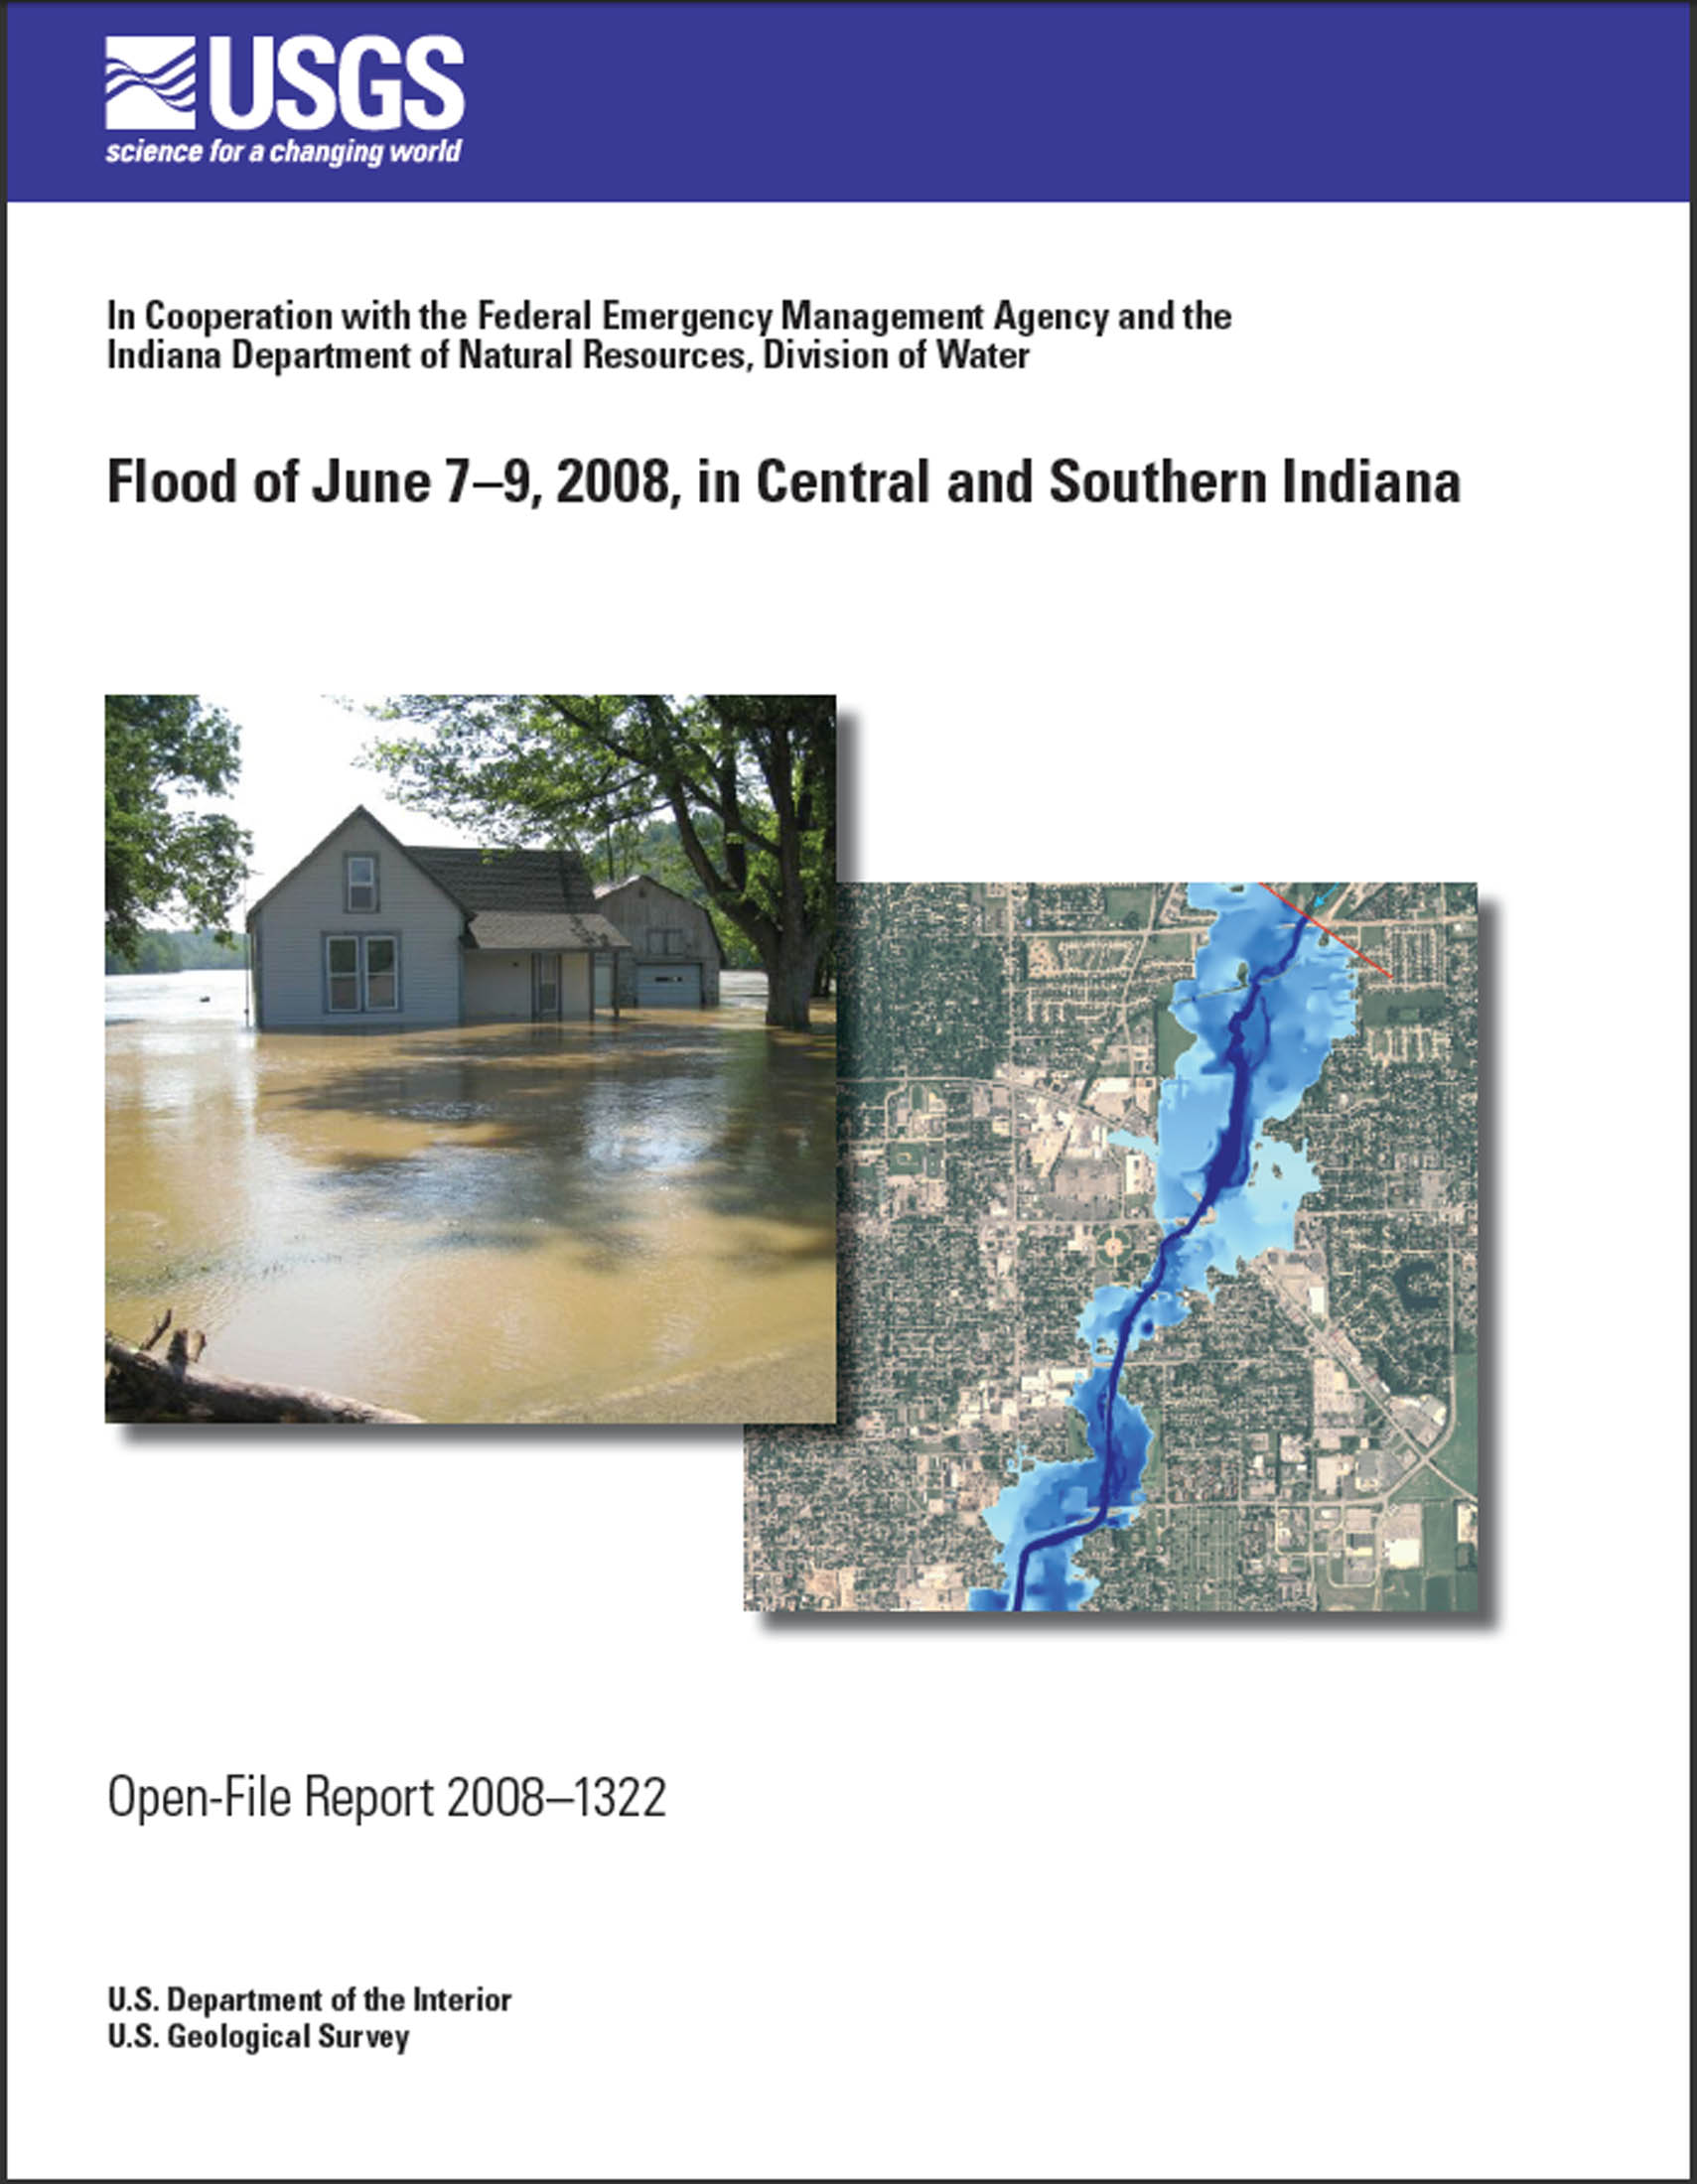
On June 6–7, 2008, heavy rainfall of 2 to more than 10 inches fell upon saturated soils and added to already high streamflows from a wetter than normal spring in central and southern Indiana. The heavy rainfall resulted in severe flooding on many streams within the White River Basin during June 7–9, causing three deaths, evacuation of thousands of residents, and hundreds of millions of dollars of damage to residences, businesses, infrastructure, and agricultural lands. In all, 39 Indiana counties were declared Federal disaster areas.
U.S. Geological Survey (USGS) streamgages at nine locations recorded new record peak streamflows for the respective periods of record as a result of the heavy rainfall. Recurrence intervals of flood-peak streamflows were estimated to be greater than 100 years at five streamgages and 50–100 years at two streamgages. Peak-gage-height data, peak-streamflow data, and recurrence intervals are tabulated for 19 USGS streamgages in central and southern Indiana. Peak-streamflow estimates are tabulated for four ungaged locations, and estimated recurrence intervals are tabulated for three ungaged locations. The estimated recurrence interval for an ungaged location on Haw Creek in Columbus was greater than 100 years and for an ungaged location on Hurricane Creek in Franklin was 50–100 years. Because flooding was particularly severe in the communities of Columbus, Edinburgh, Franklin, Paragon, Seymour, Spencer, Martinsville, Newberry, and Worthington, high-water-mark data collected after the flood were tabulated for those communities. Flood peak inundation maps and water-surface profiles for selected streams were made in a geographic information system by combining the high-water-mark data with the highest-resolution digital elevation model data available.
Abstract
Introduction
Purpose and Scope
Conditions Leading to the Flood
Collection of High-Water-Mark Data
Methods of Estimating the Magnitudes and Recurrence Intervals of Peak Streamflows
Estimation of Magnitudes
Estimation of Recurrence Intervals
Estimated Magnitudes and Recurrence Intervals of Peak Streamflows for the Flood of June 7–9, 2008
Flood-Peak Inundation Maps
Flood-Peak Profiles
Description of Flood Damages and Impacts
Summary
Acknowledgments
References Cited
Glossary
Appendix 1. Site Descriptions and High-Water Marks at Study Sites, Flood of June 7–9, 2008, Indiana [separate document]
Appendix 2. Flood-Peak Inundation Maps for Selected Study Streams and Communities, Flood of June 7–9, 2008, Indiana [separate document]
Appendix 3. Flood-Peak Elevation Profiles for Selected Sites, Flood of June 7–9, 2008, Indiana [separate document]
| 1. | Map showing study area in central and southern Indiana |
| 2. | Map showing estimated rainfall grid and rainfall totals for the National Weather Service stations (by station name) listed in table 1 |
| 3. | Graph showing cumulative hourly rainfall during June 6–7, 2008, recorded at the National Weather Service precipitation station at Spencer, Owen County, Indiana |
| 4. | Map showing locations of selected U.S. Geological Survey stream-gaging stations and ungaged sites |
| 1. | Total rainfall estimates for June 6–7, 2008, and average-recurrence-interval rainfalls for a 24-hour duration at selected National Weather Services precipitation stations |
| 2. | Flood-peak gage heights, peak discharges, and estimated recurrence intervals during the flood of June 6–7, 2008, at selected U.S. Geological Survey streamgages in Indiana |
| 3. | Estimated peak discharges and estimated recurrence intervals during the flood of June 6–7, 2008, at selected ungaged locations in Indiana |
This document is available in Portable Document Format (PDF)
To view and print report you will need to use Adobe Acrobat Reader (available as freeware)
Users with visual disabilities can visit Online conversion tools for Adobe PDF documents web page
Main text of report (2.8 MB) - iv, 15 pages, with front and back covers (8.5" by 11" paper)
Appendix 1, accessible version (65 kB)
Appendix 1, printable version (25 kB) - 5 pages (8.5" by 11" paper)
Appendix 2. (3.3 MB) - 18 pages (8.5" by 11" paper)
Appendix 3. (1.4 MB) - 15 pages (8.5" by 11" paper)
Accessible versions of tables 2 and 3:
table 2 (29 kB)
table 3 (17 kB)
Links to the GIS raster data layers used in the Appendix 2 of the report are listed below. Each zip file contains flood-peak water surface elevation data and water depth data and its related metadata. These raster data layers are in ERDAS IMAGINE format with an img file extension. These layers can be exported to different types of raster data using appropriate GIS software package.
| Downloadable Data | Size zipped | Size unzipped |
| Blue River at Edinburgh, Indiana | 0.6 MB | 8.2 MB |
| Canary Ditch at Franklin, Indiana | 3.0 MB | 30.0 MB |
| Clifty Creek at Columbus, Indiana | 3.5 MB | 16.0 MB |
| East Fork White River at Columbus, Indiana | 1.5 MB | 9.6 MB |
| East Fork White River at Seymour, Indiana | 30.4 MB | 189.0 MB |
| East Side Swale at Edinburgh, Indiana | 0.7 MB | 4.0 MB |
| Eel River at Worthington, Indiana | 0.6 MB | 6.6 MB |
| Flatrock River at Columbus, Indiana | 9.1 MB | 34.0 MB |
| Haw Creek at Columbus, Indiana | 5.7 MB | 44.0 MB |
| Hurricane Creek at Franklin, Indiana | 2.8 MB | 34.0 MB |
| unnamed tributary of Fall Creek at Paragon, Indiana | 1.7 MB | 14.0 MB |
| unnamed tributary of Youngs Creek at Franklin, Indiana | 0.4 MB | 12.0 MB |
| White River at Martinsville, Indiana | 1.6 MB | 16.0 MB |
| White River at Newberry, Indiana | 0.8 MB | 24.0 MB |
| White River at Spencer, Indiana | 2.9 MB | 21.0 MB |
| White River at Worthington, Indiana | 0.4 MB | 5.2 MB |
| Youngs Creek at Franklin, Indiana | 5.4 MB | 49.0 MB |
Suggested Citation:
Morlock, S.E., Menke, C.D., Arvin, D.V., and Kim, M.H., 2008, Flood of June 7–9, 2008, in central and southern Indiana: U.S. Geological Survey Open File Report 2008–1322, 15 p., 3 app.
For more information about water-resources activities of the USGS in Indiana, visit the USGS Indiana Water Science Center home page at http://in.water.usgs.gov/.
| AccessibilityFOIAPrivacyPolicies and Notices | |
 |
|