Skip Links

USGS - science for a changing world

Open-File Report 2008–1365

Monitoring Inland Storm Surge and Flooding from Hurricane Ike in Texas and Louisiana, September 2008

By Jeffery W. East, Michael J. Turco, and Robert R. Mason, Jr.

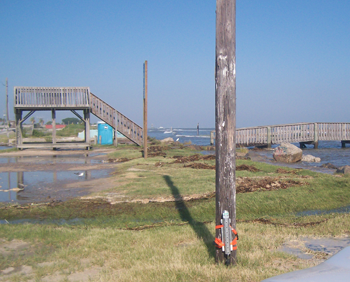
The U.S. Geological Survey (USGS) deployed a temporary monitoring network of 117 pressure transducers (sensors) at 65 sites over an area of about 5,000 square miles to record the timing, areal extent, and magnitude of inland hurricane storm surge and coastal flooding generated by Hurricane Ike, which struck southeastern Texas and southwestern Louisiana September 12–13, 2008. Fifty-six sites were in Texas and nine were in Louisiana. Sites were categorized as surge, riverine, or beach/wave on the basis of proximity to the Gulf Coast. One-hundred five sensors from 59 sites (fig. 1) were recovered; 12 sensors from six sites either were lost during the storm or were not retrieved. All 59 sites (41 surge, 10 riverine, 8 beach/wave) had sensors to record water pressure (fig. 2), which is expressed as water level in feet above North American Vertical Datum of 1988 (NAVD88), and 46 sites had an additional sensor to record barometric pressure, expressed in pounds per square inch. Figure 3 shows an example of water level and barometric pressure over time recorded by sensors during the storm.

Map showing sensor site locations. SSS-LA-CAM-012 SSS-LA-CAM-010 SSS-LA-VER-006 SSS-LA-VER-007 SSS-LA-CAM-011 SSS-LA-CAM-001 SSS-TX-JEF-008 SSS-TX-JEF-007 SSS-LA-CAM-002 SSS-LA-CAM-003 SSS-TX-JEF-006 SSS-TX-HAR-004 SSS-TX-CHA-004 SSS-TX-CHA-003 SSS-TX-JEF-004 SSS-TX-JEF-009 SSS-TX-JEF-001 SSS-TX-JEF-002 SSS-TX-HAR-002 SSS-TX-JEF-005 SSS-TX-GAL-005 SSS-TX-GAL-022 SSS-TX-GAL-019 SSS-TX-GAL-020 SSS-TX-GAL-002 SSS-TX-GAL-001 SSS-TX-HAR-003 SSS-TX-GAL-021 SSS-TX-BRA-007 SSS-TX-BRA-011 SSS-TX-BRA-001 SSS-TX-BRA-010 SSS-TX-BRA-002 SSS-TX-BRA-008 SSS-TX-GAL-018 SSS-TX-GAL-015 SSS-TX-GAL-011 SSS-TX-MAT-009 SSS-TX-GAL-016 SSS-TX-GAL-010 SSS-TX-GAL-008 SSS-TX-BRA-005 SSS-TX-BRA-009 SSS-TX-MAT-004 SSS-TX-MAT-010 SSS-TX-MAT-008 SSS-TX-MAT-003 SSS-TX-BRA-004 SSS-TX-CAL-003 SSS-TX-BRA-006 SSS-TX-MAT-006 SSS-TX-CAL-002 SSS-TX-MAT-005 SSS-TX-CAL-001 SSS-TX-MAT-002 SSS-TX-CAL-004 SSS-TX-MAT-001 SSS-TX-CAL-005 SSS-TX-MAT-007

Figure 1. Sensor sites from which storm-surge data were obtained during Hurricane Ike.

Photograph   Figure
Figure 2. Pressure transducer (sensor) attached to power pole to record storm surge.   Figure 3. Example of water level and barometric pressure recorded during Hurricane Ike. (Click graph to enlarge.)

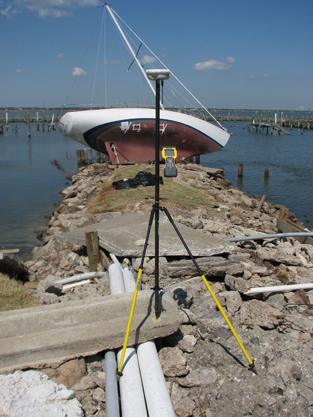
Data were collected and processed following protocols established by McGee and others (2005), which included correcting water pressure for changes in barometric pressure and salinity. Quality-control checks were made by colocating water-level sensors at a subset of sites and comparing data from those sensors to water levels computed from recorded pressure data at those sites; and by comparing water levels computed from recorded pressure data to water levels recorded at nearby USGS gaging stations and to independent high-water marks where possible. Elevation surveys using global positioning systems (fig. 4) and differential levels were done to relate all water-level data, reference marks, benchmarks, and sensor measuring points to NAVD88.

Photograph   The data from the Hurricane Ike storm-surge network constitute an extensive collection of continuous water-level records documenting a single land-falling hurricane. The data can be used to evaluate the performance of storm-surge models for maximum and incremental water level and flood extent and site-specific effects of storm surge on natural and anthropogenic elements of the environment. The data are available below on a provisional basis in tab-delimited, ASCII format by site for each sensor (table 1).  Data for each site comprise date, time, water level, corresponding water pressure, barometric pressure, temperature from water-pressure sensor, temperature from barometric-pressure sensor, and indicators of missing data. The data-processing date is in the file header. The data also are available in a single folder by clicking here.

Reference

McGee, B.D., Goree, B.B., Tollett, R.W., Woodward, B.K., and Kress, W.H., 2005, Hurricane Rita surge data, southwestern Louisiana and southeastern Texas, September to November 2005: U.S. Geological Survey Data Series 220, available at https://pubs.usgs.gov/ds/2006/220/.

Figure 4. Global positioning system surveying of storm-surge site after Hurricane Ike.  

Table 1. Hurricane Ike storm-surge data for 59 sites in Texas and Louisiana, September 2008.

Site name

County or parish

Latitude,
decimal degrees

Longitude,
decimal degrees

Site type

Graph

SSS-TX-BRA-001

Brazoria

29.21194

-95.20833

surge

Graph (442 KB .pdf)

SSS-TX-BRA-002

Brazoria

29.08472

-95.28806

surge

Graph (352 KB .pdf)

SSS-TX-BRA-004

Brazoria

28.86833

-95.44861

surge

Graph (358 KB .pdf)

SSS-TX-BRA-005

Brazoria

28.94944

-95.55556

riverine

Graph (345 KB .pdf)

SSS-TX-BRA-006

Brazoria

28.86667

-95.58722

surge

Graph (324 KB .pdf)

SSS-TX-BRA-007

Brazoria

29.28667

-95.13139

riverine

Graph (351 KB .pdf)

SSS-TX-BRA-008

Brazoria

29.03556

-95.39889

surge

Graph (352 KB .pdf)

SSS-TX-BRA-009

Brazoria

29.01306

-95.32972

surge

Graph (353 KB .pdf)

SSS-TX-BRA-010

Brazoria

29.33639

-95.28417

riverine

Graph (355 KB .pdf)

SSS-TX-BRA-011

Brazoria

29.29667

-95.35667

riverine

Graph (346 KB .pdf)

SSS-TX-CAL-001

Calhoun

28.40639

-96.71167

surge

Graph (318 KB .pdf)

SSS-TX-CAL-002

Calhoun

28.44444

-96.40250

surge

Graph (316 KB .pdf)

SSS-TX-CAL-003

Calhoun

28.61917

-96.61972

surge

Graph (329 KB.pdf)

SSS-TX-CAL-004

Calhoun

28.66056

-96.41167

surge

Graph (314 KB .pdf)

SSS-TX-CAL-005

Calhoun

28.64139

-96.32333

surge

Graph (316 KB .pdf)

SSS-TX-CHA-003

Chambers

29.60417

-94.67528

surge

Graph (310 KB .pdf)

SSS-TX-CHA-004

Chambers

29.77278

-94.68694

surge

Graph (305 KB .pdf)

SSS-TX-GAL-001

Galveston

29.45139

-94.63417

beach/wave

Graph (306 KB .pdf)

SSS-TX-GAL-002

Galveston

29.46583

-94.64806

surge

Graph (320 KB .pdf)

SSS-TX-GAL-005

Galveston

29.59444

-94.39028

surge

Graph (319 KB .pdf)

SSS-TX-GAL-008

Galveston

29.33444

-94.75111

beach/wave

Graph (345 KB .pdf)

SSS-TX-GAL-010

Galveston

29.23806

-94.87778

beach/wave

Graph (310 KB .pdf)

SSS-TX-GAL-011

Galveston

29.22083

-94.94472

surge

Graph (344 KB .pdf)

SSS-TX-GAL-015

Galveston

29.08611

-95.11722

beach/wave

Graph (404 KB .pdf)

SSS-TX-GAL-016

Galveston

29.30389

-94.90528

surge

Graph (350 KB .pdf)

SSS-TX-GAL-018

Galveston

29.35583

-95.04000

surge

Graph (350 KB .pdf)

SSS-TX-GAL-019

Galveston

29.50639

-94.95778

surge

Graph (350 KB .pdf)

SSS-TX-GAL-020

Galveston

29.45667

-95.04778

riverine

Graph (346 KB .pdf)

SSS-TX-GAL-021

Galveston

29.51333

-95.10389

riverine

Graph (350 KB .pdf)

SSS-TX-GAL-022

Galveston

29.55167

-95.02472

surge

Graph (341 KB .pdf)

SSS-TX-HAR-002

Harris

29.62028

-94.99889

surge

Graph (333 KB .pdf)

SSS-TX-HAR-003

Harris

29.59194

-95.12833

surge

Graph (345 KB .pdf)

SSS-TX-HAR-004

Harris

29.71306

-94.99333

surge

Graph (349 KB .pdf)

SSS-TX-JEF-001

Jefferson

29.68444

-94.19278

surge

Graph (336 KB .pdf)

SSS-TX-JEF-002

Jefferson

29.67500

-94.04361

beach/wave

Graph (330 KB.pdf)

SSS-TX-JEF-004

Jefferson

29.71028

-94.11639

surge

Graph (331 KB .pdf)

SSS-TX-JEF-005

Jefferson

29.69694

-94.09833

surge

Graph (332 KB .pdf)

SSS-TX-JEF-006

Jefferson

29.71111

-93.86000

surge

Graph (359 KB .pdf)

SSS-TX-JEF-007

Jefferson

29.77389

-93.94250

surge

Graph (351 KB .pdf)

SSS-TX-JEF-008

Jefferson

29.76472

-93.89778

surge

Graph (369 KB .pdf)

SSS-TX-JEF-009

Jefferson

29.66265

-94.08835

beach/wave

Graph (341 KB .pdf)

SSS-TX-MAT-001

Matagorda

28.72056

-96.27389

surge

Graph (359 KB .pdf)

SSS-TX-MAT-002

Matagorda

28.78639

-96.15028

surge

Graph (361 KB .pdf)

SSS-TX-MAT-003

Matagorda

28.78750

-95.99583

riverine

Graph (364 KB .pdf)

SSS-TX-MAT-004

Matagorda

28.83889

-95.85278

riverine

Graph (313 KB .pdf)

SSS-TX-MAT-005

Matagorda

28.60056

-95.97806

beach/wave

Graph (379 KB .pdf)

SSS-TX-MAT-006

Matagorda

28.68306

-95.97556

riverine

Graph (365 KB .pdf)

SSS-TX-MAT-007

Matagorda

28.61139

-96.21528

surge

Graph (387 KB .pdf)

SSS-TX-MAT-008

Matagorda

28.76417

-95.62694

beach/wave

Graph (340 KB .pdf)

SSS-TX-MAT-009

Matagorda

28.77056

-95.61667

surge

Graph (363 KB .pdf)

SSS-TX-MAT-010

Matagorda

28.83639

-95.66833

riverine

Graph (346 KB .pdf)

SSS-LA-CAM-001

Cameron

29.75028

-93.66361

surge

Graph (509 KB .pdf)

SSS-LA-CAM-002

Cameron

29.76194

-93.58250

surge

Graph (328 KB .pdf)

SSS-LA-CAM-003

Cameron

29.80417

-93.34889

surge

Graph (338 KB .pdf)

SSS-LA-CAM-010

Cameron

29.78611

-93.11500

surge

Graph (302 KB .pdf)

SSS-LA-CAM-011

Cameron

29.87056

-93.07972

surge

Graph (312 KB.pdf)

SSS-LA-CAM-012

Cameron

29.77056

-93.01444

surge

Graph (315 KB .pdf)

SSS-LA-VER-006

Vermillion

29.64111

-92.42694

surge

Graph (310 KB .pdf)

SSS-LA-VER-007

Vermillion

29.60028

-92.34167

surge

Graph (309 KB .pdf)

Revised March 31, 2009

First posted December 12, 2008


For additional information contact:

Jeffery W. East,
U.S. Geological Survey
Texas Water Science Center,
19241 David Memorial Drive, Suite 180,
Shenandoah, Texas 77385

or

Director, Texas Water Science Center
U.S. Geological Survey
8027 Exchange Drive
Austin, Texas 78754-4733

http://tx.usgs.gov/

Part or all of this report is presented in Portable Document Format (PDF); the latest version of Adobe Reader or similar software is required to view it. Download the latest version of Adobe Reader, free of charge.


Suggested citation:

East, J.W., Turco, M.J., and Mason, R.R., Jr., 2008, Monitoring inland storm surge and flooding from Hurricane Ike in Texas and Louisiana, September 2008: U.S. Geological Survey Open-File Report 2008–1365 [https://pubs.usgs.gov/of/2008/1365/].


Accessibility FOIA Privacy Policies and Notices

Take Pride in America logo USA.gov logo U.S. Department of the Interior | U.S. Geological Survey
URL: http://pubsdata.usgs.gov/pubs/of/2008/1365/index.html
Page Contact Information: GS Pubs Web Contact
Page Last Modified: Wednesday, 07-Dec-2016 21:25:16 EST