U.S. Geological Survey Open-File Report 2009-1100, version 1.1
High-Resolution Seismic-Reflection and Marine Magnetic Data Along the Hosgri Fault Zone, Central CaliforniaFigures
|
|
|
For more information, contact the WCMG team.
|

![]() U.S. Department of the Interior |
U.S. Geological Survey
U.S. Department of the Interior |
U.S. Geological Survey
URL: https://pubs.usgs.gov/of/2009/1100/figures.html
Page Contact Information: Michael Diggles
Page Last Modified: 9 September 2010 (mfd)

 Figure 1
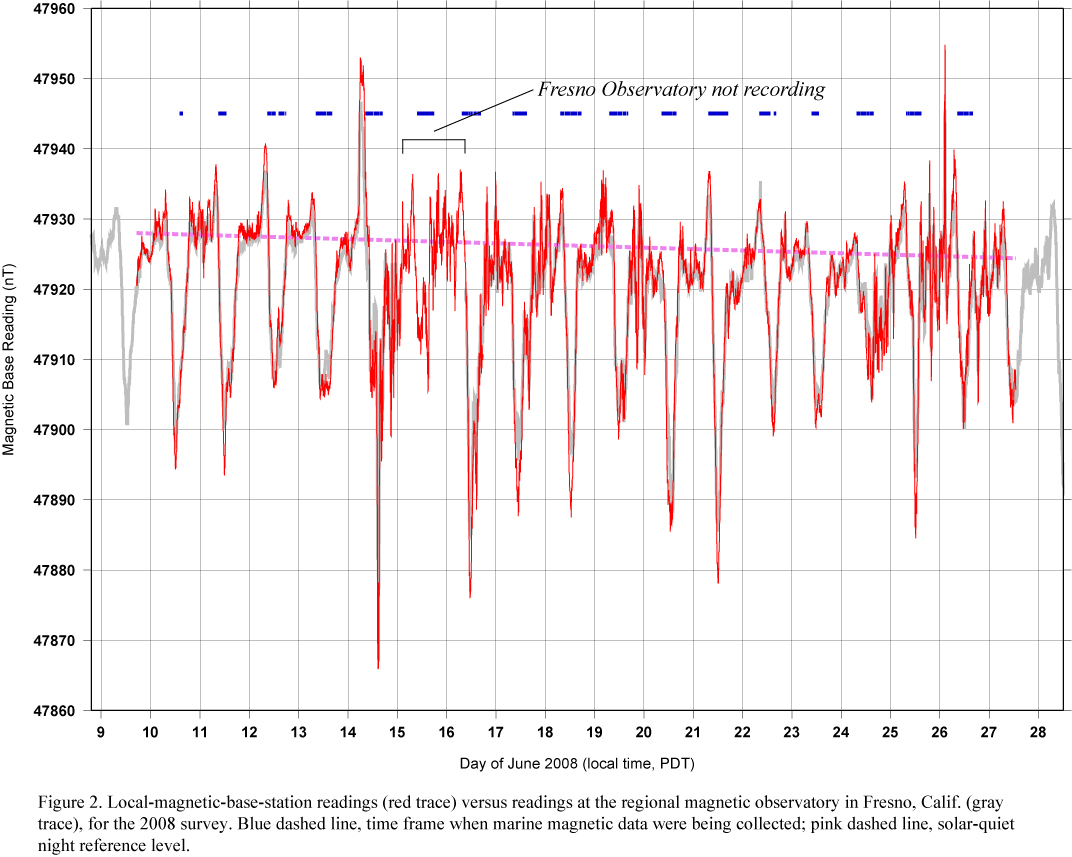 Figure 2
 Figure 3
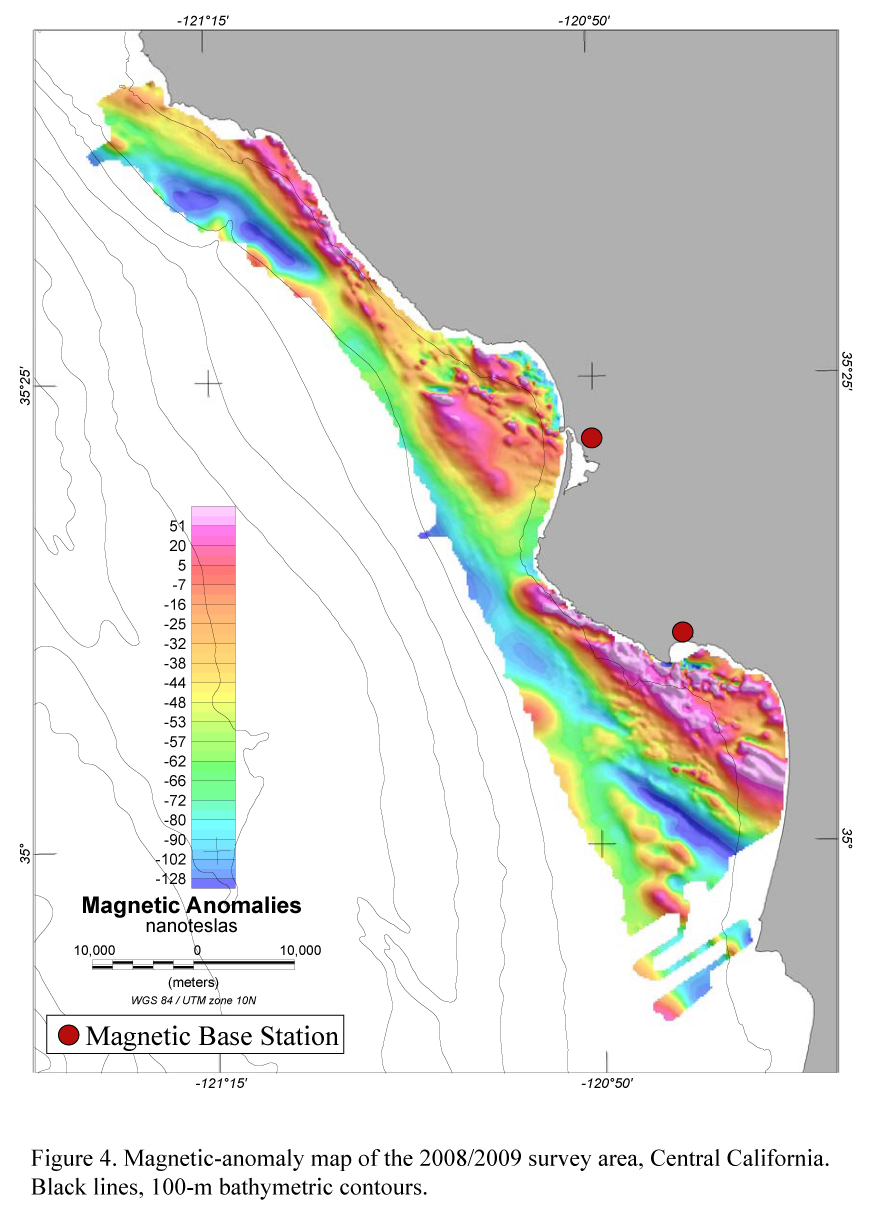 Figure 4
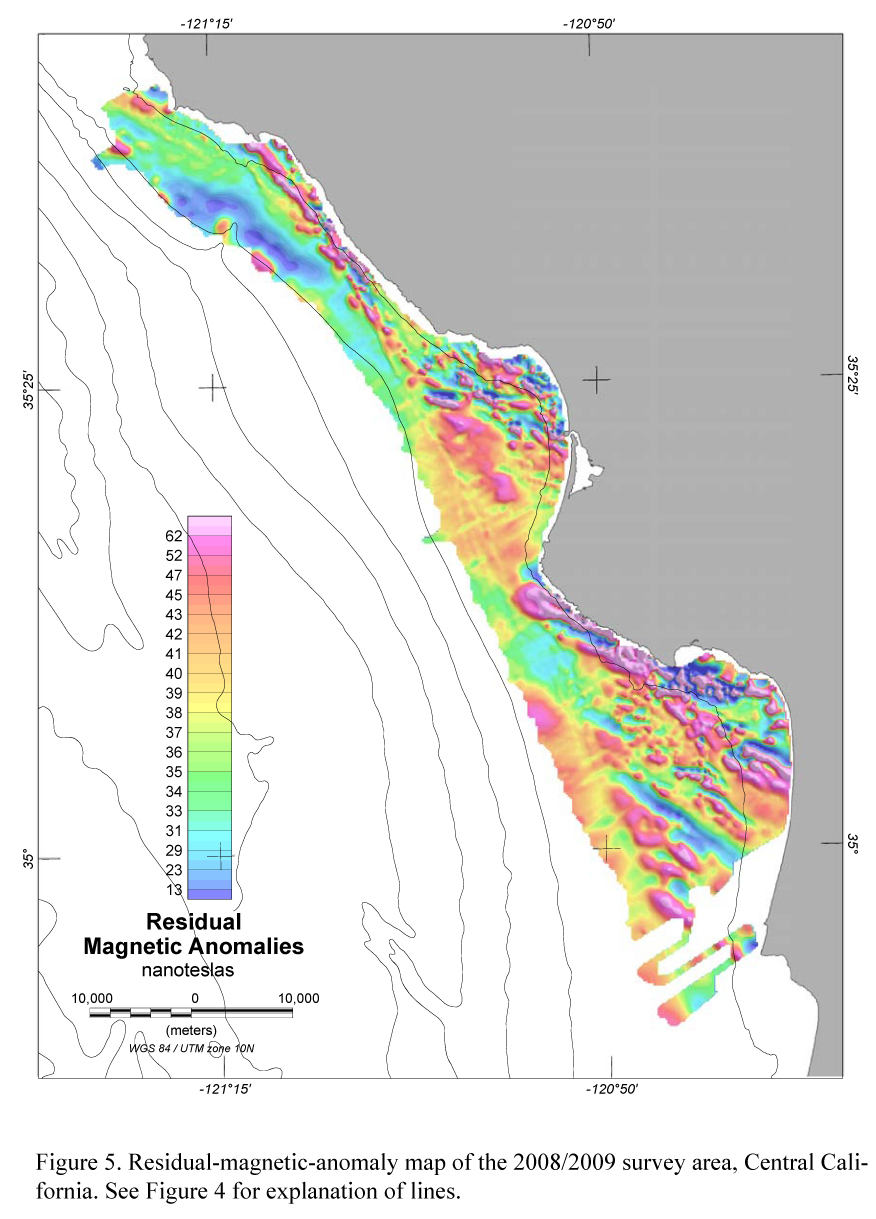 Figure 5