Skip past header information
USGS - science for a changing world

Open-File Report 2012-1258

High-Resolution Swath Interferometric Data Collected within Muskeget Channel, Massachusetts


List of Figures

Skip past contents information
Map showing the location of the Muskeget Channel, Massachusetts, survey area (outlined in red). Is., Island; Pt., Point; UTM, Universal Transverse Mercator.

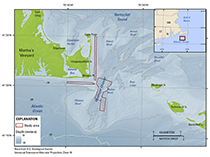
Figure 1. Map showing the location of the Muskeget Channel, Massachusetts, survey area (outlined in red). Is., Island; Pt., Point; UTM, Universal Transverse Mercator.

Photograph showing the configuration of acquisition equipment on the U.S. Geological Survey research vessel Rafael. The real-time kinematic global positioning system antennae and the swath interferometric-sonar head are located off the bow. Photograph by Dave Foster. 
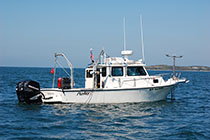
Figure 2. Photograph showing the configuration of acquisition equipment on the U.S. Geological Survey research vessel Rafael. The real-time kinematic global positioning system antennae and the swath interferometric-sonar head are located off the bow. Photograph by Dave Foster, U.S. Geological Survey.
Map showing tracklines along which bathymetric depth data were collected surrounding Muskeget Channel, Massachusetts. Two separate surveys were conducted so that morphologic changes could be assessed within an area of large bedforms and along potential cable routes. Data from A, Survey 1 were collected in October 2010 and B, Survey 2 were collected in November 2010. Is., Island; Pt., Point. 
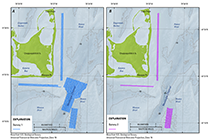
Figure 3. Map showing tracklines along which bathymetric depth data were collected surrounding Muskeget Channel, Massachusetts. Two separate surveys were conducted so that morphologic changes could be assessed within an area of large bedforms and along potential cable routes. Data from A, Survey 1 were collected in October 2010 and B, Survey 2 were collected in November 2010. Is., Island; Pt., Point.
Map showing shaded-relief bathymetry collected within the vicinity of Muskeget Channel, Massachusetts. Two separate surveys were conducted so that morphologic changes could be assessed within an area of large bedforms and along potential cable routes. Data from A, Survey 1 were collected in October 2010 and B, Survey 2 were collected in November 2010. Coloring represents depth in meters relative to mean lower low water. Is., Island; Pt., Point.

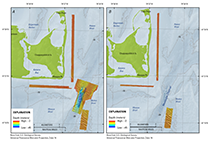
Figure 4. Map showing shaded-relief bathymetry collected within the vicinity of Muskeget Channel, Massachusetts. Two separate surveys were conducted so that morphologic changes could be assessed within an area of large bedforms and along potential cable routes. Data from A, Survey 1 were collected in October 2010 and B, Survey 2 were collected in November 2010. Coloring represents depth in meters relative to mean lower low water. Is., Island; Pt., Point.

Map showing shaded-relief bathymetry of Muskeget Channel, Massachusetts, in three dimensions. These data were collected during a survey conducted in October 2010. Vertical exaggeration is sixfold. 
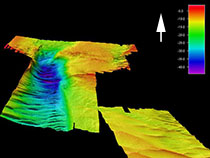
Figure 5. Map showing shaded-relief bathymetry of Muskeget Channel, Massachusetts, in three dimensions. These data were collected during a survey conducted in October 2010. Vertical exaggeration is sixfold.
Map showing shaded-relief bathymetry collected within the vicinity of Muskeget Channel, Massachusetts, during a survey conducted in October 2010. Inset map is showing the change in bathymetry for a select area between Survey 1 in October 2010 and Survey 2 in November 2010. Pink and red tones indicate erosion and blue tones indicate deposition. Gray areas (hillshaded) are within ±30 centimeters and below instrument accuracy. Bedform migration is between 10 and 15 meters within the inset area, and net sediment transport is to the south. Is., Island; Pt., Point. 
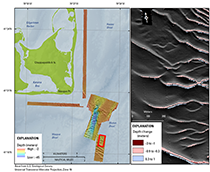
Figure 6. Map showing shaded-relief bathymetry collected within the vicinity of Muskeget Channel, Massachusetts, during a survey conducted in October 2010. Inset map is showing the change in bathymetry for a select area between Survey 1 in October 2010 and Survey 2 in November 2010. Pink and red tones indicate erosion and blue tones indicate deposition. Gray areas (hillshaded) are within ±30 centimeters and below instrument accuracy. Bedform migration is between 10 and 15 meters within the inset area, and net sediment transport is to the south. Is., Island; Pt., Point.

Map showing acoustic-backscatter intensity collected within the vicinity of Muskeget Channel, Massachusetts, during a survey conducted in October 2010. Backscatter intensity is an acoustic measure of the hardness and roughness of the sea floor. In general, high values (light tones) represent rock, boulders, cobbles, gravel, and coarse sand. Low values (dark tones) generally represent fine sand and muddy sediment. Is., Island; Pt., Point.

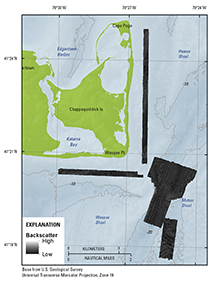
Figure 7. Map showing acoustic-backscatter intensity collected within the vicinity of Muskeget Channel, Massachusetts, during a survey conducted in October 2010. Backscatter intensity is an acoustic measure of the hardness and roughness of the sea floor. In general, high values (light tones) represent rock, boulders, cobbles, gravel, and coarse sand. Low values (dark tones) generally represent fine sand and muddy sediment. Is., Island; Pt., Point.


Accessibility FOIA Privacy Policies and Notices

Take Pride in America logo USA.gov logo U.S. Department of the Interior | U.S. Geological Survey
URL: http://pubsdata.usgs.gov/pubs/of/2012/1258/html/ofr2012-1258_listofigs.html
Page Contact Information: GS Pubs Web Contact
Page Last Modified: Monday, 02-Jun-2014 13:54:42 EDT