Open-File Report 2013–1225
Bathymetry and Acoustic Backscatter—Estero Bay, CaliforniaFigures
|
|
|
For more information, contact the PCMSC team.
|

![]() U.S. Department of the Interior |
U.S. Geological Survey
U.S. Department of the Interior |
U.S. Geological Survey
URL: http://pubsdata.usgs.gov/pubs/of/2013/1225/figures.html
Page Contact Information: GS Pubs Web Contact
Page Last Modified: Tuesday, 03-Dec-2013 16:57:35 EST

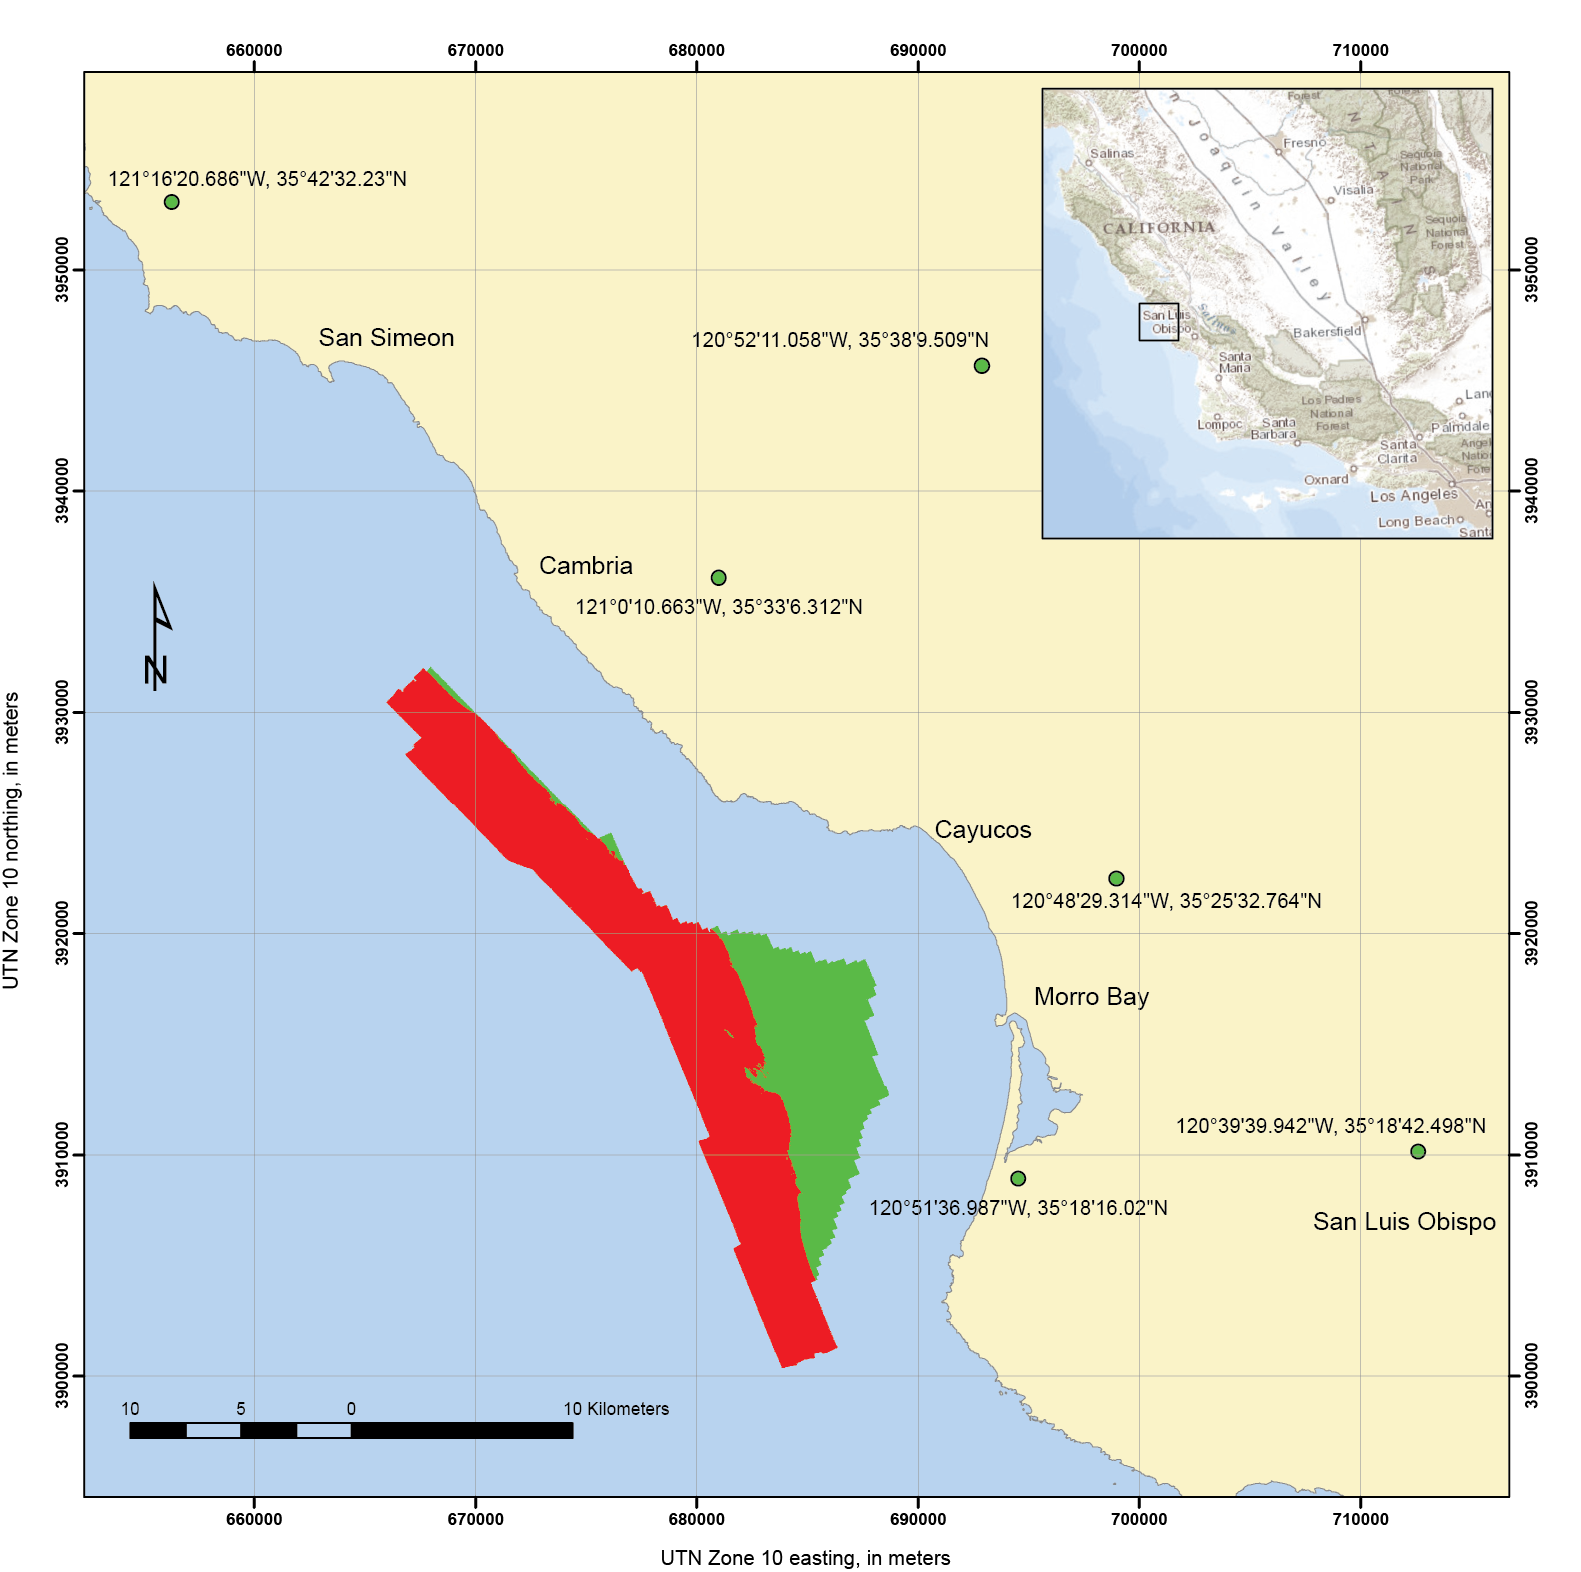 Figure 1
 Figure 2
 Figure 3
 Figure 4
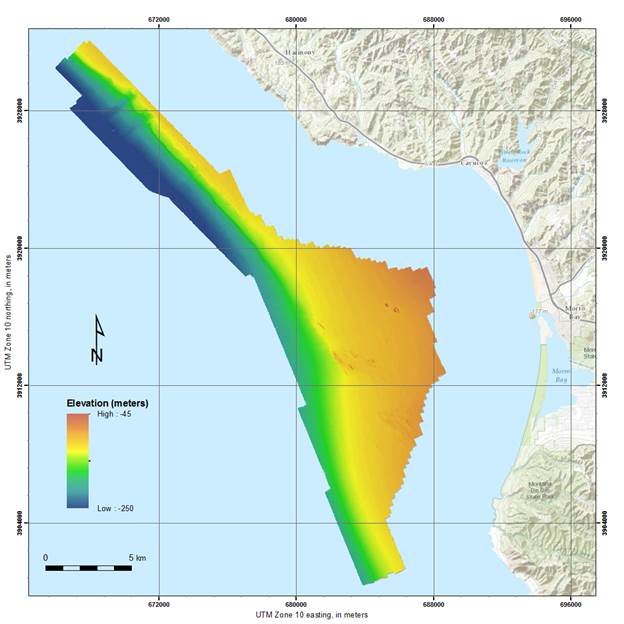 Figure 5
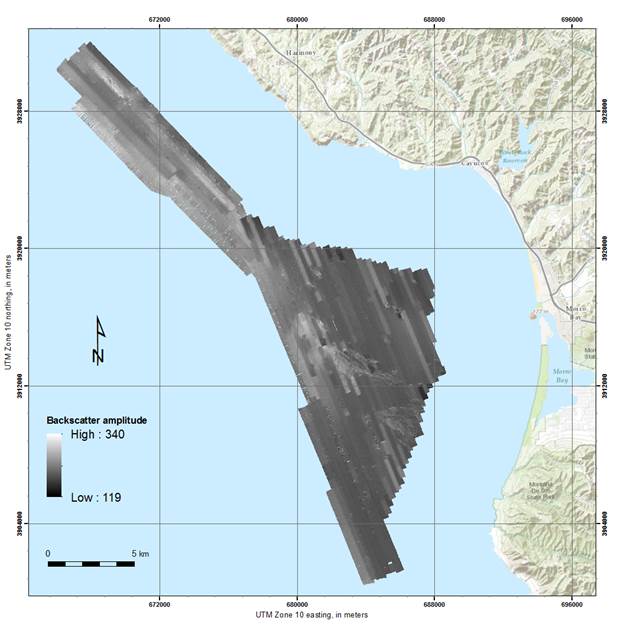 Figure 6
 Figure 7
 Figure 8
 Figure 9
 Figure 10