Open-File Report 20151055
 |
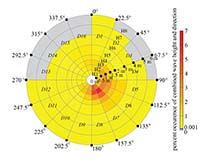
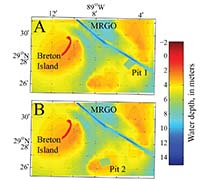
Wave conditions in the northern Gulf of Mexico around Breton Island were quantified using an approach developed by Long and others (2014). In this methodology, the wave climatology at any given location is characterized into a discrete set of scenarios, which are subsequently numerically modeled to provide the spatial variability over the domain of interest in wave conditions represented by that scenario. The methodology and its application here are described in more detail in the section “Wave Climatology,” and the numerical model used to construct the scenarios is described in “Numerical Model.” This approach was used to investigate the effects of two possible configurations of offshore sand extraction, described in “Borrow Pit Designs,” with the resultant effects on the wave climate quantified in an approach described in “Wave Impact Analysis.” Wave ClimatologyIn the application of the wave-scenario approach, waves at National Data Buoy Center (NDBC) buoy 42040 over the time period December 1995 through December 2013, the time range of consistent buoy operation, were used to build a wave climatology for the northern Gulf of Mexico by weighted averaging a set of representative scenarios. Hourly wave observations were divided into a discrete set of bins by significant wave height and mean wave direction. Eight significant wave height bins of width ranging from 0.5 to 1 meter (m) and 16 wave direction bins of width 22.5 degrees (°) were used (fig. 2). For each bin (appendix 1), a single representative time was chosen when the wave height and direction at buoy 42040 most closely matched the wave height and direction averaged over all observational times assigned to that bin. Because forcing conditions were provided by the National Oceanic and Atmospheric Administration (NOAA) operational WAVEWATCH III® model (http://polar.ncep.noaa.gov/waves/index2.shtml), an additional constraint was imposed that at the selected representative time step for each bin the error in significant wave height and wave direction for WAVEWATCH III® at buoy 42040 could be no more than 20 percent of the observed value at the buoy. The wave model was then run for each of these conditions to simulate the spatial variability of waves within the study area. Wave period, wind speed, and wind direction were not explicitly matched using this approach; however, Bayesian analysis that identifies the best matched times using significant wave height, peak wave period, peak wave direction, and wind speed showed only minor variation in the time periods chosen. Using the two methods to hindcast complete wave time series showed only minor improvement in predicting significant wave height and peak period and a slight decrease in the prediction of wave direction (Plant and others, 2013; Long and others, 2014). Analysis of the overall accuracy of the model in this study is presented with the results. The primary benefit of scenario-based modeling for this application is that the use of deterministic modeling to capture wave conditions over multiannual time scales in terms of computational expense would be prohibitive, while modeling over a shorter time scale might not capture truly representative conditions. A complete description of this wave-scenario approach and its application can be found in Long and others (2014); the current study increased the number of bins from 80 to 116 to better resolve the variability of larger wave heights (waves >2 m, fig. 2). Waves at buoy 42040 were most often out of the southeast with wave height less than 1.5 m (fig. 2). The largest storm wave conditions, with wave heights greater than 4 m, were also out of the south and southeast and commonly were associated with tropical storm events. A total of 12 bins out of the 128 wave height and direction combinations, all representing northerly waves of greater than 4 m, did not contain observations; therefore, 116 scenarios were used to capture the wave climatology at this site. The scenario-based wave modeling approach allowed for the spatial variability in wave conditions (and longshore flux) to be estimated for a given offshore wave height and direction. By using the percentage occurrences computed for each wave condition (fig. 2), a weighted average of the scenario results for a variable of interest was created. This weighted averaging technique, applied to significant wave height and longshore transport rates, was used to quantify changes in wave and sediment transport conditions around Breton Island for the two borrow pits. Numerical ModelThe Simulating WAves Nearshore (SWAN) numerical wave model (version 41.01; Booij and others, 1999; Ris and others, 1999; The SWAN Team, 2014) was used to characterize wave conditions for each scenario. A system of four one-way nested grids was constructed (fig. 1): G1 covered the northern Gulf of Mexico from Louisiana to western Florida at 1,500 m resolution; G2 covered the western half of the G1 domain from Louisiana to Alabama at 300 m resolution; G3 covered Breton Island and the surrounding offshore at 60 m resolution; and G4 focused on Breton Island itself and the proposed offshore borrow pits at 20 m resolution with an increased cross-shore resolution of 10 m in the nearshore region and over the island. Bathymetry for grids G1, G2, and G3 were provided by the NOAA National Geophysical Data Center (NGDC) Northern Gulf Coast digital elevation model (DEM) (Love and others, 2012). Bathymetric and topographic elevations for grid G4 were derived from the NGDC Northern Gulf Coast DEM, regional bathymetry collected in 2006–07 described by Miner and others (2009), and a 2014 topographic/bathymetric light detection and ranging (lidar) survey contracted by the U.S. Geological Survey. These elevations were merged and interpolated to the G4 grid using the scale-controlled interpolation method of Plant and others (2002). Wave boundary conditions for the G1 model at the open boundaries are prescribed from archived operational output of the NOAA WavewatchIII® 4-minute (~7.5 kilometer) resolution U.S. east coast multigrid (Tolman, 2008) using wave height, peak period, and peak direction with an assumed Joint North Sea Wave Project (JONSWAP) spectrum (Hasselmann and others, 1973). Wind forcing for all of the model grids was also provided by archived model output from the same WavewatchIII® grid. For each scenario, SWAN was run in stationary mode with a frequency range of 0.04–1.0 hertz (Hz), with frequency spacing of 0.1 times the frequency. Directional resolution was 6° over the full 360°. Minimum depth values were set at 0.2 m for G1 and G2, and 0.05 m for G3 and G4. Third generation Komen physics (Komen and others, 1984), including wind generation and whitecapping, were used for all simulations with parameterizations following Rogers and others (2003) to reduce inaccurate attenuation of swell energy by whitecapping. A default parameterization of JONSWAP (Hasselmann and others, 1973) bottom friction with 0.067 m2s-3 roughness was used, consistent with other applications of the SWAN or Delft3-D application to assess the effects of borrow pits on waves and alongshore transport (Benedet and others, 2007; Benedet and List, 2008; Hartog and others, 2008). The backward space backward time (BSBT) finite difference scheme was employed. Quadruplet computations were included using the default discrete interaction approximation (DIA) method for nonlinear 4-wave interactions (The SWAN Team, 2014). Depth-induced breaking following the Battjes and Janssen (1978) parameterization was included with default values for alpha (1) and gamma (0.73). Sensitivity testing was conducted to determine if triad wave interaction and wave diffraction needed to be activated in the model. Triad interactions are non-linear wave transformations in shallow water that result in transfer of energy across different frequencies, changing the shape of the wave spectra (Madsen and Sørensen, 1993; Booij and others, 1999). A more complete description of this analysis is found in the section Results. Diffraction did not significantly influence the wave model output, although triad wave interactions were found to be important and were activated in grids G3 and G4, using the default SWAN values of 0.1 for the proportionality constant, a maximum frequency cutoff of 5, a critical Ursell number of 0.2, and a lower threshold Ursell number of 0.01. For grids G1–G3, the SWAN NESTOUT command was used to generate the boundary condition files for the next higher resolution grid (grids G2–G4). Examples of input files for each of the four grids are provided in appendix 2. Borrow Pit DesignsTwo possible borrow pit designs, targeting potential sediment resources suitable for shoreline nourishment, were considered for their potential effects to the wave climate around Breton Island (fig. 3). Historical nautical charts of the area reveal geomorphic features that may contain sandy material: ebb-tide shoals associated with Breton Island Pass prior to the excavation of the MRGO and possible terminal spit deposits that may be related to former southward progradation of the northern Chandeleur barrier platform during the transgressive evolution of the islands seaward of the Breton Island platform. In addition, geophysical investigations indicate that distributary channels of the former St. Bernard delta are preserved in the subsurface in this area and may contain suitable sand deposits (Twichell and others, 2009). Because these deposits are located 5–10 km offshore of the Breton Island platform, with intervening deeper water, they are unlikely to contribute to the natural sediment budget of the island. Use of these deposits would contribute beneficially to the island’s sediment budget if the sediments were placed on the island or within the litorral system. Finally, the proposed borrow pits were positioned between the island and the prevailing wave direction to provide a scenario where affected wave action would have the most impact on the island platform. The thickness and extent of the offshore deposits are not known. Because the borrow pit design is intended for evaluating wave scenarios, the borrow design was adapted from the closest fully designed, evaluated, and implemented borrow pit in the area. In 2011 a borrow pit was excavated at the northern Chandeleur Islands to construct an emergency sand berm intended to mitigate island oiling from the Deepwater Horizon oil spill (Lavoie and others, 2010; Plant and others, 2014). Because the environment is similar, the same pit dimensions were used in the current study; results are only applicable for the specific potential designs evaluated with the numerical model. The proposed Breton Island restoration design is intended to mimic the island shoreline, dune platform, and back-barrier marsh dimensions prior to Hurricane Katrina, which caused severe erosion. To accomplish this design it is estimated that a minimum of 2.3 x 10⁶ m3 of sand will be required to replenish the shoreline and dune platform to pre-Katrina conditions. Some additional material may be necessary to support construction of the back-barrier marsh, which is estimated to require 550,000 m3 of muddy sediments. To fully accommodate sand requirements, the size of each borrow pit was designed to provide more than 4.0 x 10⁶ m3 of sediment, assuming a variable sand content of 70–100 percent and that a loss of material during excavation may occur. It is assumed that sufficient sand resources are present at each site to accommodate these excavation sand volumes. Dimensions for the borrow pits generated for the modeling scenarios are provided in table 1. For G4, the wave model was run for each of the wave scenarios for the baseline, no pit case, as well as for bathymetry grids including pit 1 and pit 2 (fig. 3). Wave Impact AnalysisThe primary concern if borrow pits impact patterns in wave propagation is the potential implications those changes might have on longshore sediment transport rates in the littoral system around Breton Island. In the current study, the methodology described by Adams and others (2011) was followed in which an empirical formulation was used to estimate the volumetric longshore sediment transport rate based on wave conditions. This methodology was originally proposed by Komar and Inman (1970) and later modified and named the CERC formula (Komar, 1998; Rosati and others, 2002). Even though the absolute transport values have uncertainty due to a lack of site specific calibration factors, the method has previously been used to determine relative sediment transport rates and gradients in the northern Chandeleur Islands (Georgiou and Schindler, 2009; Martinez and others, 2009). The cross-shore integrated volumetric sediment transport rate for sand-sized sediment is estimated as
where
The immersed weight transport rate is calculated by scaling the longshore component of the wave energy flux
where
The longshore wave energy flux, as it is commonly referred to despite some objections to the terminology (Longuet-Higgins, 1972), is calculated as
where
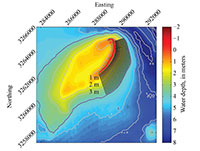
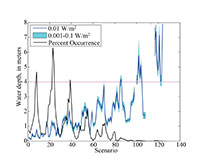
The SWAN model outputs significant wave height (HS), whereas Hb in the equation above is root-mean-square wave height (Hrms); therefore, output values of HS were converted to Hrms by dividing by 1.4 (Longuet-Higgins, 1952). Alongshore flux was calculated at a set of 135 shore-normal transects at 20 m spacing along the island (fig. 4). For each scenario and transect, the breaking wave height and direction were indepently found at the offshore location where the energy dissipation due to depth-induced breaking first exceeded 0.01 watt per square meter (W/m2) as waves traveled onshore. Alongshore transport was then calculated (eqs. 13) at each transect. The depth and cross-shore location of incipient wave breaking was not sensitive to the choice of threshold (fig. 5). For larger energy wave cases (offshore wave height 4+ m), the shallow slope of the inner shelf around Breton Island resulted in energy dissipation due to depth-induced breaking exceeding the 0.01 W/m2 threshold at locations off the island platform, defined as the 4 m contour (figs. 4, 5). In these cases, the wave height and direction at 4 m water depth were used. Alongshore flux was smoothed with a 200 m filter to remove small-scale variation not well resolved at the spatial resolution of the model. Resulting values were compared between the baseline no pit case and the two considered borrow pit configurations. The focus of the work was to examine changes in wave propagation and wave-breaking induced longshore sand-sized sediment transport near the island. Hence, no account was made for sediment input from the adjacent Mississippi River plume, which brings fine-grained sediment to the inner shelf and beyond. The effect of tidal currents around the island was also not considered due to the microtidal range of 30 centimeters (cm) (Boyd and Penland, 1988). These processes have likely contributed to the shape of the underlying island platform, but are expected to have less influence on shoreline evolution than the wave-induced transport of sand-sized sediment estimated by equations 13. Model results can only be used to infer the potential effects of the specific borrow pit designs considered on longshore transport. Analysis did not include assessments of cross-shore sediment transport or island overwash and inundation processes that also affect the short- and long-term topology and morphology of the island and island platform but are not expected to be affected by the dredging of borrow pits. |

![]() U.S. Department of the Interior |
U.S. Geological Survey
U.S. Department of the Interior |
U.S. Geological Survey
URL: http://pubsdata.usgs.gov/pubs/of/2015/1055/ofr2015-1055_methods.html
Page Contact Information: GS Pubs Web Contact
Page Last Modified: Thursday, 31-Aug-2017 15:19:27 EDT