Professional Paper 1386–A
Select image for high resolution and Save to download 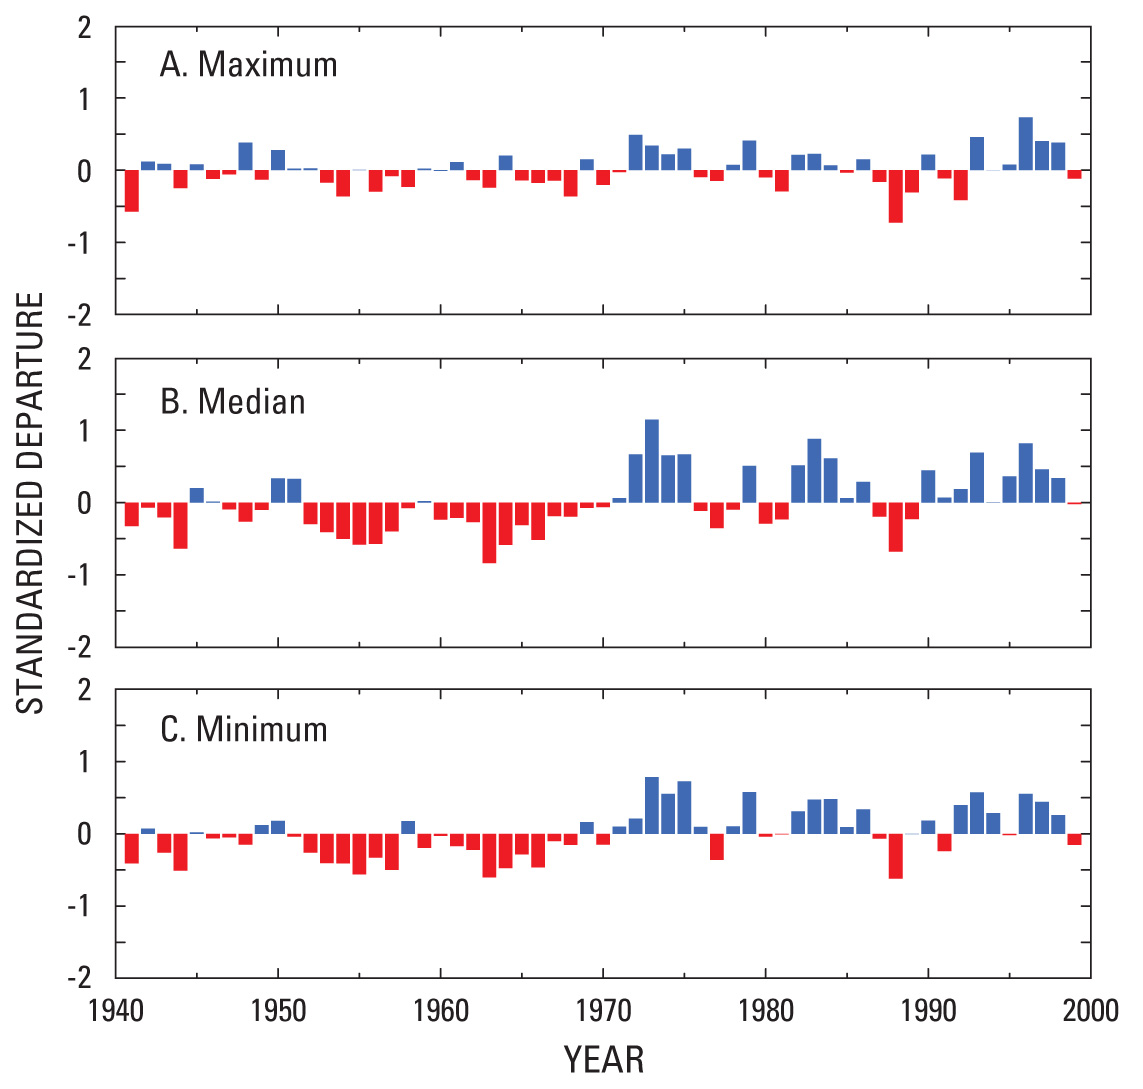 Figure 10. Mean standardized departures of annual maximum, median, and minimum daily streamflow for 400 sites in the conterminous United States (1941 to 1999). Modified from McCabe and Wolock (2002). |

![]() U.S. Department of the Interior |
U.S. Geological Survey
U.S. Department of the Interior |
U.S. Geological Survey
URL: http://pubsdata.usgs.gov/pubs/pp/p1386a/gallery1-fig10.html
Page Contact Information: GS Pubs Web Contact
Page Last Modified: Thursday, 01-Dec-2016 16:24:46 EST
