Professional Paper 1386–A
Select image for high resolution and Save to download 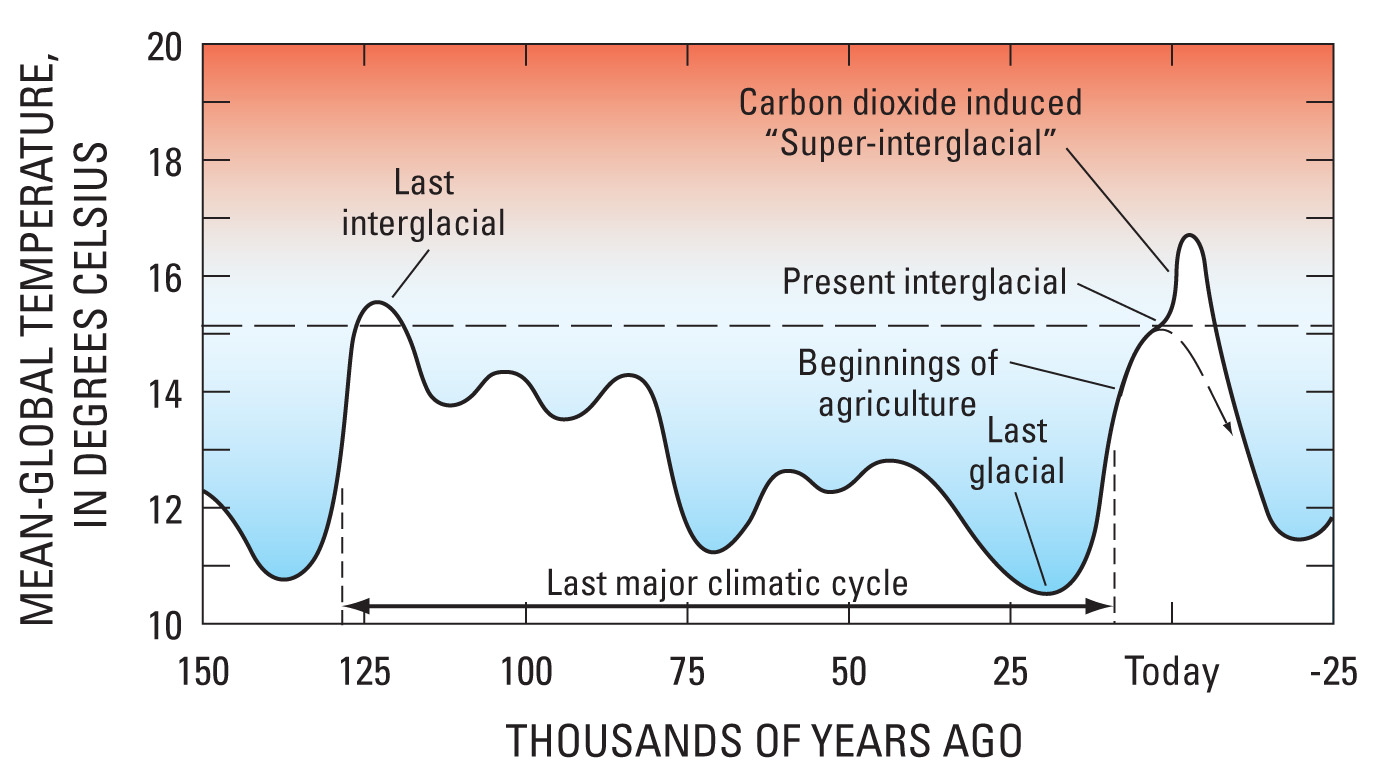 Figure 16. Graph of mean global temperatures for the last 160,000 years, and theoretical projection 25,000 years into the future, showing an enhanced “global warming” at the end of the Holocene Epoch (interglacial) before the start of the next glacial. Modified from Imbrie and Imbrie (1979, p. 186). |

![]() U.S. Department of the Interior |
U.S. Geological Survey
U.S. Department of the Interior |
U.S. Geological Survey
URL: http://pubsdata.usgs.gov/pubs/pp/p1386a/gallery1-fig16.html
Page Contact Information: GS Pubs Web Contact
Page Last Modified: Thursday, 01-Dec-2016 16:24:40 EST
