Laguna San Rafael was discovered in 1675. The glacier that bears its name did not reach the lagoon at that time. It probably reached it at some time between 1741 and 1766 (Casassa and Marangunic, 1987), and it has maintained a calving front since then. It has been inferred from actual glacier velocities that the lagoon extends 6 km eastward of the 1994 calving front.
The first documents on Glaciar San Quintín followed a visit by Nordenskjöld in 1921 and another by Brüggen in 1935. Its front had receded by 2 km between those dates (Lliboutry, 1956). Between 1939 and 1959, it advanced by 2.3 km. Between 1959 and 1992, it receded by 3.7 km (Warren, 1993). Comparison of the oscillations of Glaciars San Quintín and San Rafael were made by Winchester and Harrison (1996) using dendrochronology.
Variations of all the outlet glaciers of the NPIF have been determined from Trimetrogon aerial photography acquired in January and February 1945, as well as from Landsat MSS imagery of 1974-75 and 1985-86 (Aniya, 1988, 1992). Hirano and Aniya (1996) compared MSS Landsat imagery of 1987 and Russian satellite photography (KFA-1000) of 1988. Wada and Aniya (1995) and Aniya and Wakao (1997) used oblique aerial photographs taken by hand-held 35 mm cameras in 1990-91, 1993-94, and 1995-96. The variation in areas between 1945, 1975, 1986, 1991, 1994, and 1996 are given in a paper by Aniya and Wakao (1997). To smooth out the short-term irregularities and to obtain smoothed data pertinent to climatological studies, the mean recession rates between 1945 and 1975 (30 years) are compared in table 11 with the ones between 1975 and 1996 (21 years). It appears that all outlet glaciers are receding and that the recession rates increased after 1975, except for four glaciers on the southeast, which are not outlet glaciers of the ice field.
Table 11.-- Mean variation of the glaciers of the Northern Patagonian Ice Field
[Given in ha a-1=10-2 km2 a-1. Based on data from Aniya and Wakao (1997). Those marked with an asterisk (*) are not outlet glaciers of the ice field]
|
Glacier name |
1945 to 1975 |
1975 to 1996 |
|---|---|---|
|
North side (from east to west) |
||
|
Exploradores* (San Valentín east) |
-0.53 |
-3.10 |
|
Grosse* (Circo) |
-1.30 |
-3.00 |
|
Reichert* northeast arm |
-2.03 |
-8.43 |
|
West side (from north to south) |
||
|
Gualas north |
-.43 |
-3.00 |
|
San Rafael |
-11.87 |
-40.19 |
|
San Quintín |
-25.00 |
-23.57 |
|
Benito |
-2.20 |
-4.43 |
|
HPN-1 |
-5.83 |
-6.76 |
|
HPN-2 |
-4.70 |
-8.22 |
|
HPN-3 |
-.73 |
-7.81 |
|
South side (from west to east) |
||
|
Steffen |
-8.07 |
-14.67 |
|
Piscis* |
-1.63 |
-.10 |
|
Pared Sur* |
-4.73 |
-1.29 |
|
Pared Norte |
-3.23 |
-1.52 |
|
East side (from south to north) |
||
|
de la Colonia |
-3.23 |
-4.95 |
|
Cachet* |
-8.93 |
-6.48 |
|
Nef |
-4.87 |
-13.24 |
|
Soler |
-1.27 |
-3.57 |
|
León |
-.07 |
-2.44 |
|
Fiero |
-.50 |
-1.33 |
|
Total of the NPIF |
-92.9 |
-174.2 |
The area of the NPIF in 1945 was 4,400 km2, according to Lliboutry (1956). In 1975, it was 4,200 km2, according to Aniya (1992). Because the area of the NPIF was measured on different maps by different authors, it is difficult to judge the accuracy of the change. According to Aniya and Wakao (1997), the change between 1945 and 1975 has been only -28 km2 (and -37 km2 between 1975 and 1996). The general recession of the Patagonian ice fields is probably related to a general warming by 0.4°C to 1.4°C since the beginning of the century south of lat 46°S. and to a decrease of the precipitation on the Pacific Ocean side of the ice field by as much as 1.4 m a-1 (Rosenblüth and others, 1995).
Table 12.--Glacier variation in the Southern Patagonian Ice Field
[Based on data from Aniya and others (1997)]
|
Glacier name |
Area in 1945 |
Variation from 1944-45 to 1985-86 |
|
|---|---|---|---|
|
|
(square kilometers) |
Square kilometers |
Percent |
|
Brüggen |
1,205 |
+59.9 |
+4.97 |
|
Moreno |
254 |
+4.1 |
+1.61 |
|
Penguín |
525 |
+2.5 |
+.48 |
|
Viedma |
903 |
-.3 |
-.03 |
|
Upsala |
869 |
-11.9 |
-1.37 |
|
Ameghino |
80 |
-4.3 |
-5.38 |
|
O'Higgins |
870 |
-49.6 |
-5.70 |
|
Jorge Montt |
494 |
-29.6 |
-5.99 |
|
Greve |
471 |
-33.3 |
-7.07 |
|
Lucía |
218 |
-18.4 |
-8.43 |
|
Amalia |
190 |
-33.4 |
-17.54 |
|
Total of the SPIF |
13,500 |
-500 |
-3.70 |
In 1952, glaciers of the FitzRoy group had not varied significantly since Father de Agostini had taken pictures of them 20 years before (Lliboutry, 1953). In contrast, during this same period of time, the recession of many alpine glaciers had been impressive. Nevertheless, such ground observations cannot yield a global picture of the behavior of Patagonian ice fields. This can be attained only by the use of aerial photography and satellite imagery.
Aniya and others (1997) published the variation in area of most glaciers of the SPIF between the summer 1944-45 (Trimetrogon aerial photography) and the summer 1985-86 (Landsat imagery). During these 41 years, the areal variation of the SPIF was -3.7 percent. In contrast, the areal variation of the NPIF during these same years was only -1.0 percent (Aniya and Wakao, 1997). The variations of the largest glaciers and of those that deviate the most from this mean are given in table 12.
The nonstandard cases of Glaciar Brüggen and Glaciar (Perito) Moreno are presented below. The advance of Glaciar Brüggen created a lake in the 1960's, and the large recession of Glaciar Greve is probably because its tongue became afloat in this lake. The most dramatic recessions are those of Glaciar O'Higgins in Lago San Martín/O'Higgins and of Glaciar Amalia, a tidewater glacier at lat 50°57'S. Between 1945 and 1986, their calving fronts receded by 11.2 km and 7 km, respectively.
In 1914, explorers found the upstream, uncrevassed part of Glaciar O'Higgins on the same level as its lateral moraine (Shipton, 1963). In 1933, the ice was lower than the moraine by 60 m, and in 1959, when the recession was at its climax, it was lower by 240-300 m. The fast recession between 1945 and 1978 (about 400 m a-1) probably resulted from the ice tongue's becoming afloat. Between 1978 and 1986, the recession stopped (Casassa and others, 1997), probably because the terminus again became completely grounded. The grounding line cannot remain where the subglacier terrain has a reverse slope, and thus, the glacier terminus commonly recedes by fits and starts. Mercer (1961) suggested the width of the fjord as another reason for its history of irregular fluctuation.
The large differences in variation among the glaciers of the SPIF contrast with the more uniform behavior of the glaciers of the NPIF. The main reason is that the SPIF has many more calving fronts of outlet glaciers than the NPIF. Wherever glaciers that have calving fronts are used to monitor climatic changes, only the mean variation during 20 years or more should be considered.
Some outlet glaciers consist of two ice streams side by side that have distinct, individual flow regimes. The east, main ice stream of Glaciar Jorge Montt, which reaches Fiordo Calén, lost 4.2 km2 between 1945 and 1986, whereas the west one, which does not reach the fjord, lost 25.4 km2 between these dates. The west ice stream of Glaciar Upsala receded continuously between 1945 and 1986, whereas the east one advanced between 1968 and 1978 and later receded rapidly (Aniya and Skvarca, 1992). The accumulation zone of this east stream has lowered by about 80 m between the sixties and 1993 at a training site for landing on snow (guide Claudio Schurer-Stolle, oral commun.).
After 1986, data are less complete. On the east side of the SPIF, Glaciar Ameghino has continued to recede by 0.1 km2 a-1, as it had previously (Aniya and Sato, 1995c), whereas the recession rate of Glaciar Upsala has increased by four times. After a maximum rate in 1993-94 (700 m a-1), the recession almost stopped in 1994-95 (Naruse and others, 1997) (fig. 53). It lost 10.3 km2 between 1986 and 1995 (Aniya and others, 1997). Its large icebergs, dispersed by the wind, can be seen throughout Lago Argentino. On occasion, they impede the entrance of tourist boats into the west arm.
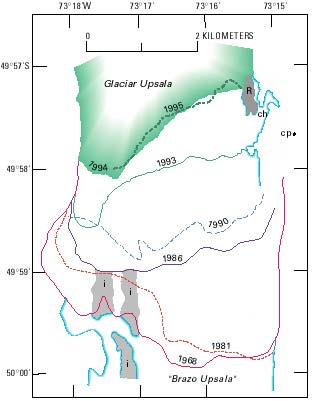
Figure 53.--"Front margins of Glaciar Upsala. The front positions of 1968 (November) and 1981 (February) were determined by vertical aerial photographs and that of 1986 (January) by Landsat Thematic Mapper (Aniya and Skvarca, 1992). The 1990 (November) position is based on observation from the east bank and the proglacial lake [Brazo Upsala], which has been modified from the front position shown by Aniya and Skvarca (1992). The 1993 (November), 1994 (December), and 1995 (December) positions of the front and the east margin were measured by conventional angle surveys from the control point (cp) on the east bank to prominent points at the terminus, as well as by Global Positioning System (Trimble Pathfinder Basic receivers) surveys at some points on the ice-rock boundary. R indicates a bare-rock ridge [extent shown by dark grey] seen along the east glacier margin in 1993, which was almost covered with ice in 1990; ch indicates a lateral water channel; and i indicates an island [extent shown by light grey] as seen in 1986 at the glacier front." Taken from Naruse and others, 1997, fig. 2, p. 39.
The recession of Glaciar Viedma has become significant but remains very low: 500 m between 1986 and 1994. It caused the outburst of an ice-dammed lake in 1994, as documented by X-Band Synthetic Aperture Radar (X-SAR) images (Skvarca, Rott, and Stuefer, 1995). Nearby in the FitzRoy group, Glaciar Grande has receded, which has allowed the bedrock to appear in the middle of the calving front since 1990. On FitzRoy itself, facing west, was a very steep couloir of ice, the "supercanaleta," by which Argentine climbers made the second ascension, digging grottos into the ice to bivouac. By 1993, all this ice had disappeared (guide Alberto del Castillo, oral commun., and visual inspection by the author from a helicopter, courtesy of the Argentine authorities).
Holmlund and Fuenzalida (1995) compared aerial photography of Cordillera Darwin taken in 1943-44, 1960, and 1984-85. They also visited the area in 1993-94. During all this time, in general, glaciers have receded slowly on the order of -1.0 m a-1. Nevertheless, the front of the largest glacier, Glaciar Marinelli (142 km2), receded by -0.2 km between 1943 and 1960 and by -5.0 km between 1960 and 1993. Probably the front of this tidewater glacier became afloat. On the other hand, during the second period of time, three out of the six glaciers flowing to the southwest into Bahía Pía (an embayment of the Beagle Channel) advanced by +0.2 to +0.4 km in 33 years.
In the Cordillera Darwin area, cyclonic fronts are less active than in the SPIF, and thus, annual precipitation is lower. The cyclones, which cross the Drake Passage to the south from northwest to southeast, are generally occluded systems and provide precipitation in their lee. Therefore, snowfalls are accompanied by southwest winds. In the SPIF, which runs north to south, a strong dissymmetry is found in the precipitation from west to east. In Cordillera Darwin, which runs northwest to southeast, the same dissymmetry is recorded from southwest to northeast.
The meteorological station at Punta Arenas (figs. 1 and 3) has monitored temperature and precipitation on the leeward side of the region (the semiarid pampa) since the beginning of the century. Mean annual temperature has increased by only 0.3°C, and precipitation (about 400 mm a-1) shows no significant trend. The data from the lighthouse of Islas Evangelistas, at the west entrance of the Strait of Magellan, show an increase in mean temperature by about 1°C and a decrease in mean precipitation from about 3,000 mm a-1 to about 2,000 mm a-1. Holmlund and Fuenzalida (1995) suggest that the same trends hold for the southwest, windward side of Cordillera Darwin. Given that its glaciers have been more or less in equilibrium, such is probably not the case.
Aniya and others (1997) did not find any correlation between the variations of the SPIF glaciers and latitude, accumulation area ratio (AAR), total glacier area, or surface gradient at the equilibrium line. The first absence of correlation is not a surprise: around lat 50°S., the variation in climate with latitude is insignificant compared to the climate variation between the windward and leeward sides of the Andes. The three other factors that cannot be correlated are discussed as follows:
AAR. Glaciers that have smaller AAR's would be expected to recede, and the opposite would be true for glaciers that have larger AAR's. However, the history of variation in AAR for SPIF glaciers does not meet this expected norm. Two classes of outlet glaciers have been distinguished: tidewater glaciers and glaciers that terminate on land. In 1945 among tidewater glaciers, the lowest AAR's were for Glaciar Asia (0.65) and Glaciar Amalia (0.66). The very large recession of Glaciar Amalia has raised its AAR to 0.80, its standard value. The surprising fact is that, up to 1986 at least, the recession of its neighbor, Glaciar Asia, has been insignificant. As for glaciers that calve into lakes or that lack a calving front, their mean AAR in 1986 was 0.736. The three glaciers of this kind that had the largest recession between 1945 and 1986 are Glaciar Lucía, whose AAR increased from 0.66 to 0.72, Glaciar Greve (0.62 to 0.67), and the west stream of Glaciar Jorge Montt (0.70 to 0.75 for the entire glacier). In contrast, with smaller AAR's of 0.62, Glaciar Tyndall had a normal recession, and Glaciar Grey, a small one. Glaciar Viedma, having an AAR of 0.58, did not recede at all.
Total glacier area. Table 12 shows that even the relative change in area is not correlated with the total glacier area. The most important variable is the glacier length because of the well-known lag in time between any change of the mass balance and the response of the front. The response may be considered as the sum of kinematic waves starting from all the points of the glacier, and the velocity of these waves is independent from the glacier area. In the case of Glaciar Upsala, its east stream, which is about 60 km long, should lag in time behind its west stream, which is fed by tributaries 10-15 km long.
Surface gradient. As a first, rough approximation, kinematic waves may be ignored. The discharge of ice through a fixed cross section near the glacier terminus, which governs the position of this front, equals the sum of the mass balance over the entire glacier surface. With z denoting the surface elevation, S(z) the area from the cross section, and b(z) the mass balance, the discharge is ![]() b (
b (![]() S/
S/![]() z)
z) ![]() z. The variations of the discharge depend on the surface gradient (
z. The variations of the discharge depend on the surface gradient (![]() S/
S/![]() z), where the variations of b are the largest. In Patagonia, the main factor in the variations of b is a change in the mean altitude of the rain-snowfall limit (mean RSLA). Aniya and others (1997) consider implicitly that the mean RSLA is the ELA, but this assumption is questionable. In Patagonia, the RSLA ranges from nearly sea level in winter to 2,600-2,700 m in February, and precipitation falls all year and has comparable monthly totals. Therefore, the statistical distribution of the RSLA and the whole hypsography of the glacier are involved, not only
z), where the variations of b are the largest. In Patagonia, the main factor in the variations of b is a change in the mean altitude of the rain-snowfall limit (mean RSLA). Aniya and others (1997) consider implicitly that the mean RSLA is the ELA, but this assumption is questionable. In Patagonia, the RSLA ranges from nearly sea level in winter to 2,600-2,700 m in February, and precipitation falls all year and has comparable monthly totals. Therefore, the statistical distribution of the RSLA and the whole hypsography of the glacier are involved, not only ![]() S/
S/![]() z at some elevation.
z at some elevation.
We have no statistics of the RSLA for a full year in the Patagonian Andes. An estimate of its mean value might be drawn from the contrasting behaviors of Glaciares (Perito) Moreno and Upsala, the only ones whose hypsographies have been published (Aniya and Skvarca, 1992). If the highest 10 percent and the lowest 10 percent of their areas are ignored, the elevation of the surface of Glaciar (Perito) Moreno ranges between 530 m and 2,130 m, and the median elevation (50 percent of the area above and 50 percent below) is 1,560 m, whereas its ELA (in 1986) was at 1,150 m. Glaciar Upsala, over 80 percent of its area, ranges between 800 m and 1,800 m, and its median elevation is 1,290 m, whereas the ELA is at 1,200+-50 m. Because Glaciar (Perito) Moreno is more or less in equilibrium and Glaciar Upsala has receded at an accelerating rate, we suggest that the difference between the median elevation and the ELA is critical.
The first records about glacier termini in both Americas came from Spanish seamen who, starting from Valparaíso, Chile, tried to pass through the Strait of Magellan in a direction opposite to that traveled by Magellan in 1520. (Remember that no other way into the Atlantic Ocean was known until 1578.) Francisco de Ulloa in 1553 and Cortés Ojeda and Ladrillero in 1557 (both captains of ships sent by Governor García Hurtado de Mendoza) all made the same error. They entered Estrecho de Concepción (Canal Concepción) thinking that it was the Strait of Magellan (Estrecho de Magallanes), whose entrance is 200 km farther south (see fig. 54). The fact that a series of channels and a fjord (Fiordo Eyre) ran northeast or north-northeast instead of southeast did not induce them to turn around until they were stopped by the calving front of Glaciar Brüggen, which was as advanced as it is today. In 1993, Rivera, Aravena, and Casassa (1997) found trees up to 524 years old (Ciprés de las Guaitecas, Pilgerodendron uviferum) close to the glacier margin, north of the mouth of Fiordo Exmouth. Thus, since at least 1469, Glaciar Brüggen has never advanced as far southward as in recent times (fig. 55).
Figure 54.--Southern Patagonia showing towns and some meteorological stations that are referred to in the text. Numbers between brackets are the dates of discovery. Dashed line is the border between Argentina and Chile, as fixed in 1902 by British arbitration. Red and purple lines are Caldenius' "third" and "fourth" systems of end moraines, which are dated at 18 ka and 10 ka (from varves) or at 19 ka and 13 ka (from 14C), respectively. The -200 m bathymetric contour line corresponds more or less with the limit of the continental shelf. The three largest green areas are the Northern and Southern Patagonian Ice Fields and the ice field of Cordillera Darwin (modified from Lliboutry, 1956, 1965). Abbreviations: Ba., Bahía; Co., Cordillera; I., Isla; L., Lago; Pen., Peninsula; Pta., Punta; R., Río; Sta., Santa.
Figure 55.--Documented changes in the position of the terminus of Glaciar Brüggen (see text for discussion of fluctuations).
No other visit to Fiordo Eyre is known until the one by Captain Parker King on board H.M.S. Beagle in 1830. He described Río Greve as flowing at the head of the fjord over flat land from Glaciar Greve, but no calving front was observed (Mercer, 1964). The calving front of Glaciar Brüggen was probably hidden in a lateral bay 12 km from the west coast of Fiordo Eyre, as is depicted in the Carta Nacional de Chile.
In 1925, a Norwegian farmer named Samsing attempted to establish a homestead in the grasslands of Río Greve. (The fact that this area was unforested supports the idea that it was a lake bottom not many years before.) The front of Glaciar Brüggen was then about 1 km from the opposite coast. In September 1926, it advanced and closed off the end of the fjord. Samsing was able to escape, but he lost all his cattle and his farmstead (Agostini, 1945, p. 62-63).
The end of the fjord began to open again in 1930. In 1945, inspection of Trimetrogon aerial photographs showed that the front of Glaciar Brüggen was 2.2 km from the opposite coast. The Chilean expedition of 1962 found that it had advanced and reached the opposite bank and that a lake began to form behind this ice dam (fig. 55). In 1976, an early satellite image showed an extensive lake, 24 km long and 15 km wide in the center, where it reached Glaciar Greve. The glacier had advanced 4 km between 1962 and 1976, probably caused by its becoming afloat. The lake was still present in 1978, when it was photographed from the Salyut-6 orbital space station (Desinov and others, 1980) (fig. 31). Inspection of Landsat imagery shows that Glaciar Brüggen has undergone little change since 1976 (Aniya and others, 1992).
In my opinion, the situation as it was in 1553-57, and as it has been again since 1947, is the normal one. The considerably large recession observed in 1830 was probably caused primarily by the nearby volcanic activity of Cerro (Volcán) Lautaro (see Rivera and others, 1997).
Glaciar (Perito) Moreno has repeatedly blocked Canal de los Témpanos (the "channel of theSoler icebergs") and separated Lago Argentino from its southernmost arms, Brazo Rico and Brazo Sur. According to Raffo and others (1953), the water level in the dammed part (called Lago Rico) rose 14.9 m in March 1942 and 14.4 m in March 1953 and flooded as much as 66.7 km2 of grassland. However, height measurements to the vegetation line, which is clearly marked by water erosion, indicate that the maximum rise of Lago Rico during this century was around 23 m, and it was about 19 m in 1988 (Pedro Skvarca, written commun.). The outburst of the stored water (on the order of 1x10⁹ m3) floods the shores of Lago Argentino and its outlet, Río Santa Cruz (fig. 54).
The width of the dam formed by Glaciar (Perito) Moreno is only a few hundred meters, although the calving fronts in Canal de los Témpanos and in Brazo Rico are 3.0 km and 2.1 km wide, respectively (figs. 39 and 43). The depth of these arms and the temperature and circulation of their water have never been studied. In Brazo Rico, which trends west to east, the wind propels the icebergs into warmer water. A return current at about 4°C (the temperature for which the density of pure water is a maximum) probably exists at depth. This water would melt the ice cliff at its bottom, and thus, the calving process would be different from the one in tidewater glaciers, where most melting is near the ocean surface. In Canal de los Témpanos, which runs north to south, the circulation should be much slower. Advances and retreats of the calving front result from the balance of glacier velocities and calving rates, the former being more variable than the latter. Therefore, the monitoring of closures is useful. Over the long term, Glaciar (Perito) Moreno is more or less in equilibrium (Naruse and others, 1995).
Raffo and others (1953) gathered all information previously known about ice dammings. The first reported one was in January 1917, after a 1-km advance of the front. (Other dammings might have taken place prior to this, but no local inhabitants were around to report their occurrence.) After January 1917, the following ice dams formed:
From January to December 1935
From July 1939 to 17 February 1940
From the beginning of January 1941 to 21 March 1942
In December 1946
In November 1947
From April to December 1948
From the end of September 1951 to the beginning of March 1952
From October 1952 to the end of March 1953
Ice dammings also took place in 1966, 1970, 1972, 1975, 1977, 1980 (together with an outburst flood on 17 February 1980), 1984, 1988, and 1990 (del Valle and others, 1995). The successive lapses of time during which the channel has been open have lasted 216, 43, 11, 69, 11, 5, 33, 7, 36, and 156 months. The duration of the ice dammings (excepting the very short ones in 1946 and 1947) has been more regular: 8+-3 months. About 8 months is probably the time needed for subglacial waterways to become enlarged by melting of the conduit walls, which precedes the final collapse of their roofs. The fact that the failure of the ice dam always happens in summer, especially in late summer, indicates that the water flowing into the waterway probably consists of surface water warmed by the Sun and that the melting of the ice walls by this warmth is the main factor for the opening of the dam.
A rough modeling of the opening is possible assuming that, at a given instant t, the water in the conduit is at a uniform temperature (![]() ) in spite of the melting at the walls, an assumption that implies that the increase of the discharge (Q) along the conduit is negligible. Then, the cross-sectional area of the conduit (S) remains uniform over its entire length (L), and H denotes the level of Brazo Rico above Canal de los Témpanos, so the piezometric gradient is H/L. The Manning empirical formula for turbulent steady flows reads
) in spite of the melting at the walls, an assumption that implies that the increase of the discharge (Q) along the conduit is negligible. Then, the cross-sectional area of the conduit (S) remains uniform over its entire length (L), and H denotes the level of Brazo Rico above Canal de los Témpanos, so the piezometric gradient is H/L. The Manning empirical formula for turbulent steady flows reads
Q=k1 S4/3 H1/2
where k1 is a constant. With ![]() denoting the water input into Brazo Rico, we have
denoting the water input into Brazo Rico, we have
![]() H/
H/![]() t=k2 (
t=k2 (![]() -Q).
-Q).
Last, the melting of the walls of the waterway yields
![]() S/
S/![]() t=k3
t=k3 ![]() Q
Q
where ![]() and
and ![]() are given functions of time. At the start, H=Q=0, and S=S0. The cross section S is an ever-growing function of time. H is a maximum when Q=
are given functions of time. At the start, H=Q=0, and S=S0. The cross section S is an ever-growing function of time. H is a maximum when Q=![]() , and then Q is still increasing. Later, assuming
, and then Q is still increasing. Later, assuming ![]() and
and ![]() are constant, Q decreases and tends toward
are constant, Q decreases and tends toward ![]() , S goes on increasing more or less linearly with time, and H decreases as t-8/3. The model is no longer valid when open flow takes place in the subglacial channel. The tunnel is then about 30 m in diameter, and it collapses the following day. Photographs of this spectacular event have been taken by DeRoy Moore (1981), and a videotape of it is for sale.
, S goes on increasing more or less linearly with time, and H decreases as t-8/3. The model is no longer valid when open flow takes place in the subglacial channel. The tunnel is then about 30 m in diameter, and it collapses the following day. Photographs of this spectacular event have been taken by DeRoy Moore (1981), and a videotape of it is for sale.
| Home | Next |
U.S. Geological Survey, U.S.Department of the Interior