Scientific Investigations Report 2005-5255
U.S. GEOLOGICAL SURVEY
Scientific Investigations Report 2005-5255
Three distinctly different types of data were collected over a range of hydrologic conditions during this investigation. Data needs included (1) identification and monitoring of areas of ground-water discharge; (2) collection of water-quality samples of discharging ground water prior to interaction with surface water at or near the hyporheic mixing zone; and (3) a laboratory experiment to assess the attenuation of fecal bacteria in sediments from a local stream. Because streams varied in size from small drainage areas to the Nooksack River, various data-collection methods were used that were appropriate to stream size. The small drainage areas included tributary streams (Fishtrap and Fourmile Creeks and a tributary of Bertrand Creek) draining intensive agricultural areas overlying the Sumas aquifer.
Determining the locations of ground-water discharge to streams was essential in the evaluation of the quality of discharging ground water. A preliminary assessment of ground-water discharge was conducted to identify areas where ground-water discharges were likely to occur. Existing data used to identify areas of ground-water discharge included miscellaneous measurements of low-flow discharge in lowland streams in Whatcom County in August 2000, and aerial images produced by Forward Looking Infrared Radar (FLIR), taken on August 20, 2001, for about a 60-mile reach of the lower mainstem of the Nooksack River and South Fork Nooksack River (Watershed Sciences, LLC, 2002). The FLIR images showed areas of cooler temperature along the banks of the Nooksack River at some locations indicating the possible presence of discharging ground water.
In addition, a longitudinal temperature profile was conducted along the lower 14-mile reach of the South Fork Nooksack River. The longitudinal temperature profile was developed from a survey of near continuous measurements of stream-water temperatures that were measured near the streambed where discharging ground water would have the greatest influence on stream water temperatures. The survey was conducted during base-flow conditions when average differences between the ground-water and surface-water temperatures exceeded 4°C. Beginning at the upstream location and preceding in the downstream direction the survey was conducted from a raft carried by the current. A sensor towed along the riverbed recorded data at 2-second intervals for water temperature. A simultaneously recording Global Positioning System (GPS) was used to generate georeferenced data. However, most of the GPS data were corrupted, so field notes and traveltime were used to interpolate between known points. Locations of discharging ground water were identified by changes in slope of the longitudinal temperature profile. This method is described in more detail by Lee and others (1997) and has been successfully applied in the Yakima River (John Vaccaro, U.S. Geological Survey, written commun., 2002).
Ground-water discharge was confirmed by measuring the difference in hydraulic head between the stream and the underlying ground water. Ground-water levels were directly compared to surface-water levels using temporary piezometers and either a manometer board or steel measuring tape. Vertical hydraulic gradients were computed by dividing the difference between the water levels in the stream and the underlying ground water by the depth of the midpoint of the screened interval below the streambed (Winter and others, 1988). Ground-water discharge is indicated when the water level inside the piezometer is higher than the water level of the stream. This condition indicates that the stream is gaining flow, and by convention, the vertical hydraulic gradient is assigned a positive value. In losing stream reaches, the water level in the piezometer is lower than the water level of the stream and the vertical hydraulic gradient is assigned a negative value. The use of the manometer board is shown in figure 2, and additional details on measurement of vertical hydraulic gradients are presented in Simonds and others (2004).
Temporary in-stream piezometers were installed to measure ground-water levels and to collect water-quality samples of discharging ground water. Piezometers (≤0.5 in. in diameter) were installed beneath the streambed in areas of calm water away from riffles. Piezometers installed along Fishtrap Creek and the Nooksack River were constructed from a 7-foot length of 0.5-inch-diameter steel pipe in which the end was crimped and perforated with numerous holes roughly 0.063 in. in diameter. The piezometer was then driven into the streambed until the perforations were positioned about 3.0 to 6.5 ft below the sediment-water interface to reduce the possibility of sampling surface water from within the hyporheic zone.
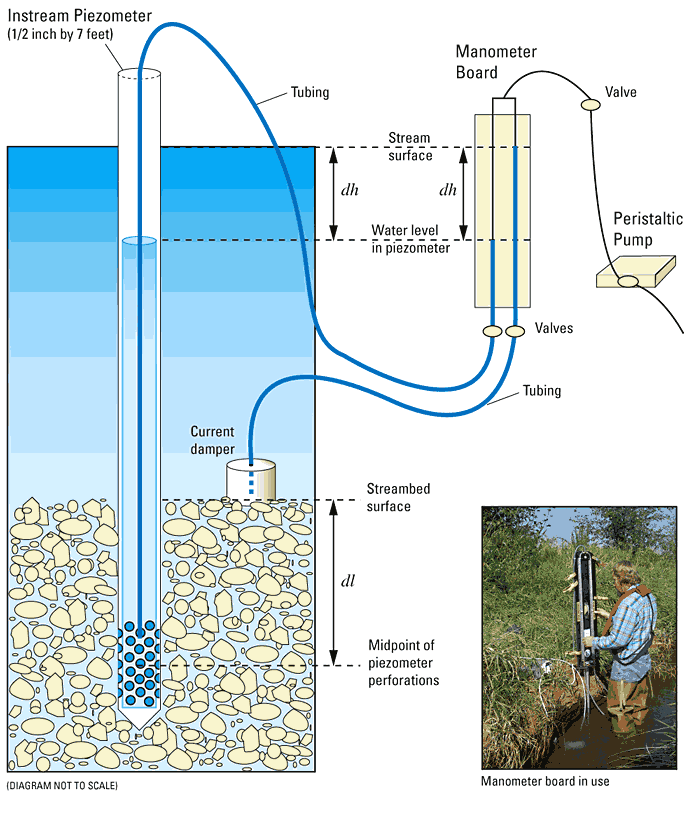
dh is the difference in head (water level) between surface water and ground water. dl is depth below the streambed to the midpoint of piezometer perforations. Vertical hydraulic gradient is determined by dividing dh by dl.
An alternate construction technique was used for installing piezometers at ground-water discharge study sites on Fishtrap and Fourmile Creeks and a tributary to Bertrand Creek. These piezometers were constructed by driving a 0.5-inch pipe with a loosely fitting plug about 5 ft below the surface. A 6-inch-long stainless-steel screen was attached to a section of 0.375-inch polyethylene tubing and inserted to the bottom of the pipe. The pipe was then withdrawn in a manner that detached the plug allowing the screen to remain in place as the pipe was removed. Saturated sediment around the polyethylene tubing typically collapsed against the tubing. Bentonite pellets were used to fill the annular space and seal void areas in the unsaturated sediments near the surface. A peristaltic pump was used to flush sediment and turbid water from the screen area and develop communication between the piezometer and the shallow aquifer. Isolation of the ground water and surface water was checked by comparison of water-quality parameters including water temperature, specific conductance, and dissolved oxygen.
Temporary gaging stations were established at each of the four ground-water discharge study sites in order to provide continuous monitoring of surface-water levels, which could be compared with ground-water levels in the underlying shallow aquifer. At each site, a staff plate was installed so that surface-water and ground-water level measurements could be referenced to a common arbitrary datum that was established for each site. Surface-water levels were monitored by installing a 1.25 to 1.5-inch pipe to house a data logger just above the streambed. Ground-water levels were monitored by installing a similar pipe, fitted with a 6-inch well screen, and driven into the streambed such that the screened interval was 5.0 to 6.5 ft below the streambed. These piezometers also were instrumented with a data logger placed within the screened section. All data loggers used in this study consisted of a self-contained pressure transducer and temperature thermistor and were set to store readings at 1-hour intervals. All piezometers were vented to the atmosphere and all data were compensated for atmospheric barometric pressure as recorded by a separate data logger placed at the land surface and exposed to the atmosphere. Periodic staff gage readings and physical measurement of ground-water levels were used to confirm the continuous data and make adjustments as necessary.
To characterize the potential range of water-quality responses to the hydrologic system discharging ground water to the streams in the lower Nooksack River basin, four sites were selected for detailed study of ground-water discharge. The specific sites were selected along four different streams based on the presence of discharging ground water. The selected sites represent: (1) a large drainage basin, more than 400 mi2 in area, characterized in its lower reaches by flat topography and agricultural land use; (2) a drainage ditch used to control ground-water elevations in an agricultural production field; and (3) two tributary drainages to the mainstem of the Nooksack River, both of which retain a large portion of the natural drainage channel. A major tributary of the Nooksack River, the South Fork Nooksack River, was considered for intensive monitoring, however, a suitable site for investigation of discharging ground water was not found.
Ground-water discharge study sites were selected along reaches of streams where field application of dairy manure was applied to the adjacent fields. One of the sites is located along the Nooksack River about 2 mi upstream of the town of Everson, Washington. This site was selected for continuous monitoring of ground-water and surface-water levels and for the collection of samples of discharging ground water in order to provide data for a high order stream in a large river basin, which encompassed several hundred square miles of drainage area. Fishtrap Creek was selected for study because numerous drainage ditches empty into it creating a complex drainage network. Nine sites with temporary piezometers were established at intervals ranging from 0.6 to 1.6 mi apart along Fishtrap Creek. These sites provided a longitudinal profile along a primary drainage stream in the lower basin. Vertical hydraulic gradients at these sites were measured intermittently over a 2-year period. Ground-water discharge study sites were established at known ground-water discharge areas along Fishtrap and Fourmile Creeks and a tributary ditch to Bertrand Creek. These ground-water discharge study sites were composed of arrays of piezometers arranged in two or three transects of three piezometers each installed perpendicular to the creek. Data from these sites provided detailed information on temporal and spatial distribution of ground-water discharge at an individual field scale.
The site on the Nooksack River near Everson was selected because ground-water discharge from the bank was indicated in the results of a FLIR survey, which showed cooler temperatures along a portion of the riverbank. Numerous measurements of vertical hydraulic gradient made using the manometer board confirmed the widespread occurrence of discharging ground water at this site. The site also had existing ground-water sampling infrastructure in the adjacent field near the riverbank that provided additional ground-water information. A set of 12, 0.75 inch-diameter, PVC piezometers with a 2-foot-long screened interval had been installed at this site in September 2001. The wells had been installed adjacent to the river and arranged in three transects, each being composed of two well pairs. The transects were aligned perpendicular to the riverbank with the wells located in the field at the top of the bluff—one pair about 20 ft from the edge of water and the other about 40 ft from the edge of water. Each pair consists of a deep well (25 to 40 ft) and a shallow well (10 to 15 ft). Distance along the riverbank between transects was about 500 ft. In addition, two continuous multi-channel tubing (CMT) observation wells (EVW-1 and EVW-2) were installed at distances of 0.25 and 0.5 mi from the river in June and August 2004. Each of these wells was installed with 0.1 to 0.2-foot-long open intervals at 9, 27, and 43 ft (well EVW-1) and 12, 27, and 42 ft (well EVW-2),
At the Nooksack River site and each of the other ground-water discharge study sites, a temporary surface-water gaging station was established and instrumented with a data logger in order to assess temporal variability in surface-water levels and water temperature. An in-stream piezometer screened 3 to 5 ft below the sediment-water interface was installed through the riverbed generally within a few feet of the gaging station. The piezometer was instrumented with a data logger to record ground-water levels and water temperature. At the site on the Nooksack River near Everson, ambient ground-water information also was collected by installing a data logger in monitoring well (ABS-480) located about 2 mi southeast of the site (fig. 1).
To assess site-specific spatial variability of ground-water discharge, arrays of piezometers were installed in a series of three (on the right bank, left bank, and center of the channel), forming two or three transects perpendicular to the stream about 50 to 75 ft apart. These transects were established at ground-water discharge study sites on the three smaller streams—Fishtrap, Fourmile, and Bertrand Creeks. Installation of piezometers in these transects facilitated measurement of vertical hydraulic gradient and collection of water samples during all flow conditions, including very high flows (flooding).
Water-quality samples were collected from piezometers at each study site and were analyzed for E. coli bacteria and a suite of compounds including nitrate as N, nitrite as N, chloride, excess dissolved nitrogen gas, dissolved organic carbon as C, and ferrous iron. Sterile techniques were used during collection, storage, and analysis of surface-water and ground-water samples for bacterial analysis. Surface-water samples were collected by hand from the midpoint of the stream. Samples were obtained from piezometers using a peristaltic pump with autoclavable silicon tubing. Samples for bacteria analysis were collected into a sterile 250-mL polyethylene bottle and transported on ice to a field laboratory of the U.S. Geological Survey (USGS), Washington Water Science Center, Tacoma, Washington, for processing and incubation within 24 hours of collection.
E. coli was used as the indicator species of fecal contamination as recommended by the U.S. Environmental Protection Agency (2002). Ground-water and surface-water samples analyzed for concentrations of E. coli. (reported as Colony Forming Units per 100 mL or CFU/100 mL) were enumerated using the enzyme-substrate most-probable number (MPN) enumeration technique (American Public Health Association and others, 1998). This technique was used because it requires less field processing and produces results that are comparable to the membrane filter technique outlined in the USGS National Field Manual for the collection of water-quality data (Myers and Sylvester, 1997).
Quality-assurance samples included blanks, replicates, and positive control samples containing less than 50 cells each of E. coli, Klebsella pneumoniae, and Pseudomonas aeruginosa. The positive control samples were provided by IDEXX Laboratories (Westbrook, Maine). All positive control samples gave the proper enzymatic color change response and resulted in most-probable number concentrations of from 7 to 16 CFU/100 mL. E. coli was not detected in any of the field or laboratory blank samples. The relative percentage of difference of duplicate samples ranged from 87 to 315 percent.
In addition to monitoring for bacterial indicators, field measurements of water temperature, specific conductance, dissolved oxygen, and ferrous iron were measured on-site during sample collection. Samples collected for analysis of nitrate and major ions were passed through a 0.45-µm membrane filter into polyethylene bottles, chilled, and sent to the USGS National Water Quality Laboratory (NWQL). At the NWQL, samples were analyzed for concentrations of nitrate by colorimetry (Fishman, 1993). Major ions were analyzed by ion chromatography described by Fishman and Friedman (1989). In this study, dissolved nitrogen in excess of atmospheric input was used to determine the degree to which biogeochemical breakdown of nitrate was occurring before ground water discharges into the surface-drainage system. Concentrations of dissolved nitrogen and argon were determined by head-space gas chromatography at the USGS Dissolved Gas Laboratory in Reston, Virginia. Water temperature and specific conductance were measured using a temperature compensated probe and meter that was checked daily with a standard reference solution. Dissolved oxygen and ferrous iron measurements were made using CHEMetes colorimetric ampoules (manufactured by CHEMetrics, Inc., Calverton, Va.).
Quality-assurance measures used throughout the study include submitting about 15 percent of samples to the laboratory as quality-assurance samples, which are a combination of replicate and blank samples. Field instruments used in stream reconnaissance and execution of project objectives were calibrated daily with known standards, and temperature recording instruments used throughout the study were compared to standard thermometers during site visits.
The survival of fecal coliform and E. coli in freshwater river and creek sediments was evaluated using a microcosm designed to simulate field conditions of flowing water, diurnal sunlight, and constant water temperature. Field studies utilizing in-stream microcosm chambers were considered but determined to be impractical because sediments could not simultaneously be kept in direct contact with oxygenated streamflow and other conditions that would promote die-off fecal bacteria while at the same time be isolated from potential E. coli input from upstream sources. To the extent possible, the laboratory microcosm study simulated field conditions that promote die-off of fecal bacteria within the upper 2 cm of streambed sediments, including exposure to oxygenated streamflow, sunlight, and water temperature.
In the laboratory study, sediments and water from Fishtrap Creek were collected to construct a continuous flow-open system microcosm (fig. 3). A recirculating pump provided continuously flowing water of 1 L/min over a sediment bed that was 1 to 2 cm in depth. The microcosm was maintained at a constant water temperature (10°C) and exposed to artificial sunlight for 8 hr/d. Sediment samples for enumeration were a composite of six approximately 1 cm3 subsamples of sediment collected from a randomized grid across the microcosm. E. coli, pH, specific conductance, and dissolved oxygen were monitored in the water overlying sediments during the experiments. Additional details on the microcosm experiment are described in Defawe (2003).
Particle-bound bacteria were dissociated from sediment particles by sonication and enumerated using the membrane filter technique (American Public Health Association and others, 1998). In a series of tests, sonication alone produced the highest and most consistent enumeration results when compared to other procedures that included vortex or stomacher mixing with or without the use of a surfactant (Defawe, 2003). All laboratory equipment and flasks that contacted the sample were sterilized before use with either an autoclave or by soaking in 90 percent ethyl alcohol for 15 min. All samples were refrigerated and stored on ice until analysis within 24 hours of collection. For analysis, the sediment sample was first homogenized by stirring for 1 min. Then, a 10-percent mass/volume slurry was made with the sediment sample by adding 10.0 g of drained-wet sediment sample (weighed to ±0.01 g) to a glass Erlenmeyer flask containing 90.0 mL of sterile phosphate buffer. The flask was covered with aluminum foil. The flask was shaken briefly for 10 seconds and then immediately placed in an L&R Transistor/Ultrasonic T-14 sonication bath for 3.0 min. Large particles were allowed to settle out by waiting 2.0 min after sonication. After 2.0 min, the tip of the pipette was placed 2 cm below the surface and 10.0 mL was immediately transferred into a flask containing 90.0 mL of buffer. If necessary, additional 1 to 10 dilutions were made.
The membrane filtration method was used to enumerate coliform concentrations. The flask containing the sample to be filtered was shaken vigorously by hand for 10 seconds before each aliquot for enumeration was withdrawn from the flask. The diluted sample was then filtered onto a Whatman, 0.45-µm pore size, 47 mm diameter, white grid, cellulose nitrate membrane filter. However, if the 10-2 dilution was used, the liquid portion was poured off into another flask after the 2.0 min settling period and filtered. This step removed larger particles that would interfere with colony separation.
To ensure adequate bacteria counts, each sample was plated at two different filtration volumes and four replicates were prepared for each volume. Before filtering a sample, an estimate would be made as to which dilution of the sediment sample would produce between 20 and 80 CFU/mL. Four 5-mL aliquots of the dilution would be filtered onto individual filters; followed by an additional four 7-mL aliquots of the same dilution yielding eight agar plates per sample.
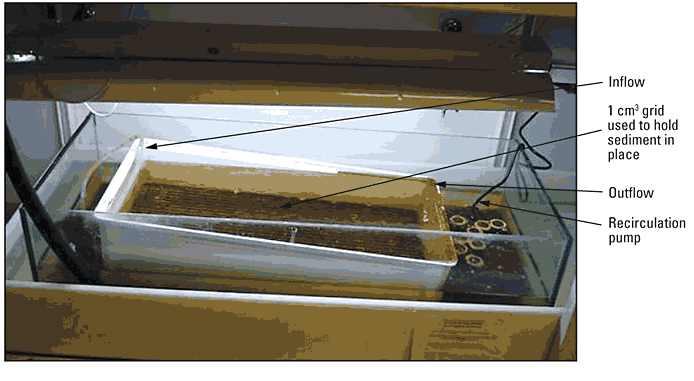
Figure 3. Microcosm chamber used in sediment bacteria attenuation study.
Bed sediment material was retained in place with at 1 cm3 plastic grid and continuous flow was maintained over the 1-2 cm thick bed sediment with a recirculating pump.
For more information about USGS activities in Washington, visit the USGS Washington Water Science Center home page .

![]() U.S. Department of the Interior |
U.S. Geological Survey
U.S. Department of the Interior |
U.S. Geological Survey
URL: https://
Page Contact Information:
Page Last Modified:
