Scientific Investigations Report 2006–5043
U.S. GEOLOGICAL SURVEY
Scientific Investigations Report 2006–5043
Data were collected from 2002 to 2004 to improve estimates of ET from phreatophytes along the LCR. Three stations were installed and instrumented at HNWR to collect ET data. ET is a process by which water from the Earth’s surface is transferred to the atmosphere; a process that requires energy to change water from a liquid state to a vapor state. As a result, any change in the rate of water loss by ET is reflected by a change in energy. This relation between water loss and energy consumption is the basis for many of the methods used to estimate ET rates.
ET rates were computed for 20-minute periods using the Bowen-ratio energy-budget method from averaged 20‑minute micrometeorological measurements (average of 10- or 30‑second measurements). Daily ET is the sum of 20-minute ET rates and monthly ET is the sum of daily ET.
Energy at the surface of the Earth can be described as a budget in which a balance is sought between the incoming and outgoing energy components (fig. 3). Terms related to the flux of energy can be expressed mathematically as (Stull, 1988):
 , (1)
, (1)
where

|
is net radiation (energy per time per area), |

|
is sensible-heat flux (energy per time per area), |

|
is subsurface-heat flux (energy per time per area), and |

|
is latent-heat flux (energy per time per area), |
where
 (energy per mass) (energy per mass) |
is latent heat of vaporization for water and is a function of air temperature, |
| (Joules/kg) |
equals [287.04*(6,788.6 – 5.0016* air temperature, in degrees Kelvin)]/0.622, |

|
is rate of mass flux of water vapor (mass per time per area). |
Net radiation is the principal term of the energy budget and provides energy to the remaining components of the budget at the Earth’s surface (eq. 1). It is the algebraic sum of incoming and outgoing long- and short-wave radiation (0.25–60 µm) and can be expressed as:
 , (2)
, (2)
where

|
is incoming |

|
is incoming |
Subsurface-heat flux is the amount of energy, originating from net radiation, which moves across the soil surface. This energy term has two distinct components: a soil-heat flux that is sampled at depth (![]() ) and a change in the stored energy between the Earth’s surface and
) and a change in the stored energy between the Earth’s surface and ![]() . This is expressed as:
. This is expressed as:
 , (3)
, (3)
where

|
is soil-heat flux sampled at depth |

|
is thickness of soil layer above |

|
is change in average soil temperature ( |

|
is soil-bulk density (mass per volume), |

|
is specific heat of dry soil (energy per mass per temperature), |

|
is volumetric soil-water content (dimensionless), |

|
is density of water (mass per volume), and |

|
is specific heat of water (energy per mass per temperature). |
Sensible-heat flux is the energy used to heat the air at the Earth’s surface and is proportional to the product of the air‑temperature gradient and the turbulent-transfer coefficient for heat; it can be expressed as:
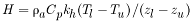 , (4)
, (4)
where

|
is density of dry air (mass per volume), |

|
is specific heat of dry air at a constant pressure (energy per mass per temperature), |

|
is turbulent-transfer coefficient of sensible heat (area per time), |

|
is temperature of air at lower ( |

|
is lower ( |
Latent heat is the energy that is stored in atmospheric water vapor. The energy used for ET is represented by a vertical change (or flux gradient) in the vapor pressure. Vapor pressure is calculated from air-temperature and relative‑ humidity measurements using an approximating polynomial for determining the vapor pressure over water (Lowe, 1977). In a flux-gradient format, the latent-heat flux is proportional to the product of the vapor-pressure gradient and the turbulent-transfer coefficient of water vapor and can be expressed as:
 , (5)
, (5)
where

|
is ratio of molecular weight of water vapor to dry air (dimensionless), |

|
is turbulent-transfer coefficient of water vapor (area per time), |

|
is ambient-air (barometric) pressure (force per area), and |

|
is vapor pressure at lower ( |
Because the turbulent-transfer coefficients of heat (![]() ) and vapor (
) and vapor (![]() ) cannot be determined directly (eqs. 4 and 5, respectively), an indirect method for solving the energy-budget equation was developed (Bowen, 1926). Bowen assumed that the turbulent-transfer coefficients essentially are equal during daytime heating conditions, thus
) cannot be determined directly (eqs. 4 and 5, respectively), an indirect method for solving the energy-budget equation was developed (Bowen, 1926). Bowen assumed that the turbulent-transfer coefficients essentially are equal during daytime heating conditions, thus ![]() and
and ![]() can be disregarded (ratio equals one) by taking the ratio of sensible‑heat flux (eq. 4) to latent-heat flux (eq. 5). This expression, known as the Bowen ratio, can be written as:
can be disregarded (ratio equals one) by taking the ratio of sensible‑heat flux (eq. 4) to latent-heat flux (eq. 5). This expression, known as the Bowen ratio, can be written as:
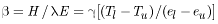 , (6)
, (6)
where

|
is the Bowen ratio (dimensionless), and |

|
is the computed |
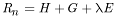
When the Bowen ratio is substituted into equation 1, latent-heat flux can be solved using:
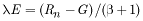 . (7)
. (7)
ET is the mass flux of water into the atmosphere and can be calculated with latent-heat flux as
 , (8)
, (8)
where ET is the rate of evapotranspiration (length per time). Substituting for ![]() with equation 7 evapotranspiration equals
with equation 7 evapotranspiration equals
 . (9)
. (9)
Thus, using equation 9, ET can be calculated with data that are measured directly, including net radiation, soil-heat flux, relative humidity, and air temperature and data that are derived from direct measurements, including air-vapor pressure, latent heat of vaporization, subsurface-heat flux, and psychrometric constant. Laczniak and others (1999) and DeMeo and others (2003) provide detailed explanations of this procedure.
The Bowen-ratio method, used in this study, assumes that turbulent fluxes are one dimensional; horizontal gradients of heat and that water vapor are negligible compared to the vertical gradient of respective components. Horizontal gradients of heat and water vapor can be minimized when the measured layer of air is at least 90 percent equilibrated with the vegetation being studied. This condition likely is satisfied when the fetch is 100 times the height of instrumentation (Campbell, 1977). Fetch is the distance that wind blows over a uniform surface. As wind travels over a uniform vegetation surface, a layer of modified air forms, with a thickness that increases with fetch. Generally, fetch is measured downwind from the edge of the uniform surface, such as, where there is a distinct change in vegetation type or density. However, in many phreatophyte areas the edge is diffuse, as changes in vegetation type and density occur gradually over a distance.
ET sites for this study were selected to maximize the fetch. Site selection also was based on the presence of vegetation that is representative of phreatophyte areas along the LCR. Physical access to the station and landowner permission for installing the stations also was considered during site selection.
ET stations were installed at three sites on the HNWR; one in a homogeneous stand of high-density saltcedar, a second in a stand of medium-density mixed vegetation, and a third in low-to-medium density arrowweed (fig. 2).
A saltcedar (SC) ET station was installed in an area of homogeneous saltcedar that exceeds 2,000 acres (fig. 2, table 3). The saltcedar area varies from medium-to-high density; however, with high-density saltcedar present near the SC station. Saltcedar near the station was 8–12 ft tall in May 2002 and grew to 10–12 ft by June 2004. Saltcedar grows vigorously during the spring and summer and is dormant in the winter. Most of the saltcedar surrounding the station was regrowth after a wildfire that occurred in July 1998 (Guay, 2001).
A mixed-vegetation (MV) ET station was installed in an area of medium-density phreatophytes that consist of screwbean mesquite, arrowweed, saltcedar, salt grass, baccharis, and sharp-leaved rush (fig. 2, table 3). The mesquite and sharp-leaved rush grew in small, dense stands; but the overall density of the fetch was medium. Except for arrowweed and baccharis, the vegetation that surrounds this station is dormant in winter.
An arrowweed (AW) ET station was installed in homogeneous, low-to-medium density arrowweed (fig. 2, table 3). The arrowweed was about 4–6 ft tall and appeared to be recovering from a wildfire that probably occurred in 1997, based on information that a nearby area had burned completely in that year (CH2MHILL, 1999, photograph 312–636.gif). Individual saltcedar and mesquite plants were a small percentage of the vegetative cover. Unlike saltcedar and mesquite; arrowweed does not go dormant in the winter.
The density descriptors of high, medium, and low used in this report are qualitative terms. That is, low-density vegetation has a relatively high ratio of bare soil to canopy cover and can be traversed easily without disturbing plants. Medium density vegetation has a lower ratio of bare soil to canopy cover and can be traversed only for short distances without disturbing plants. High-density vegetation has a low ratio of bare soil to canopy cover and cannot be traversed without disturbing plants. High-density vegetation along the LCR typically consists of homogeneous stands of saltcedar, mesquite, and occasionally arrowweed.
ET stations were not established to determine open-water or bare-soil evaporation, or aquatic vegetation ET. Evaporation from water bodies is significant (Bureau of Reclamation, 2004) and a separate study would be required to accurately evaluate open-water evaporation. ET from aquatic vegetation, or marshes, is significant only within the wildlife refuges along the LCR. Sufficient data are available, from previous USGS studies of phreatophytic ET in semi-arid environments (table 1), to estimate the annual ET from barren areas.
Three micrometeorological data-collection stations were established and instrumented in the Topock Marsh area of HNWR for periods of 1 or more years to document daily and seasonal fluctuation of ET (fig. 2). Micrometeorological and soil data needed to solve the energy-budget methods applied in this study require installation of a net radiometer, two air-temperature/relative-humidity probes (THPs) at two heights above the average vegetation canopy (1.6 and 4.9 ft), a directional anemometer, soil heat-flux plates, and subsurface soil-temperature and soil-moisture probes (fig. 4). All data were sampled at 10- or 30-second intervals and stored as 20-minute averages. The solution of the Bowen ratio requires accurate measurements of air-temperature and relative-humidity gradient above the vegetation canopy. Instrument bias may be introduced by using two different THPs to make the measurements. The error due to instrument bias was minimized by using an automatic exchange mechanism to alternate the positions of the THPs between reference heights (height of instrument) every 10 minutes.
In 1996, improvements were made to the ET method developed by the USGS for LCRAS (Jensen, 1998), whereby, crop and phreatophyte evapotranspiration (![]() ) is the product of daily reference ET (
) is the product of daily reference ET (![]() ) and a crop specific ET coefficient (
) and a crop specific ET coefficient (![]() ):
):
 . (10)
![]() is a function of spatial and temporal factors that control ET. The
is a function of spatial and temporal factors that control ET. The ![]() is a function of certain crop and phreatophyte properties, and reflects spatial (unique curve for specific crops and phreatophyte groups) and temporal (shape of curve) changes in those properties, whereas the daily
is a function of certain crop and phreatophyte properties, and reflects spatial (unique curve for specific crops and phreatophyte groups) and temporal (shape of curve) changes in those properties, whereas the daily![]() is a function of meteorological conditions.
is a function of meteorological conditions.
![]() is estimated for 11 nonaquatic phreatophyte groups and barren areas as part of LCRAS (table 4). The total area of phreatophytes for the Davis Dam to Parker Dam range from 452 acres for the cottonwood and willow (cw) group to 13,326 acres for barren areas.
is estimated for 11 nonaquatic phreatophyte groups and barren areas as part of LCRAS (table 4). The total area of phreatophytes for the Davis Dam to Parker Dam range from 452 acres for the cottonwood and willow (cw) group to 13,326 acres for barren areas.
LCRAS defines the barren group as an area with less than 10 percent of any vegetation (table 4). ET from barren areas is a function of depth to the water table (Jensen, 1998) and precipitation. For example, for bare-soil areas the estimated annual ET rate is 0.5 ft where the depth to the water table is 8.8 ft and only 0.33 ft where the depth to water is 10.8 ft (Jensen, 1998). Ground water rises slowly to the surface through capillary action and evaporates, or some ground water may be transported through the soil to the surface as vapor transport. Precipitation may evaporate directly from the surface of the ground or may infiltrate the soil, increasing soil moisture; ultimately, soil moisture is used by plants or evaporates at the soil surface.
LCRAS does not differentiate barren areas based on depth to water, although annual ET for barren soil is dependent on the depth to water. The LCRAS barren group includes areas where the water table is within the root zone, such as recently burned or mechanically cleared areas and abandoned fields, and areas where the depth to water is below the root zone, such as sand dunes and dredge piles where sparse communities of xerophytes or annual plants rely primarily on precipitation instead of ground water. Annual ET for barren areas where the depth to water is below the root zone would be limited by annual precipitation.
Coefficients typically are derived empirically from concurrent measurements of daily crop for specific crops and daily reference ET. Although ET coefficients have been derived in such a manner for different crop types in areas other than the LCR (Jensen, 1998), coefficients have not been empirically derived in such a manner for phreatophytes. Instead, Jensen (1998) correlated daily ET data for phreatophytes compiled from short-term ET studies conducted in the Southwestern United States with average daily reference ET from local meteorological stations operated by agencies and organizations of the States of Arizona and California.
Daily LCRAS ET coefficients (![]() ) are a function of a specific crop type or phreatophyte group (table 4) and time of year (fig. 5). That is, the coefficient depends on water availability, soil conditions, and vegetation characteristics, including the relative vegetation density, type of vegetation, and growth stage. For crops, the growth stage corresponds to the planting and harvest cycle; whereas for phreatophytes,
) are a function of a specific crop type or phreatophyte group (table 4) and time of year (fig. 5). That is, the coefficient depends on water availability, soil conditions, and vegetation characteristics, including the relative vegetation density, type of vegetation, and growth stage. For crops, the growth stage corresponds to the planting and harvest cycle; whereas for phreatophytes, ![]() corresponds with natural, seasonal growth stages of different vegetation (fig. 5). The maximum
corresponds with natural, seasonal growth stages of different vegetation (fig. 5). The maximum ![]() corresponds to a period when plants are vigorous, from mid-May until early October, whereas the minimum
corresponds to a period when plants are vigorous, from mid-May until early October, whereas the minimum ![]() corresponds to a period when many phreatophytes are dormant, from December through February. The coefficient gradually increases daily from March through mid-May as the vegetation transitions from dormancy to vigorous growth and gradually decreases daily from early October to December as plants transition from vigorous growth to dormancy or less vigorous growth. Generally, the maximum
corresponds to a period when many phreatophytes are dormant, from December through February. The coefficient gradually increases daily from March through mid-May as the vegetation transitions from dormancy to vigorous growth and gradually decreases daily from early October to December as plants transition from vigorous growth to dormancy or less vigorous growth. Generally, the maximum ![]() is positively proportional to the relative density of crops or phreatophytes.
is positively proportional to the relative density of crops or phreatophytes.
LCRAS ET coefficients were derived from existing ET data and represent average spatial and temporal conditions. Daily ET coefficients do not vary annually or among crops of the same type or among phreatophytes of the same group. Thus, methods using ![]() do not account for variability of plant growth and condition annually or the variability of vegetation condition and soil characteristic among the same crop types or phreatophyte groups.
do not account for variability of plant growth and condition annually or the variability of vegetation condition and soil characteristic among the same crop types or phreatophyte groups.
LCRAS ![]() for most nonaquatic phreatophytes undergo a significant percentage change from December (0.2) to the period January through early March (0.331); no biological or physical process would cause such a significant change from December 31 to January 1 (fig. 5).
for most nonaquatic phreatophytes undergo a significant percentage change from December (0.2) to the period January through early March (0.331); no biological or physical process would cause such a significant change from December 31 to January 1 (fig. 5).
The distribution of daily LCRAS barren ![]() is dependent on temporal changes in depth to water (fig. 6). The barren
is dependent on temporal changes in depth to water (fig. 6). The barren ![]() is low during the warm season and high during the cool season because the depth to water is relatively high in the warm season and relatively low in the cool season.
is low during the warm season and high during the cool season because the depth to water is relatively high in the warm season and relatively low in the cool season.
Daily ![]() is obtained from a network of meteorological stations that are in selected fields along the LCR in Arizona (Arizona Meteorological network) and California (California Irrigation Management Information System). Daily
is obtained from a network of meteorological stations that are in selected fields along the LCR in Arizona (Arizona Meteorological network) and California (California Irrigation Management Information System). Daily ![]() is computed separately for each reach of the LCR. Daily ET, computed for the Davis Dam to Parker Dam subreach, fluctuates greatly from day to day and year to year (fig. 7).
is computed separately for each reach of the LCR. Daily ET, computed for the Davis Dam to Parker Dam subreach, fluctuates greatly from day to day and year to year (fig. 7).
Reference ET stations are operated and maintained by agencies of the respective States. Information for the Arizona reference ET stations (AZMET) is available at http://ag.arizona.edu/AZMET/. Information for the California reference ET stations (CIMIS) is available at http://wwwcimis.water.ca.gov/cimis/welcome.jsp.
Since 1999, ![]() has been computed for both station networks (AZMET and CIMIS) using a standardized reference ET equation (Bureau of Reclamation, 2000). The standardized reference ET equation was developed to provide a standard method for determining reference ET (Environmental and Water Resources Institute of the American Society of Civil Engineers, 2002). The standardized reference ET equation is a modified version of a physics-based model that combines energy-budget and mass-transfer methods for determining the evaporation over open-water surfaces (Penman, 1948).
has been computed for both station networks (AZMET and CIMIS) using a standardized reference ET equation (Bureau of Reclamation, 2000). The standardized reference ET equation was developed to provide a standard method for determining reference ET (Environmental and Water Resources Institute of the American Society of Civil Engineers, 2002). The standardized reference ET equation is a modified version of a physics-based model that combines energy-budget and mass-transfer methods for determining the evaporation over open-water surfaces (Penman, 1948).
The standardized reference ET equation (eq. 11) is applied to adequately watered crops with extensive surfaces; which are crops that are irrigated frequently enough to avoid plant stress and which are large enough that the layer of air over the crop is equilibrated with the crop surface at the station (adequate fetch), regardless of wind direction (Allen and others, 1998). AZMET and CIMIS reference ET stations generally are in or adjacent to large, irrigated alfalfa fields (considered a tall crop for reference ET). The equation includes constants (![]() and
and![]() ) that are dependent on the reference crop type (short or tall), calculation time step, and whether data are computed for day or night:
) that are dependent on the reference crop type (short or tall), calculation time step, and whether data are computed for day or night:
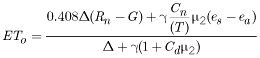 , (11)
where

|
is reference evapotranspiration (length per time), |

|
is mean daily wind speed (length per time), |

|
is mean daily or hourly air temperature (degrees Kelvin), |

|
is saturation vapor pressure (force per area), |

|
is atmospheric vapor pressure (force per area), |

|
is slope of vapor pressure curve (force per area per degree), |

|
is numerator constant for reference type and calculation time step (dimensionless), and |

|
is denominator constant for reference type and calculation time (dimensionless). |
Detailed guidelines for use and requirements of the standardized reference ET equation are presented by Allen and others (1998) in a Food and Agriculture Organization of the United Nations (FAO) publication. An electronic version of the FAO publication is available at http://www.fao.org/docrep/X0490E/x0490e00.htm#Contents (accessed May 19, 2005). A condensed version is available at http://www.kimberly.uidaho.edu/water/asceewri/main.pdf (accessed May 19, 2005).
Changes in weather conditions that affect ET are accounted for in the LCRAS method by meteorological measurements that are used to compute ![]() (eq. 11). However, an adequate fetch of specified crop type (typically alfalfa) is required for the standardized reference ET equation. The fetch may be affected by crop fallowing or harvesting or rotation of nearby fields, which in turn, may affect the computed
(eq. 11). However, an adequate fetch of specified crop type (typically alfalfa) is required for the standardized reference ET equation. The fetch may be affected by crop fallowing or harvesting or rotation of nearby fields, which in turn, may affect the computed ![]() . Because fetch is dependent on wind direction, the resulting estimated ET also is dependent on wind direction. In addition, large daily fluctuations in
. Because fetch is dependent on wind direction, the resulting estimated ET also is dependent on wind direction. In addition, large daily fluctuations in ![]() may be associated with periodic flood-irrigation of nearby fields, which could affect the measured properties at a station. In comparison, large daily fluctuations are not typical of ET estimated using the Bowen-ratio method. Moreover, phreatophyte areas are not affected similarly by the periodic application of irrigation water. For the reach of the LCR between Davis Dam and Parker Dam, daily
may be associated with periodic flood-irrigation of nearby fields, which could affect the measured properties at a station. In comparison, large daily fluctuations are not typical of ET estimated using the Bowen-ratio method. Moreover, phreatophyte areas are not affected similarly by the periodic application of irrigation water. For the reach of the LCR between Davis Dam and Parker Dam, daily ![]() is for one AZMET reference station (Mohave 1) in 2002, but is the average of two AZMET reference stations (Mohave 1 and Mohave 2) in 2003 and 2004 (U.S. Bureau of Reclamation, 2004, p. 20).
is for one AZMET reference station (Mohave 1) in 2002, but is the average of two AZMET reference stations (Mohave 1 and Mohave 2) in 2003 and 2004 (U.S. Bureau of Reclamation, 2004, p. 20).
For more information about USGS activities in Nevada, visit the USGS Nevada Water Science Center home page .

![]() U.S. Department of the Interior |
U.S. Geological Survey
U.S. Department of the Interior |
U.S. Geological Survey
Persistent URL: https://pubs.water.usgs.gov/sir20065043
Page Contact Information: Publications Team
Page Last Modified: Thursday, 01-Dec-2016 18:55:52 EST
