Scientific Investigations Report 2012–5231
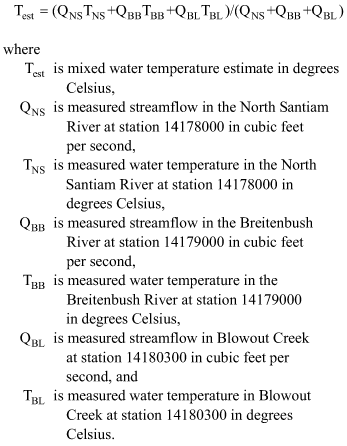
MethodsFlow and Temperature ModelsThree separate CE-QUAL-W2 models were used in this study to simulate Detroit Lake, Big Cliff Reservoir, and the North Santiam and Santiam Rivers. All of the model scenarios presented in this report were simulated using the Detroit Lake model, but only some of these scenarios were run with the downstream models of Big Cliff Reservoir and the North Santiam and Santiam Rivers. Detroit Lake and the Custom Blending RoutineThe CE-QUAL-W2 version 3.12 model of Detroit Lake was developed originally by Sullivan and others (2007) for conditions that occurred primarily in 2002 and 2003 when the primary outlet structure was the power penstocks. Since 2007, typical operations at Detroit Dam include releases through the power penstocks as well as seasonal usage of the spillway (during summer) and the upper ROs (during autumn) for downstream temperature management. To ensure that the previously calibrated model accurately represented these new dam operations, the Detroit Lake model calibration was checked and updated using conditions from calendar year 2011 before it (the Detroit Lake model) was applied to the other scenarios of this project. See appendix B for a description of model performance and slight alterations in the calibration for 2011. In general, the model was accurate in its depiction of 2011 in-lake vertical temperature profiles and release temperatures, with mean errors showing a slight negative bias, but within 0.5°C, and mean absolute errors less than about 0.8°C for the profiles and about 0.9°C for the releases, in good agreement with previously documented model performance for Detroit Lake (Sullivan and others, 2007). The previously developed Detroit Lake model used in this study already included a custom subroutine designed to optimize releases from a set of user-specified outlets to meet a downstream temperature target (Rounds and Sullivan, 2006; Sullivan and Rounds, 2006). The user specifies the total release rate time series for a group of potential outlets along with a time series of desired temperature releases. The subroutine then selects two outlets from among the group of usable outlets, and determines the optimal release rates from those outlets that are required to match the user-specified downstream temperatures. The blending algorithm allows the user to specify several types of outlets, including floating, sliding-gate (variable-elevation), and fixed-elevation outlet structures. For this study, the custom blending algorithm was further modified and improved in several ways. First, the user can specify that a minimum fraction of the total releases be assigned to a particular outlet. This allows, for example, the user to specify that at least 40 percent of the releases from Detroit Dam go through the powerhouse. That capability was used in several of the scenarios in this study. Second, a minimum release rate also can be assigned to a particular outlet. In this study, this feature was used to set a minimum release rate of 400 ft3/s from a hypothetical floating outlet. Third, the user can specify a priority ranking for each of the outlets in an outlet group, such that one outlet is preferred for releases when (1) the lake is isothermal and the choice of outlet has little to no effect on release temperatures, or (2) the minimum flow fraction or minimum release rate criteria are in conflict. The priority ranking allows the user to assign more flow to power generation, for example, when the lake is isothermal. Finally, the blending algorithm itself was improved, incorporating an iterative solution method that greatly improved the algorithm’s ability to match the user-specified temperature target. Because the release temperature from each outlet is a function of flow, an iterative process is required to find the best combination of flows from two different outlets to match the downstream temperature target. These updates to the blending subroutine require two new input parameters in the model control file, one for the minimum fraction (0 to 1) or minimum release rate (input as a negative number), and a second for the priority ranking. The code changes and updates are described in appendix C. The code changes were meant to be as general as possible, but in this study it was not necessary to specify more than two available outlets at any time. The algorithm for choosing two outlets from among a group of more than two available outlets was not updated to use the priority ranking or the minimum fraction or flow release criteria. Big Cliff ReservoirThe customized version 3.12 CE-QUAL-W2 executable used for the Detroit Lake temperature model also was used for the Big Cliff Reservoir model. Big Cliff Reservoir is a small reregulating reservoir just downstream of Detroit Dam, and its operation has a small effect on water temperature at some times of the year. The development of the Big Cliff model is discussed in more detail in appendix A. North Santiam/Santiam RiverThe CE-QUAL-W2 model used to simulate streamflow and water temperature in the North Santiam and Santiam Rivers from Big Cliff Dam (river mile [RM] 58.1) to the Willamette River confluence was constructed and calibrated in a previous study to support the Willamette River water-temperature Total Maximum Daily Load (TMDL) process (Sullivan and Rounds, 2004). That study relied on version 3.12 of CE-QUAL-W2 but included some customized outputs to help compute water-temperature statistics for the TMDL work. The same model version and configuration used in the previous study was applied in this study. The model grid consisted of 1 water body, 6 branches, and 310 segments extending over approximately 58.1 mi of the North Santiam and Santiam Rivers (fig. 3). A further description of the methods and assumptions involved in setting up and applying this model is in appendix D. Some of the model scenarios included in this study resulted in temperature releases from Detroit Dam that were either not very successful in matching the intended downstream target or closely matched those of another scenario. Appendix E provides documentation for that set of model scenarios. Environmental ScenariosThree distinctly different environmental forcing scenarios—streamflow input, temperature inflow, and weather conditions—were developed to evaluate temperature management operations and structural options at Detroit Dam. To ensure that the streamflow, water temperature, and meteorological datasets used to drive the models were consistent with one another, the simplest approach was to use historical datasets that represented a wide range of possible conditions, from cold and wet to normal to warm and dry. The historical data were analyzed based primarily on the assumption that streamflow, along with meteorological conditions, is one of the most important factors influencing stream temperatures in Detroit Lake, Big Cliff Reservoir, and the North Santiam River. In many years, above‑average streamflow (driven by snowmelt) during April– June can translate into above-average streamflow during July– September; therefore, the timing of runoff from snowmelt and precipitation may affect midsummer temperatures, and the development of these environmental forcing scenarios must take this relationship into account. Because streamflow and water temperature typically exhibit less year-to-year variability in late summer (August– September) prior to the autumn rainy season, and because years with a wet winter and spring do not necessarily have a wet autumn, the historical data were divided and analyzed in two periods: “winter–summer” (January– September) and “autumn” (October–December). In this way, measured data from a year with a dry (or wet) winter–summer could be concatenated with measured data from a year with a dry (or wet) autumn, producing a more-or-less uniformly dry (or wet) environmental scenario for modeling that has streamflow, water-temperature, and meteorological data that are consistent with one another. Dividing the year at the beginning of October not only made it easier to splice and transition model input data from separate years, but also takes advantage of the fact that autumn streamflow conditions, once the rainy season begins, are largely independent of the snowpack from the preceding winter and spring. To select scenarios with the most realistic range in possible streamflow and water temperature throughout the year, a method was devised to rank 10 recent years in which adequate streamflow, water-temperature, and meteorological data were available (2000–2009), using monthly mean flow and temperature data from the North Santiam River below Boulder Creek site upstream of Detroit Lake (USGS site 14178000). In order to avoid a high-flow bias in the monthly flow comparisons, the monthly streamflow was log-transformed prior to computing a difference between each month’s flow and the long-term monthly median streamflow. This method allows the low-flow months to be compared more equally with high-flow months, and the differences between years can be assessed more clearly. To rank a group of months in each year, the sum of the differences between the log-transformed monthly mean streamflow and the log-transformed median of the monthly mean streamflow over the entire period of record (1929–2009) was computed and compared for the years 2000–2009. Results for the January–September and October–December time frames are shown in table 1. The same procedure was applied to stream temperature data from the same site using a historical period of record of 1975–2009. This ranking procedure was used to guide further exploration of the hydrologic conditions that occurred in each year. The rankings in table 1 and a visual comparison of the monthly data were used to develop three scenarios representing cool/wet, normal, and hot/dry conditions based primarily on the rankings for streamflow. For example, the normal scenario was created by concatenating data from January 1 to September 27, 2006, with data from September 27 to December 31, 2009 (table 2). Concatenation dates in table 2 were selected based on the day in which streamflow and meteorological conditions closely matched in the 2 years of interest. Streamflow and stream temperature during the three selected scenarios (cool/wet, normal, and hot/dry) are shown in figures 4 and 5. Because a large amount of variation in streamflow historically occurs during January to September, the three “winter–summer” scenarios were differentiated primarily by the quantity of streamflow occurring during the spring snowmelt period. Together, the three environmental forcing scenarios span more than the 25th–75th percentiles (interquartile range) of the historical data and do not exceed the 10th or 90th percentiles (the central 80 percent of the data used to indicate skewness) of streamflow and temperature. These environmental scenarios, therefore, encompass much of the typical variability in streamflow and water temperature, but without including rare and extreme hydrologic conditions. Most importantly, the normal scenario is very near the median streamflow for much of the year aside from January, March, and December. Streamflow under the hot/dry scenario is near the 25th percentile for the entire year, whereas monthly mean stream temperature is above the median for the entire year except for October and November. The result is a warm and dry scenario. Aside from February and October, monthly mean streamflow under the cool/wet scenario is above the median for the entire year. Interestingly, the extremely high flows occurring during autumn of the cool/wet scenario correspond to above average stream temperatures (probably due to direct rainfall-runoff), whereas the high flows occurring earlier in the year produced below average stream temperatures (probably due to snowmelt). These results confirm the dependence of North Santiam River stream temperatures on snowmelt from the Cascade Range. Farther downstream, however, river temperatures will depend greatly on dam operations and meteorological conditions. Without-Dam Water Temperature EstimationHourly water temperatures for the North Santiam River at Detroit Dam (RM 60.9) were estimated for a “no-dams” scenario, in which Detroit Dam does not exist, for the hot/dry, normal, and cool/wet environmental scenarios. The estimates were computed using a simple mass and energy balance approach combined with a nominal downstream warming rate applied during summer, following methods documented by Rounds (2010). Although a simple one-dimensional model could have been constructed and applied to estimate without-dam water temperatures, a rigorous model was not necessary because these estimates were used only to provide a context for the results of the larger study. With a maximum estimated error of 0.5–0.8°C (Rounds, 2010) over a relatively short 9-mi reach, the simple mass and energy balance method also is likely to be just as accurate and much easier to develop and apply than a one-dimensional model. The mass and energy balance method was relatively easy to apply because the three major streams entering Detroit Lake have continuous data collection for both streamflow and water temperature during the period 2000–11. Monitoring sites on these three streams are the North Santiam River below Boulder Creek near Detroit (station 14178000), Breitenbush River above French Creek near Detroit (station 14179000), and Blowout Creek near Detroit (station 14180300) (see fig. 1). Applying a mass and energy balance to mix these threes streams together produces the following equation:
These hourly water-temperature estimates then were adjusted to account for the instream warming that may occur as water traverses the 9-mi reach between the upstream end of Detroit Lake (where the three tributaries were assumed to join and mix) and Detroit Dam. From November 1 to April 13, or any time of the year when water temperatures were less than 6°C, no adjustments were made to the hourly water temperature estimates. From April 14 to October 31, a downstream warming rate was applied as a function of the mixed temperature estimate, based on an assumption that warmer water was an indication of conditions that were favorable for some warming. All hourly water temperature estimates greater than 14°C were increased by 0.99°C to account for a nominal maximum downstream warming rate of 0.11°C/mi over the 9-mi reach. This maximum downstream warming rate was based on historical data (Moore, 1964, 1967) as well as previous water-temperature modeling in the North Santiam River in the 4 mi just downstream of Big Cliff Dam (Rounds, 2010). Water-temperature estimates less than 14°C but greater than 6°C were increased to account for some downstream warming, but less than the maximum rate of 0.11°C/mi, using the following linear interpolation:
where Tfinal is the final interpolated water temperature estimate in degrees Celsius. These without-dam water-temperature estimates for the three environmental scenarios show a more “natural” seasonal temperature pattern that peaks in July or August, in contrast to the pre-2007 downstream temperature peak in September or October (fig. 6). The contrast in the seasonal temperature pattern is more evident in the hot/dry and normal environmental scenarios because the measured downstream temperatures at the Niagara gage (USGS station 14181500) for those scenarios came primarily from years prior to the operational changes that occurred in 2007 to more actively manage the temperature releases from Detroit Dam. The difference is less evident for the cool/wet environmental scenario because reservoir operations through September in that scenario were different and were influenced by a desire to better manage downstream temperatures. A comparison of mean annual water temperatures with or without the dams showed a negligible difference (less than 0.5°C, table 3). Therefore, the main effect of the dams is to change the seasonal pattern in downstream temperatures and the timing and magnitude of the annual maximum and minimum, rather than to increase or decrease temperatures overall. Temperature TargetsTemperature targets for reservoir releases were previously developed and used by USACE for the McKenzie River system downstream of another dam (Cougar Dam on the South Fork McKenzie River) to support a restoration of uses by endangered fish (U.S. Army Corps of Engineers, 2012). Because no fish-based reservoir release targets had been developed for the North Santiam River, and because the endangered fish species are similar in the two systems, the McKenzie River temperature targets were applied in this study. ODEQ had developed some temperature targets for reservoir releases as part of the Willamette River water-temperature TMDL (Oregon Department of Environmental Quality, 2006), but those targets were based on an analysis of the historical data rather than the needs of the fish. Similarly, the maximum temperature criteria embedded in Oregon’s temperature standard, while meant to be protective for fish, include less seasonal variation than the USACE targets. Therefore, using the USACE targets seemed to be a reasonable choice. Although the USACE temperature targets include both a minimum and maximum monthly value for much of the calendar year, only the maximum values were used for the majority of model runs in this study (scenario names include “max” to denote this practice). Estimated without-dam water temperatures at the Detroit Dam site also were used as temperature targets for selected model scenarios. Using the without-dam temperatures as release targets provided a way to measure the ability of changes in dam operations or alterations in dam outlets to match temperatures that might exist in the absence of Detroit Dam. The estimated without-dam water temperatures were applied as release targets in model scenarios only after first computing the 7dADM—the statistic used in Oregon’s temperature standard. That computation removed much of the daily variation in the without-dam temperature estimates, thus making them more useful as release targets. Model scenarios using these targets are named with “w/o_dams7dADM” to denote this target. Model Setup and UsageDam Outflow EstimationDetroit DamPrior to running the Detroit Lake model to simulate operational and structural scenarios at Detroit Dam, the previously developed USGS Detroit Lake model was set up and its calibration checked using measured inflows, outflows, and weather conditions for the entire calendar year of 2011 (see appendix B) and from January 1 to August 30 in each environmental scenario. The only adjustments to the calibrated model parameters from the original model were (1) an additional spillway outlet was added as a “LINE” type structure with a model “WIDTH” of 25 m (82 ft) and an elevation (STR ELEV) of 469.7 m (1,541 ft), and (2) a minor change was made to the wind-sheltering coefficients to better reflect the distribution of wind speed across Detroit Lake. Wind sheltering was decreased from 1.0 to 0.9 and increased from 1.0 to 1.2 for model segments upstream and downstream of the Blowout Creek arm of the lake (model segment 21), respectively. After the model was set up for each environmental scenario, the difference between measured and modeled forebay elevations in the lake was used to determine the quantity of ungaged inflows and outflows for the lake. An additional model input known as the distributed tributary was created to account for any unmeasured overland flows, evaporation, or groundwater flux not accounted for by other boundary conditions, serving to balance the water budget for the lake. This method worked for the period from January 1 to the concatenation date of the environmental scenario because measured inputs and a corresponding measured lake level were available. From the concatenation date to December 31, however, the environmental scenario switched to inflows from a different year, making measured lake level comparisons impossible. Therefore, a proportion of the inflow from each tributary was used to estimate the magnitude of the distributed tributary from the concatenation date to December 31 of each environmental scenario. Following the water balance calibration, certain scenarios required that the total release rates (outflows) from Detroit Dam met the following conditions:
In reality, “power peaking” pertains only to the power penstock outlets; however, to enable the blending subroutine in CE-QUAL-W2 to determine the optimum balance of releases to meet downstream temperature targets, all outlets had to be placed on this flow schedule and used concurrently. Such concurrent releases might not reflect actual future operations, and the timing of releases (concurrent versus staggered) can have an effect on daily temperature variations immediately downstream; therefore, more detailed modeling may be required to optimize actual dam operations once a reasonable scenario is selected. The power peaking schedule was used only on days in which the daily average release rate was less than 2,472 ft3/s (70 m3/s). This rule helped ease the water balance of the downstream Big Cliff Reservoir model and came closer to the way in which Detroit Dam is operated during large storm events. For the “existing” structural scenario group (use of existing outlets), the computed total release rate was distributed among the available outlets. During times in which the forebay elevation in Detroit Lake was computed to be above the spillway, the total outflow was routed to the spillway and power penstocks, a combination that allows access to warm water near the lake surface (spillway) and cooler water at depth (power penstocks), thus achieving a blend of releases that is best positioned to meet the specified temperature target. When the elevation in the lake was computed to fall below the spillway crest, the only available outlets at Detroit Dam were the power penstocks and the upper ROs. The lower ROs are located below the power penstocks and upper ROs, but usage of those outlets may only be possible at extremely low lake levels and was not assessed in this study. Under the “base” operational scenario group, the rules for dam releases that are currently in use by USACE were applied to each environmental scenario. Big Cliff DamTo simulate outflows at Big Cliff Dam that closely approximated reality and balanced inflows with outflows for Big Cliff Reservoir under a range of conditions, a method of estimating outflows at Big Cliff Dam was developed. The outflow at Big Cliff Dam was assumed to be a moving daily average of the outflow rate from Detroit Dam. The upper and lower bounds of the pool elevation in Big Cliff Reservoir (1,182 and 1,194 ft) made it necessary to add a substantial distributed tributary inflow to the Big Cliff model that accounted for several tributary inflows and balanced inflows with outflows while adhering to these narrow elevation bounds. Initially, a distributed tributary flow rate was calculated by the hourly difference between the calculated outflow from Big Cliff Dam (as described in the previous sentence) and the total inflows to Big Cliff Reservoir. An iterative process then was used to adjust this distributed tributary based on the difference between subsequent modeled water-level elevations and a mean pool elevation of 1,188 ft. This resulted in simulations of Big Cliff Reservoir that both resembled current operating elevation rules and led to simulations with a relatively constant pool elevation (further discussion in appendix B). The simulated temperatures from the Big Cliff Reservoir model under these operating rules was assessed by a comparison to measured vertical profiles of water temperature from a thermistor string in Big Cliff Reservoir and a comparison of simulated outflow temperatures to measured temperatures at the streamgage downstream of Big Cliff Dam at Niagara (USGS gaging station 14181500) during 2011 (further discussion in appendix B). Meteorological InputsHourly meteorological input data required for CE-QUAL-W2 include air temperature, dew-point temperature, wind speed, wind direction, short-wave solar radiation, and cloud cover. The same meteorological data in a particular environmental scenario were used as input to all three models of Detroit Lake, Big Cliff Reservoir, and the North Santiam/Santiam River. Air temperature, relative humidity, wind speed, and wind direction data were measured hourly at a Remote Automated Weather Station (RAWS) site near Stayton, Oregon (44° 45’ N, 122° 52’ W, 155-m [509 ft] elevation). Hourly short-wave solar radiation data were obtained from the University of Oregon’s Solar Radiation Monitoring Laboratory (SRML) at their Eugene monitoring station (44° 2’ 60” N, 123° 4’ 12” W, 150 m [492 ft] elevation). Daytime cloud-cover data were estimated by comparing computed theoretical solar radiation rates with measured solar radiation rates as described by Sullivan and Rounds (2004). Nighttime cloud-cover data were interpolated from cloud-cover estimates at sunset on one day to corresponding estimates at sunrise on the following day. Detroit Dam Scenarios and Naming ConventionA range of model scenarios at Detroit Dam were explored to evaluate the potential downstream temperature impacts of altered dam operations as well as hypothetical structural changes at Detroit Dam. Hypothetical dam operation scenarios were developed to evaluate the effects of (1) altering the lake level in autumn (early or delayed drawdown to make room for flood storage), which often necessitated some change to the minimum recommended release rates, and (2) placing specific minimum flow constraints on selected outlets to achieve certain outcomes such as a minimum amount of power generation (table 5). In order to change the seasonal pattern or schedule of lake-level elevations, summertime minimum releases from Detroit Dam had to be decreased to varying degrees (table 4). The set of structural scenarios included the existing outlets as well as the use of new floating (at a fixed depth) or sliding-gate (variable-elevation) outlets either alone, together, or in combination with an existing fixed-elevation outlet (table 6). Selected operational scenarios were combined with selected structural scenarios, projected onto the three environmental forcing conditions (cool/wet,normal, and hot/dry)and given a set of temperature target requirements to produce the model scenarios of interest (table 7). The combination of these four conditions—operational scenario, structural scenario, environmental scenario, and temperature target—fully describes the major differences between the model scenarios and provides a consistent naming convention. |
First posted October 30, 2012 For additional information contact: Part or all of this report is presented in Portable Document Format (PDF); the latest version of Adobe Reader or similar software is required to view it. Download the latest version of Adobe Reader, free of charge. |

![]() U.S. Department of the Interior |
U.S. Geological Survey
U.S. Department of the Interior |
U.S. Geological Survey
URL: http://pubsdata.usgs.gov/pubs/sir/2012/5231/section3.html
Page Contact Information: GS Pubs Web Contact
Page Last Modified: Tuesday, 11-Jun-2013 17:19:12 EDT

 (1)
(1)
 (2)
(2)