USGS Surface Water Information
Prediction of Traveltime and Longitudinal Dispersion in Rivers and Streams
by Harvey E. Jobson
USGS, Water Resources Division
415 National Center
Reston, VA 20192
Internet: hejobson@usgs.gov
Phone: (703) 648-5224
FAX: (703) 648-5295
| Multiply Metric unit | By | To obtain inch-pound unit |
|---|---|---|
| kilogram (kg) kilometer (km) kilometer2 (km2) liter (L) meter (m) meter3 per second (m3/s) milligrams (mg) |
2.205 0.6214 0.3861 0.2642 35.31 2.204x10⁻⁶ |
pound avoirdupois (lb avdp) mile (mi) mile2 (mi2 gallon (gal) foot (ft) foot3 per second (ft3/s) pound (lb) |
Measured tracer-response curves produced from the injection of a known quantity of soluble tracer provide an efficient method of obtaining the necessary data. The purpose of this report is to use previously presented concepts along with extensive data collected on time of travel and dispersion to provide guidance to water-resources managers and planners in responding to spills. This is done by providing methods to estimate (1) the rate of movement of a contaminant through a river reach, (2) the rate of attenuation of the peak concentration of a conservative contaminant with time, and (3) the length of time required for the contaminant plume to pass a point in the river. Although the accuracy of the predictions can be greatly increased by performing time-of-travel studies on the river reach in question, the emphasis of this report is on providing methods for making estimates where few data are available.
Results from rivers of all sizes can be combined by defining the unit concentration as that concentration of a conservative pollutant that would result from injecting a unit of mass into a unit of flow. Unit-peak concentrations are compiled for more than 60 different rivers representing a wide range of sizes, slopes, and geomorphic types. Analyses of these data indicate that the unit-peak concentration is well correlated with the time required for a pollutant cloud to reach a specific point in the river. The variance among different rivers is, of course, larger than for a specific river reach. Other river characteristics that were compiled and included in the correlation included the drainage area, the reach slope, the mean annual discharge, and the discharge at the time of the measurement. The most significant other variable in the correlation was the ratio of the river discharge to mean annual discharge.
The prediction of the traveltime is more difficult than the prediction of unit-peak concentration; but the logarithm of stream velocity can be assumed to be linearly correlated with the logarithm of discharge. More than 980 subreaches for about 90 different rivers were analyzed and prediction equations were developed based on the drainage area, the reach slope, the mean annual discharge, and the discharge at the time of the measurement. The highest probable velocity, which will result in the highest concentration, is usually of concern after an accidental spill. Therefore, an envelope curve for which more than 99 percent of the velocities were smaller was developed to address this concern.
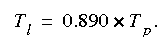
The time of arrival of the leading edge of the pollutant indicates when a problem will first exist and defines the overall shape of the tracer-response function. The traveltime of the leading edge is generally about 89 percent of the traveltime to the peak concentration.
The area under a tracer-response function (a known value when unit concentrations are used) can be closely approximated as the area under a triangle with a height of the peak concentration and a base extending from the leading edge to a point where the concentration has reduced to 10 percent of the peak. Knowing the time of the leading edge and the peak, the peak concentration, and the time when the response function has reduced to 10 percent of its peak value allows the complete response function to be sketched with fair accuracy.
Four example applications are included to illustrate how the prediction equations developed in this report can be used either to calibrate a mathematical model or to make predictions directly.
Traveltime and mixing of water within a stream are basic streamflow characteristics that water-resources managers and planners should understand in order to predict the rate of movement and dilution of pollutants that may be introduced into streams. Mean velocities and mixing characteristics for a wide range of flows are basic data needed to address all of these concerns.
With the widespread availability of computers today, it is natural to think of numerical models as a means of answering these questions. Although many excellent models are available to make the types of calculations needed, none can be used with confidence before calibration and verification to the particular river reach in question. That is to say, all models must be provided with information from which flow velocities and mixing rates can be computed. In general there are no reliable methods of predicting dispersion coefficients (mixing rates) from commonly available hydraulic information. Stream velocities, typically predicted by use of a flow model, generally require very detailed channel geometry and flow resistance coefficients, which are seldom available. The availability of reliable input information is, therefore, almost always the weakest link in the chain of events needed to predict the rate of movement, dilution, and mixing of pollutants in rivers and streams.
Soluble tracers can be used to simulate the transport and dispersion of solutes in surface waters because they have virtually the same physical characteristics as water (Feurstein and Selleck, 1963; Smart and Laidlaw, 1977). This is the case in either a steady flowing river or in the unsteady oscillatory stage and flow of a tidal estuary. Measured tracer-response curves produced from the injection of a known quantity of soluble tracer provides an efficient method of obtaining the data necessary to calibrate and verify pollutant transport models. These data can also be used, in conjunction with the superposition principle, to simulate potential pollution buildup in streams, lakes, and estuaries without the need to use numerical models.
Extensive use of fluorescent dyes as water tracers to quantify the transport and dispersion in streams and rivers began in the United States in the early to mid-1960's. Kilpatrick (1993), using the concept of unit-peak concentration and the superposition principle, illustrated how these data, obtained in the time-of-travel studies, could be generalized to a wide range of flow conditions and even to other sites.
In this report, the concepts presented by Kilpatrick (1993), along with extensive data collected by the U.S. Geological Survey on time of travel and dispersion, are used to provide guidance to water-resources managers and planners in responding to spills. This will be done by providing methods to estimate (1) the rate of movement of a solute through a river reach, (2) the rate of attenuation of the peak concentration of a conservative solute with time, and (3) the length of time required for the solute plume to pass a point in the river. It will be shown how these estimates can be used alone to make the required predictions. In addition, they are precisely the data required to calibrate or verify pollutant transport models. The accuracy of these predictions will be greatly increased by performing time-of-travel studies on the river reach in question; but the emphasis of this report is on providing methods for making estimates in rivers where few data are available. Large fluctuations in the flow rates of the rivers during the downstream movement of a solute would cause significant differences between actual and predicted traveltimes. These cases can best be interpreted by use of numerical models. Traveltime and concentration attenuation of pollutants not dissolved in the water are beyond the scope of this report.
The report begins with a short discussion of the theory of movement and dispersion of dissolved pollutants and introduces the unit-peak concentration concept. A brief summary of the methods used to collect time-of-travel information is then given along with a summary of the data used in the report. Methods are recommended for estimating the rate of movement and attenuation of conservative pollutants based on an analysis of the data. The application of these results is then illustrated by use of three examples. The report concludes by introducing the superposition principle and illustrates its purpose by use of an example.
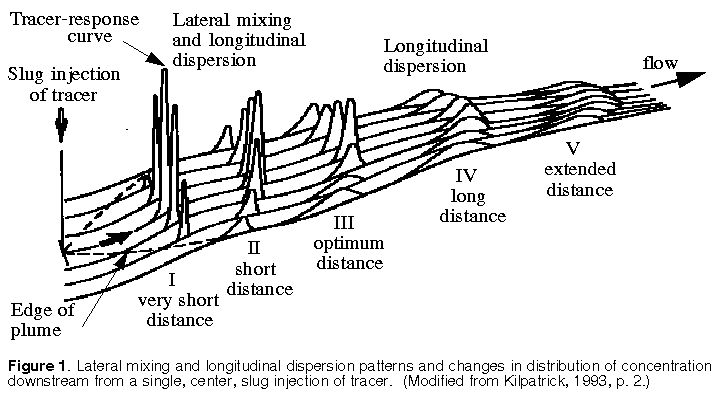
The dispersion and mixing of a tracer in a receiving stream take place in all three dimensions of the channel (fig. 1). In this report, vertical and lateral diffusion will be referred to in a general way as mixing. The elongation of the tracer-response cloud longitudinally will be referred to as longitudinal dispersion. Vertical mixing is normally completed rather rapidly, within a distance of a few river depths. Lateral mixing is much slower but is usually complete within a few kilometers downstream. Longitudinal dispersion, having no boundaries, continues indefinitely. In other words, vertical mixing is likely to be complete at section I in figure 1, which is a very short distance downstream of the injection. At section II lateral mixing is still taking place rapidly, so mixing and dispersion are both significant processes between the injection and section III on figure 1. Downstream of section III the dominant mixing process is longitudinal dispersion, so the tracer concentration can generally be assumed to be uniform in the cross section.
For a midpoint injection, the tracer cloud moves faster than the mean stream velocity upstream of section III because the bulk of the tracer is in the high velocity part of the cross section. Preferably, all measurement cross sections for a time-of-travel study are at least as far downstream as the optimum distance (section III in fig. 1) so that longitudinal dispersion is the dominant process acting between measurement cross sections and so the tracer moves downstream at the mean stream velocity.
The conventional manner of displaying the response of a stream to a slug injection of tracer is to plot the variation of concentration with time (the tracer-response curve) as observed at two or more cross sections downstream of the injection, as illustrated on figure 2. The tracer-response curve, defined by the analysis of water samples taken at selected time intervals during the tracer-cloud passage is the basis for determining time-of-travel and dispersion characteristics of streams. A detailed explanation of the analysis and presentation of time-of-travel data are covered in the report by Kilpatrick and Wilson (1989).
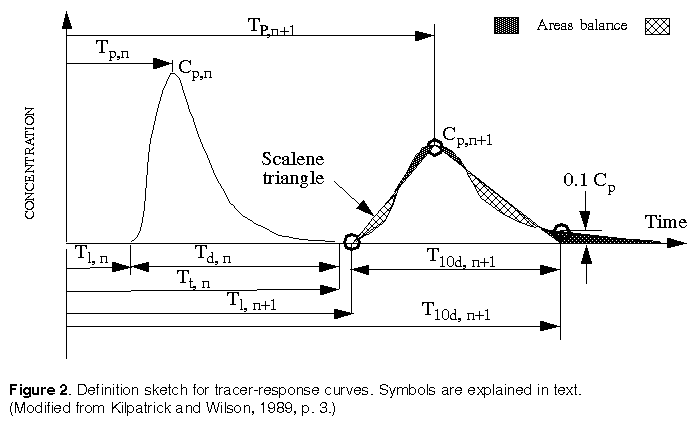
The characteristics of the tracer-response curves shown in figure 2 are described in terms of elapsed time after an instantaneous tracer injection:
Cp, peak concentration of the tracer cloud;
Tl, elapsed time to the arrival of the leading edge of a tracer cloud at a sampling location;
Tp, elapsed time to the peak concentration of the tracer cloud;
Tt, elapsed time to the trailing edge of the tracer cloud;
Td, duration of the tracer cloud (Tt-Tl);
T10d, duration from leading edge until tracer concentration has reduced to within 10 percent of the peak concentration; and
n, number of sampling site downstream of injection.
The mass of tracer to pass a cross section, Mr, is computed as:
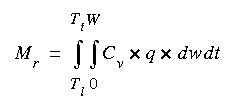 (eqn 1)
where W is the total width of the river, Cv is the vertically averaged tracer concentration, and q is the unit discharge (discharge per unit width). Both Cv and q are given at time t and distance w from one bank. After mixing is complete in the cross section, the equation simplifies to:
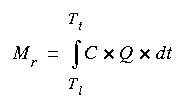 (eqn 2)
where C is assumed to be uniform in the cross section and Q is the total discharge in the cross section at time t. If mixing is not complete, equation 2 can still be used as long as the concentration C is the discharge-weighted, cross-sectional-average concentration. If discharge is constant during the passage of a tracer cloud, it can also be factored out of the integral.
The shape and magnitude of the observed tracer-response curves shown in figures 1 and 2 are determined by four factors:
All of these factors must be taken into consideration to predict the concentration of solutes from tracer-concentration data.
It is obvious that the magnitude of the tracer concentration in a stream is in direct proportion to the mass of tracer injected, Mi. Doubling the amount of injected tracer will double the observed concentrations, but the shape and duration of the tracer-response curve will remain constant. Thus, most investigators have normalized their data by dividing all observed tracer concentrations by the mass of tracer injected, Mi (Bailey and others, 1966; Martens and others, 1974).
It has also been found that various tracers are lost in transit due to adhesion on sediments and photochemical decay. Scott and others (1969) found fluorescent dyes to be absorbed on fine sediments such as clay. Rhodamine WT dye has been shown both in the field and laboratory to decay photochemically about 2 to 4 percent per day (Hetling and O'Connell, 1966; Tai and Rathbun, 1988). Kilpatrick (1993) noted decay rates tended to be higher in rivers, about 5 percent per day, compared to about 3 percent per day in estuaries.
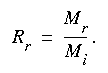
To compare data and to have it simulate a conservative substance, it is desirable to eliminate the effects of tracer loss. If the stream discharge, Q, is measured at the same time and location as the tracer concentration, it is possible to evaluate the mass of tracer recovered, Mr, from equations 1 or 2. When the mass of the tracer injected, Mi, is known, the tracer recovery ratio Rr can be expressed as:
 (eqn 3)
A factor that inversely affects the magnitude of the tracer-response curves is the stream discharge. The diluting effect of tributary inflows, as well as that of natural ground-water accretion, differs from stream to stream and with location. To counter the variable diluting effects of differing discharges, it is desirable to adjust observed concentration data by multiplying by the stream discharge.
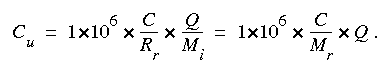
Observed concentrations can be adjusted for (1) the amount of tracer injected, (2) tracer loss, and (3) stream discharge (three of the four factors affecting the concentration) by use of what is called a "unit concentration." The unit concentration is defined as 1,000,000 times the concentration produced in a unit discharge due to the injection of a unit mass of conservative soluble substance. The unit concentration, Cu (units of inverse time), can be computed by the equation:
 (eqn 4)
The unit concentration can be visualized as the mass flux of solute (milligrams per liter times liters per second = milligrams per second) per unit of mass injected (milligrams). The 1,000,000 simply makes the numbers closer to unity. The discharge must be expressed in units that are consistent with the denominator of the concentration, and the injected mass must be in the same units as the numerator of the concentration. For example, if the concentration is expressed in milligrams per liter, the injected mass must be expressed in milligrams and the discharge must be expressed in liters per unit time. If the entire tracer cloud is sampled, the value of Mr can be computed and the mass of injected tracer need not be known.
Equation 4 can be used to convert any measured tracer-response curve to a unit-response (UR) curve. This UR curve can be used as the building block for simulating the concentrations to be expected from various pollutant loadings at different stream discharges. Normalizing the tracer-response curves, in effect, fits one unit of mass of tracer into one unit of flow. As such, when the flow is constant and mixing is complete, the area under UR curves is constant (1x10⁶) for any cross section on a stream.
All models solve three basic equations-the continuity of the mass of water, the conservation of momentum, and the conservation of the mass of the pollutant. Generally the first two equations are solved by use of a flow model to provide the water velocity, depth, and cross-sectional area as a function of time and position along the river. Three basic types of flow models are in common use. The simplest type, called the kinematic wave flow model, solves only the simplest form of the momentum equation by assuming the boundary friction force is always in balance with the weight component along the channel. Kinematic wave models generally provide satisfactory results for shallow flows over steep terrain, such as occurs in overland flow. The flow component in rainfall/runoff models often uses a kinematic wave approach to flow modeling. Kinematic wave models generally are not recommended for routing flows in rivers.
The most complex flow models, called the dynamic wave models, solve the complete form of the momentum equation. Examples are numerous including the BRANCH flow model of the Geological Survey (Schaffranek and others, 1981), the DAMBRK model of the National Weather Service (Fread, 1977, 1984), and many others. These models work well for rivers with very flat slopes and in estuaries where flow reversals occur. They generally require at least two input boundary conditions (often the upstream discharge and the downstream stage) and detailed input information about the channel geometry and flow resistance. Dynamic wave models tend to become unstable as the river slope increases, particularly for rivers with shallow depths, slopes exceeding 0.5 m/km, or rivers with distinct riffles and pools.
Diffusive wave models ignore the inertia of the water and equate the sum of the pressure and friction forces to the weight component of the water. These models assume there is a unique relation between a steady-state flow and stage at each point in the river, so they generally do not require the specification of a downstream stage. They also generally operate satisfactorily with less detailed channel geometry information than required by the dynamic wave models and are much more stable and easy to use. Accuracy of diffusive wave models increase with increasing slope, and they cannot be used in situations where flow reversals occur. By using empirical geomorphological relations to represent channel geometry, the DAFLOW model (Jobson, 1989) has been shown to provide excellent accuracy using very limited data for slopes as small as 0.3 m/km. The DAFLOW model also allows wave speeds and transport speeds to be independently specified, which greatly facilitates the calibration of a transport model.
Transport models simulate four basic processes-advection, dilution, longitudinal mixing, and decay. Many excellent one-dimensional numerical models are available for simulating dissolved pollutant transport in rivers. The major models in use in the United States include the BLTM developed by the Geological Survey (Jobson, 1987), the WASP developed by the U.S. Environmental Protection Agency (Ambrose and others, 1987), and the CE-QUAL-RIV1 developed by the U.S. Army Corps of Engineers (Environmental Laboratory, 1990). All one-dimensional models solve the continuity of mass equation along the river thalweg, and so the differences between the models is generally less important than the quality of the data used to drive them.
Advection is simply the translation of the response function downstream with time. The water and the dissolved pollutant must move downstream at the cross-sectional mean water velocity that is supplied by the flow model. The accuracy of the timing, therefore, is dependent on the accuracy of the flow model, not the accuracy of the transport model. No matter which flow model is used, the channel geometry information will generally have to be adjusted (calibrated) to force the timing of the simulated and observed response functions in figure 2 to agree.
Dilution by tributary inflow is a simple process that all models simulate very well.
All models assume the spreading of the response function with time (fig. 2) is caused by a Fickian type of dispersion process. A Fickian process is one that assumes the flux of material along the channel is proportional to the concentration gradient. The proportionality constant is called the dispersion coefficient. Transport models can be grouped into two basic types called Eulerian models and Lagrangian models.
Eulerial models solve the continuity of mass equation at fixed locations along the channel, and Lagrangian models solve the continuity equation for a series of specific water parcels that move along the channel with the mean flow velocity. Eulerian models generally exhibit more numerical dispersion than Lagrangian models. In estuaries where reversing flow is predominant, numerical dispersion becomes much more troublesome. Paul Conrads (Geological Survey, personal commun., 1995) reported that while it was very difficult to calibrate an Eulerian model to simulate salinity throughout the Cooper River Estuary, the BLTM Lagrangian model was easy to calibrate and provided accurate simulations.
If Fickian dispersion correctly represented the total longitudinal mixing in rivers, the unit-peak concentration would decrease in proportion to the square root of time. Nordin and Sabol (1974) have reported that unit-peak concentration in natural rivers generally decreases more rapidly with time than predicted by the Fickian law. It is often assumed that other processes, presumably the movement of pollutant mass into and out of dead zone storage areas (Spreafico and van Mazijk, 1993), significantly contribute to the spreading of the response function in natural rivers. This process would tend to make the leading edge rise more steeply and the trailing edge fall more slowly than predicted by Fickian dispersion. Few models account for this process, so most models underpredict the tails on the concentration response function. Use of the empirical approach outlined herein, however, automatically accounts for all physical processes that contribute to the longitudinal spreading of the pollutant mass.
Transport models typically simulate a very limited number of chemical reactions. Prediction of the rates of chemical reactions is beyond the scope of this report.
These data will provide information sufficient to allow nearly every kind of applicable analysis in the literature and provide the best practical information on predicting the effects of spills. It is often not practical to obtain the complete information as outlined above. Probably the most valuable information for improving forecasts is to measure the traveltimes of the peak concentrations at the center of the channel for various discharges. If only the peak traveltime is needed, the entire tracer cloud need not be sampled and it is not necessary to know the amount of tracer injected. It is important, however, that lateral mixing be nearly complete in the measurement reach and that the discharges be reasonably steady. Rather than measuring the discharge at each measurement cross section, the local discharge is sometimes assumed to be directly related to the flow measured at a remote index site.
The second most valuable information that can be gained from time-of-travel studies is the traveltimes for the leading edge of the tracer cloud. To obtain this information, sampling must begin before the arrival of the tracer and continue long enough to be sure the true peak concentration has passed.
If data are available for only one discharge, they can be extrapolated to other flows using equation 8 or other extrapolation techniques discussed later in the report.
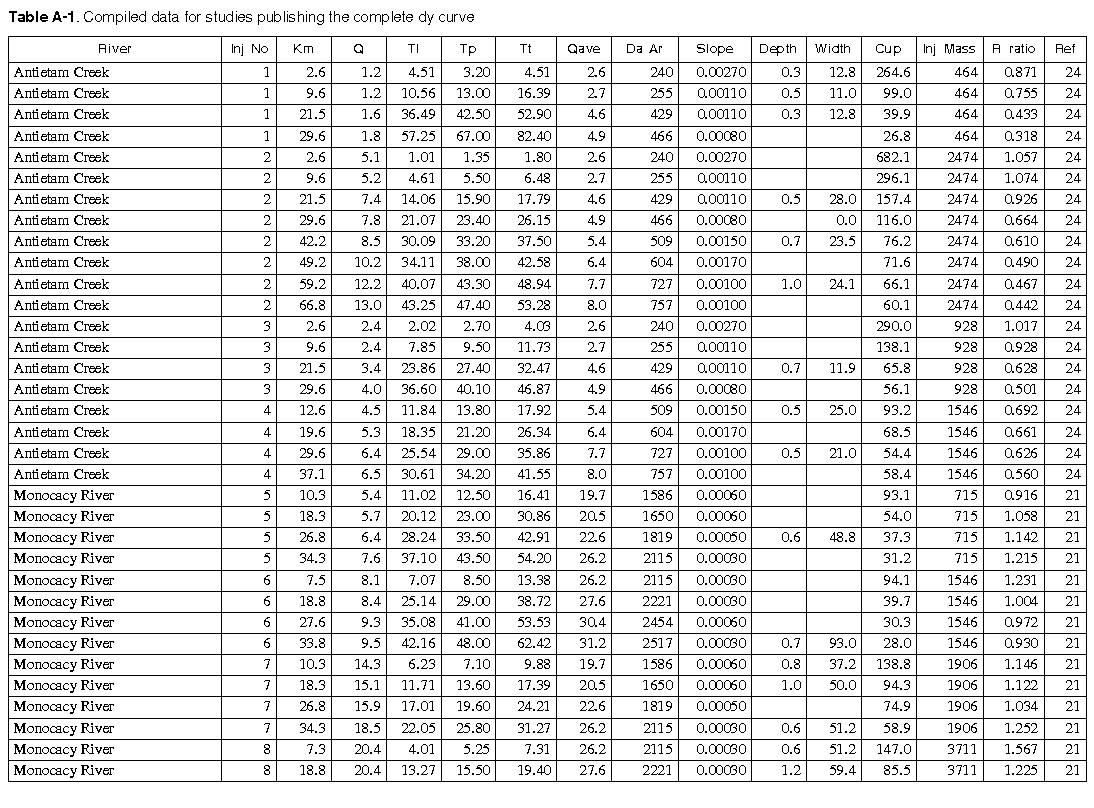
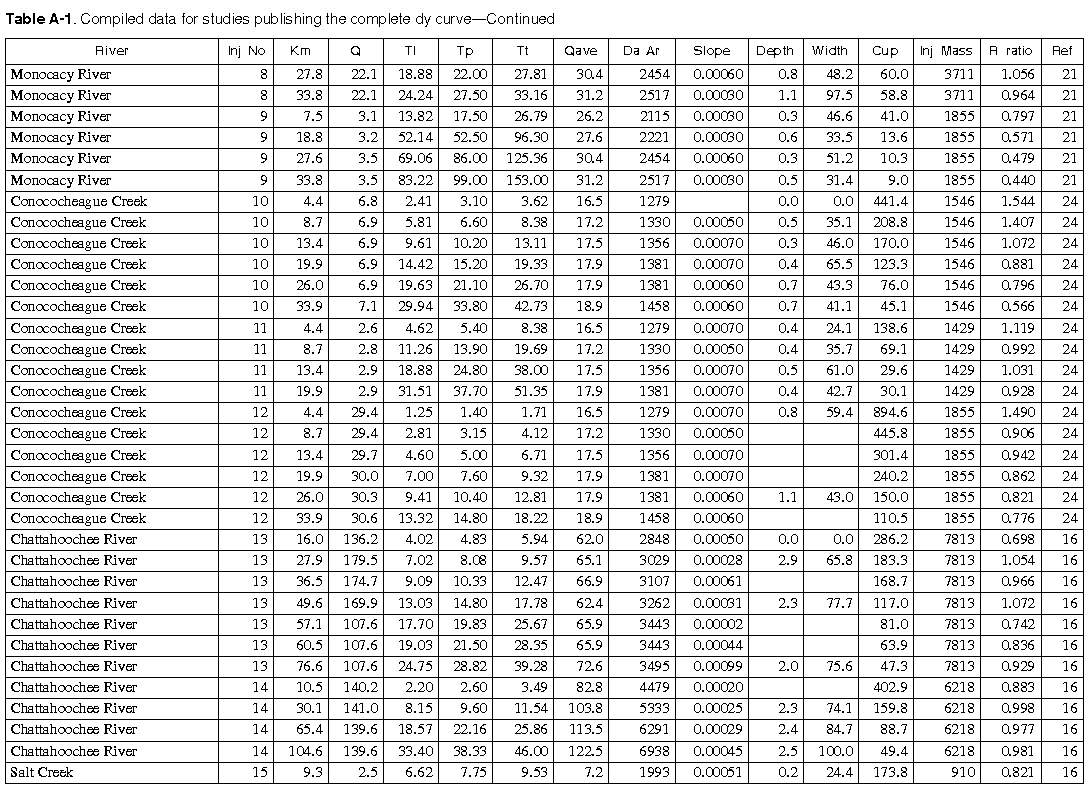
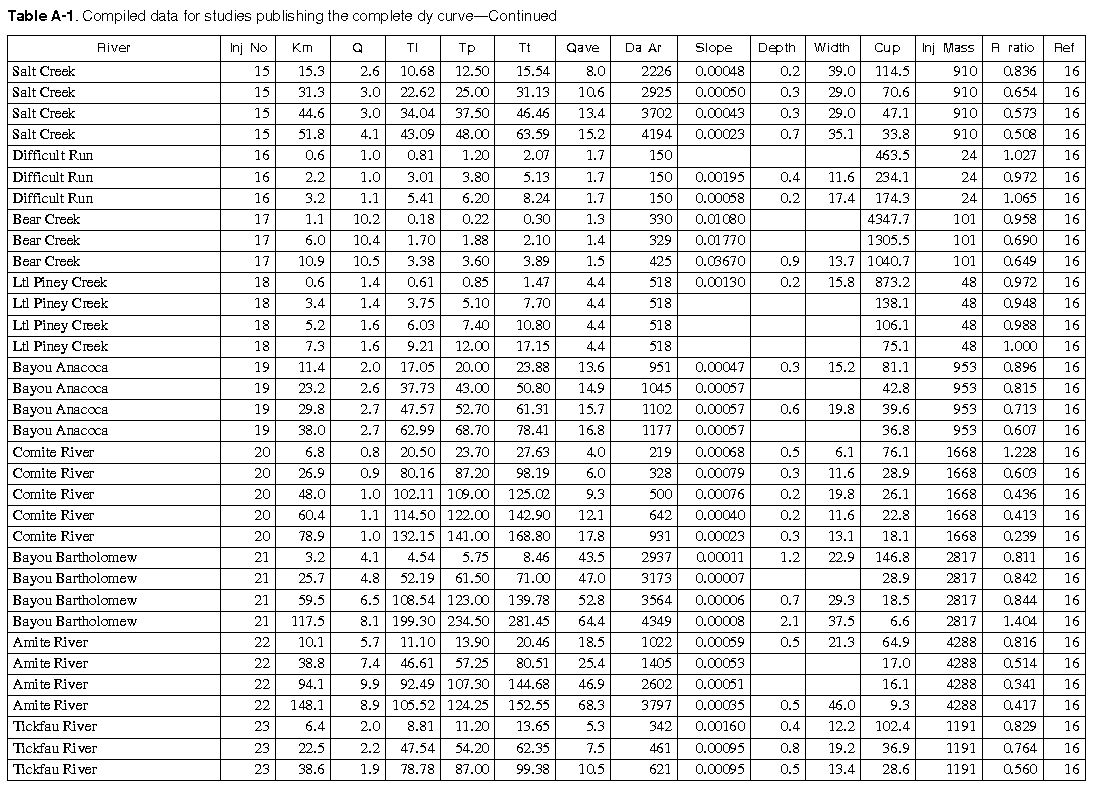
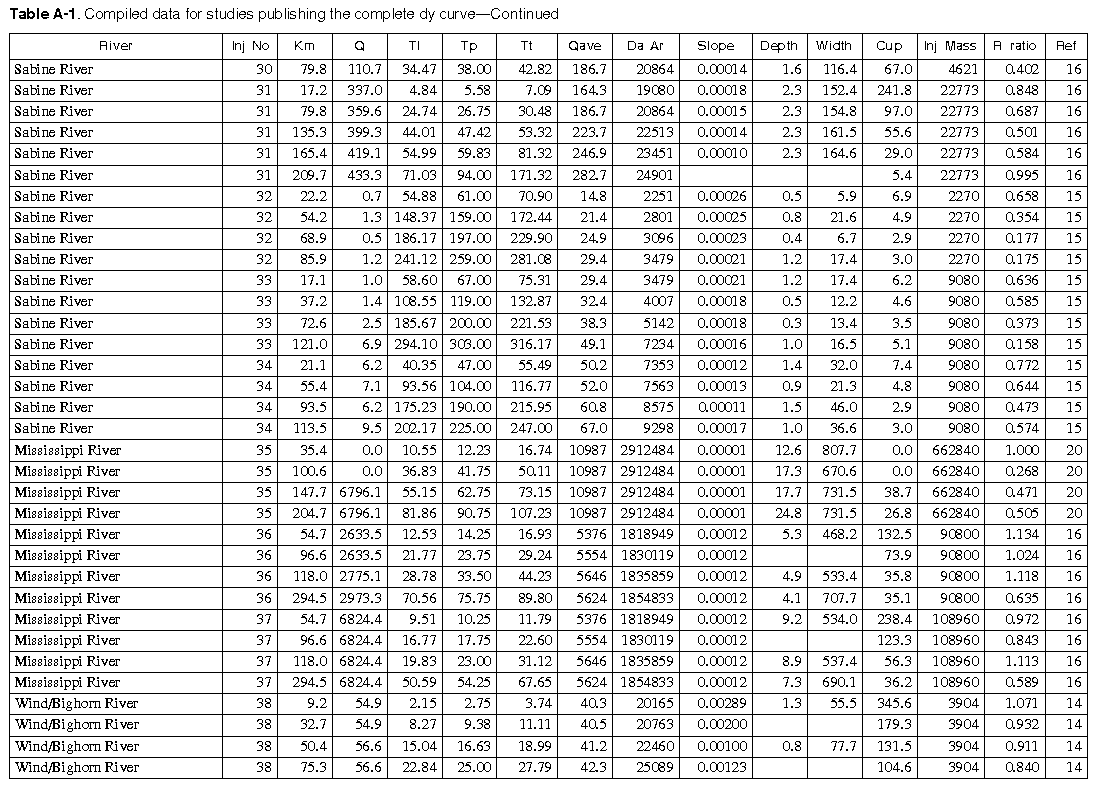
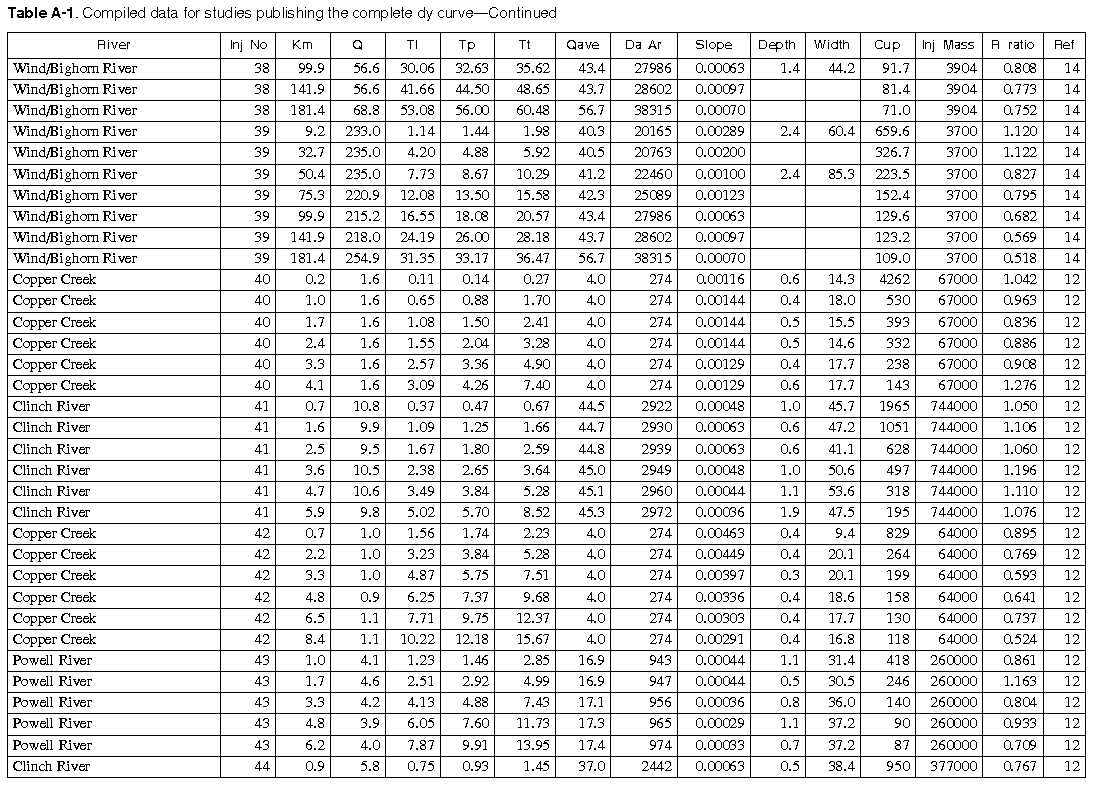
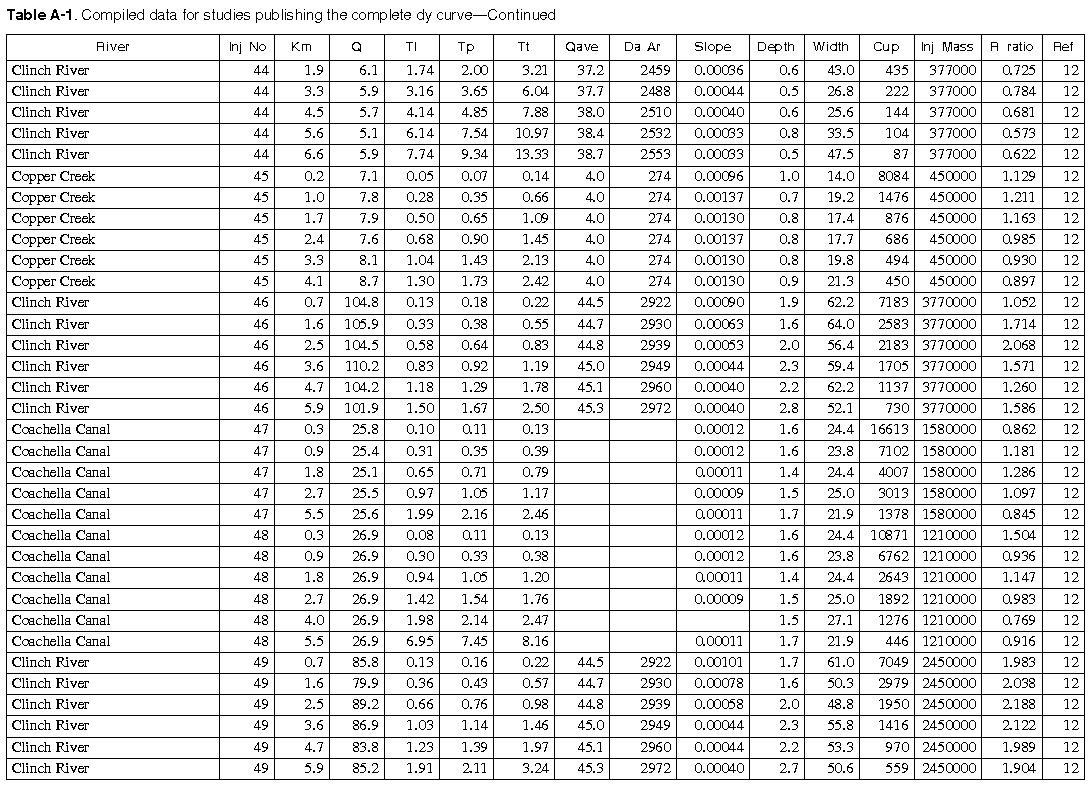
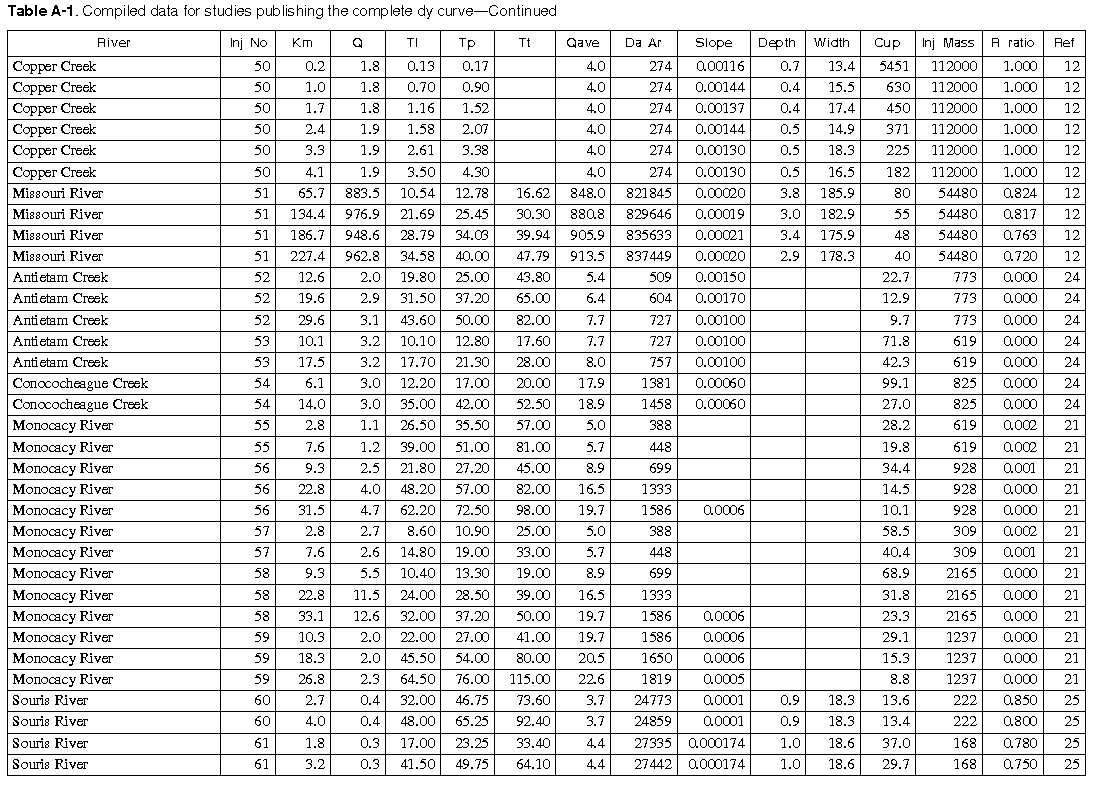
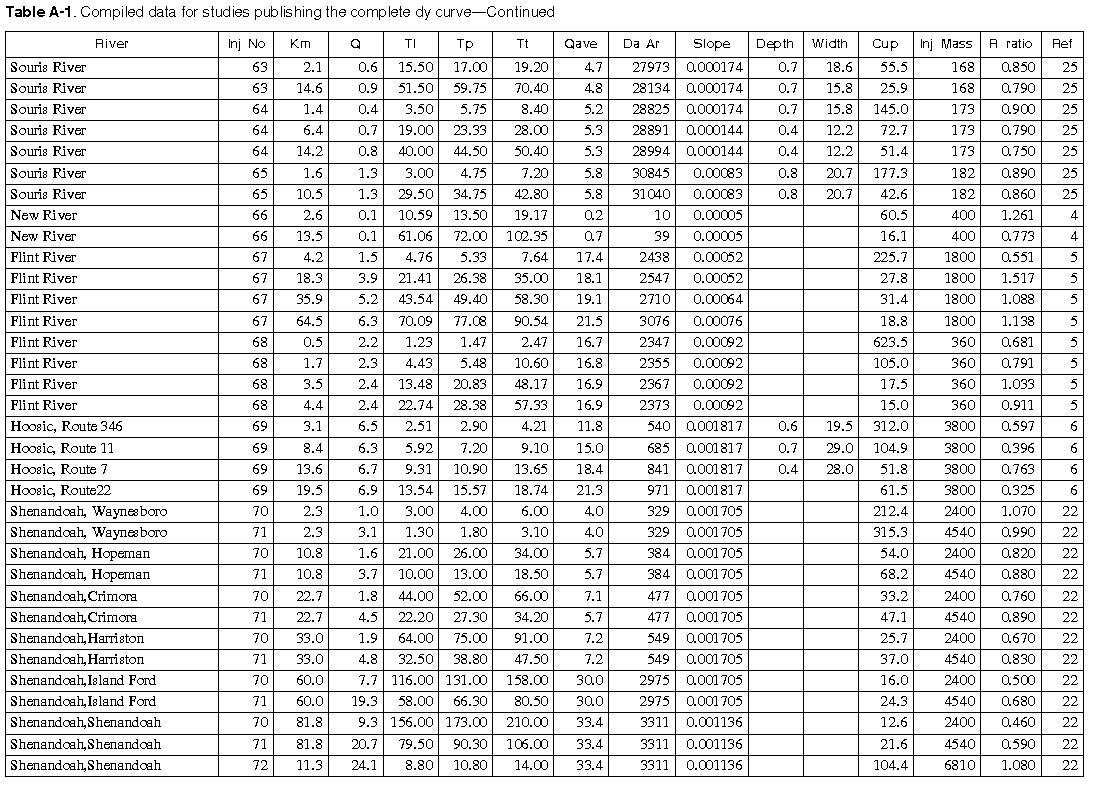
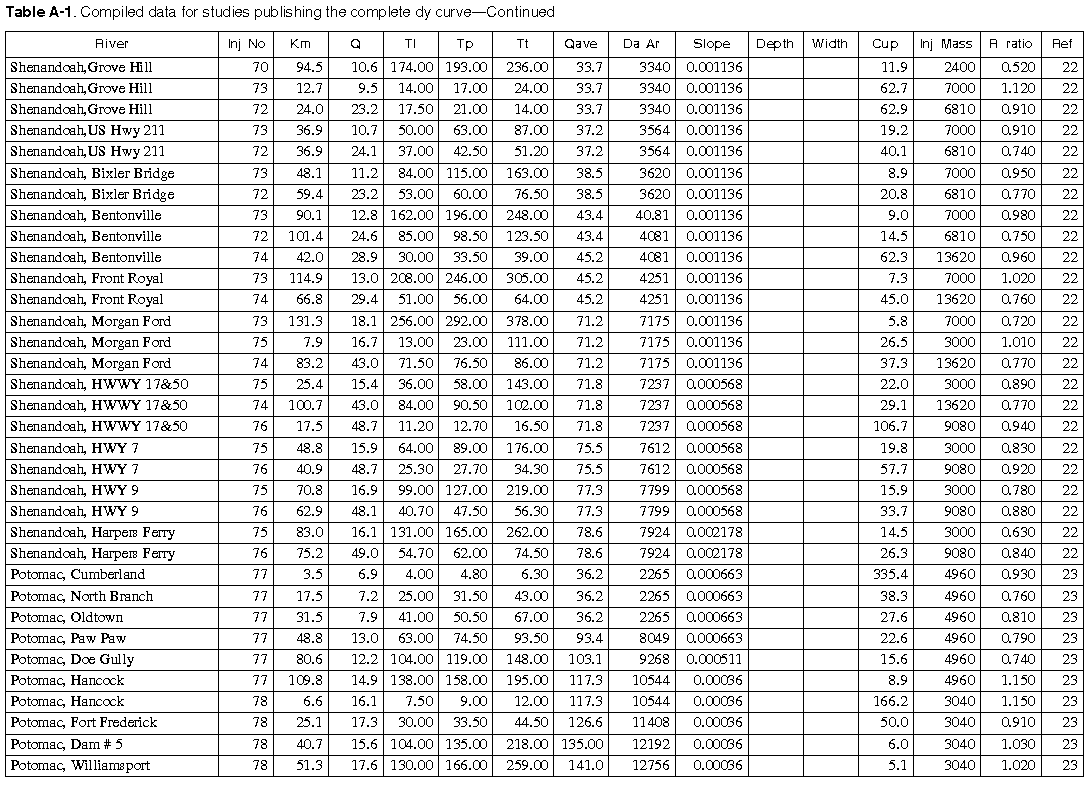
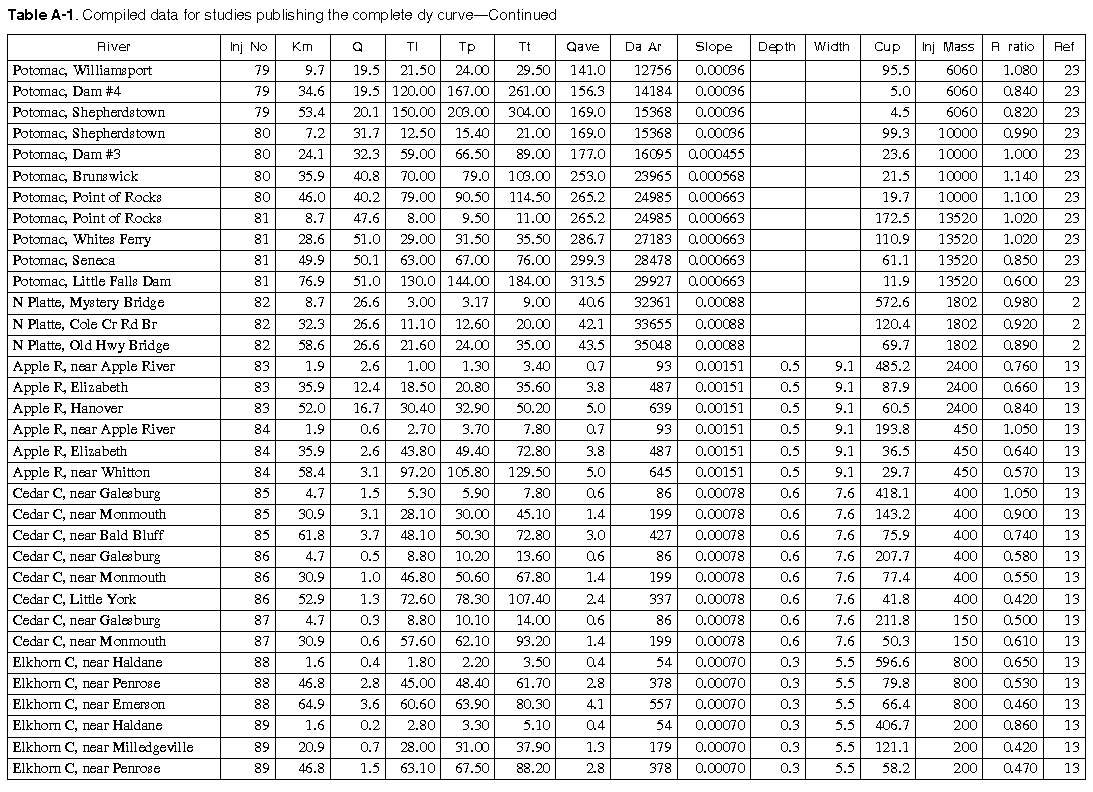
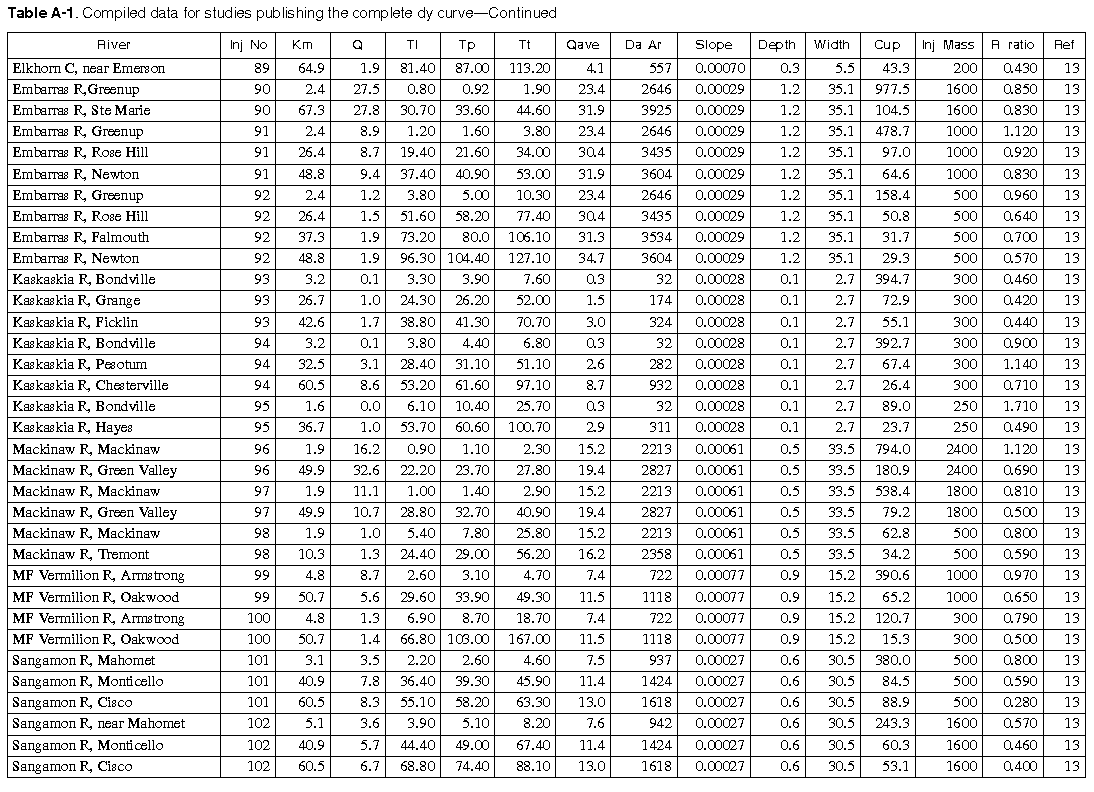
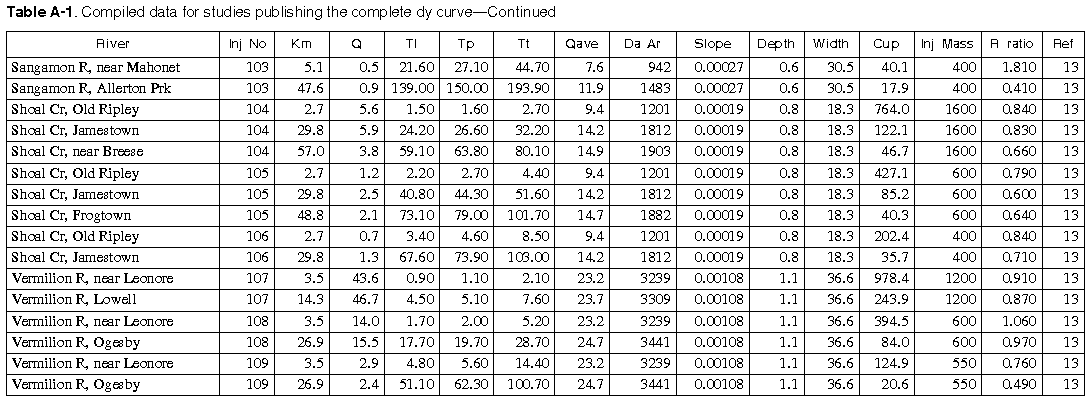
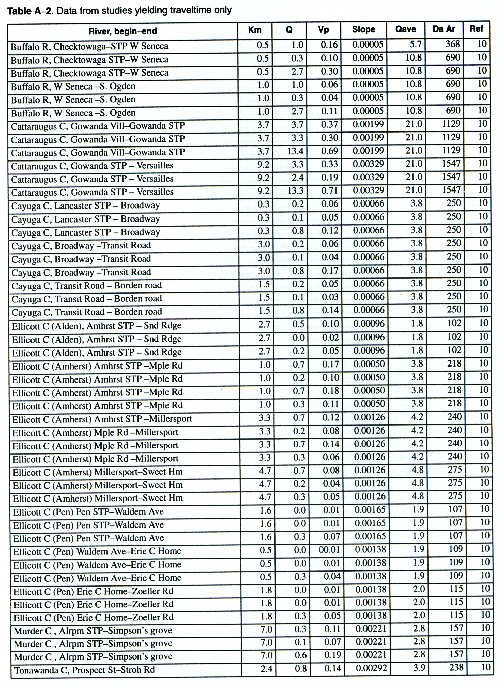
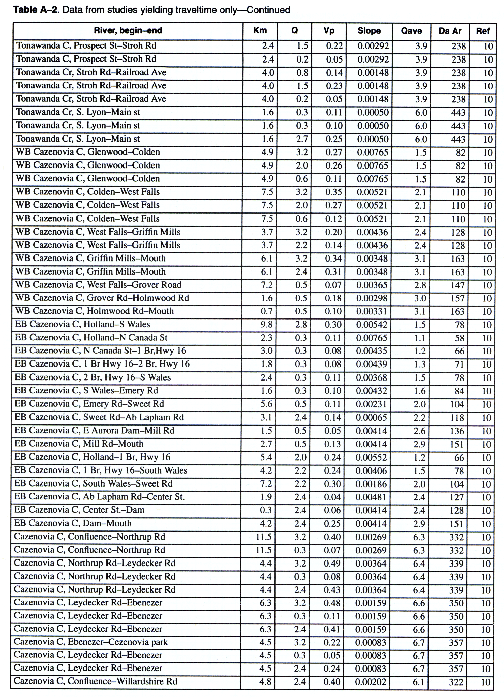
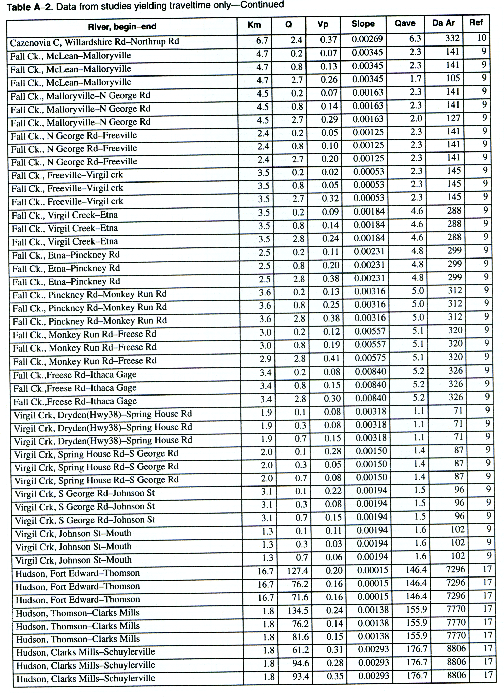
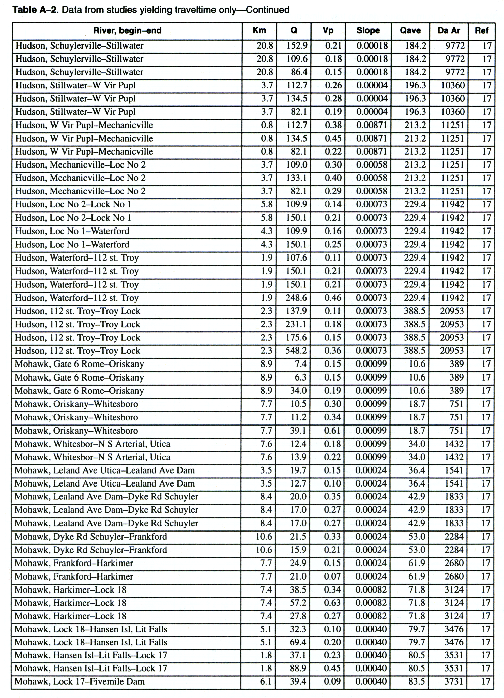
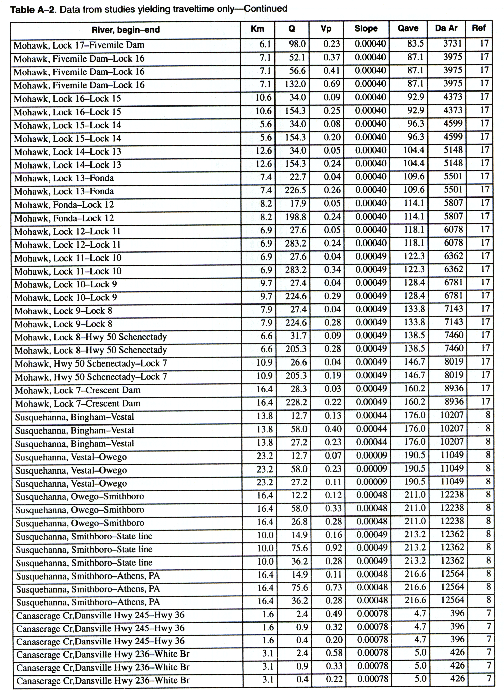
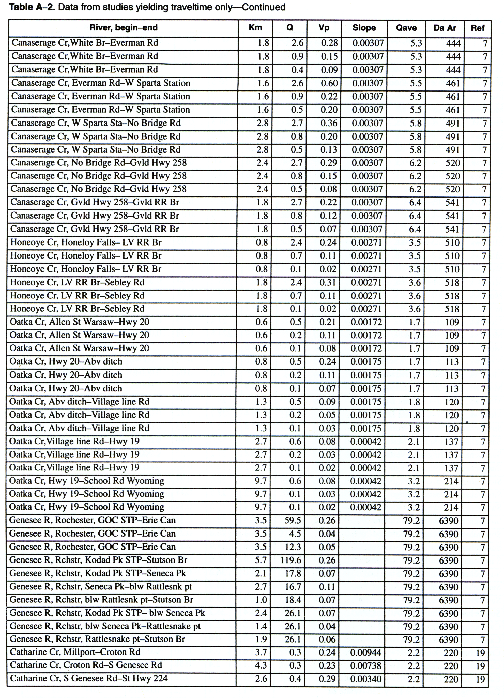
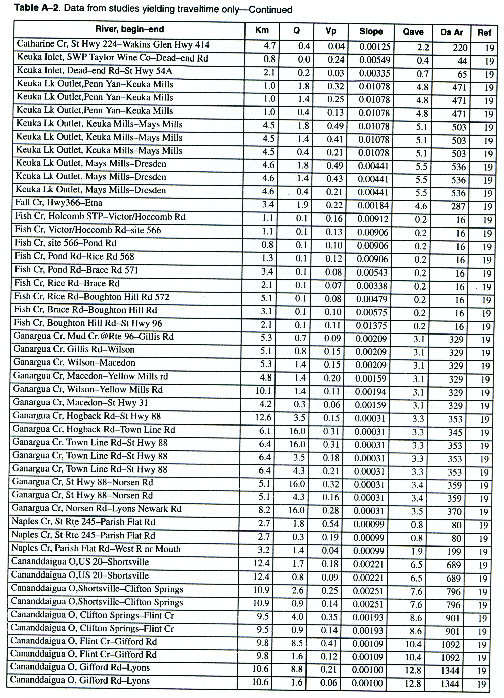
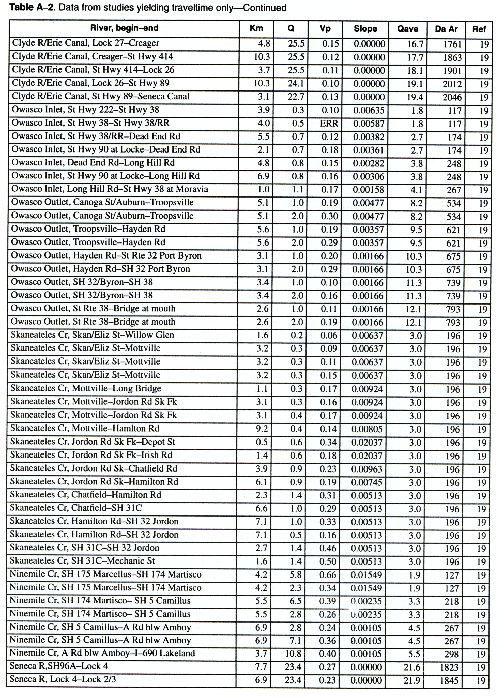
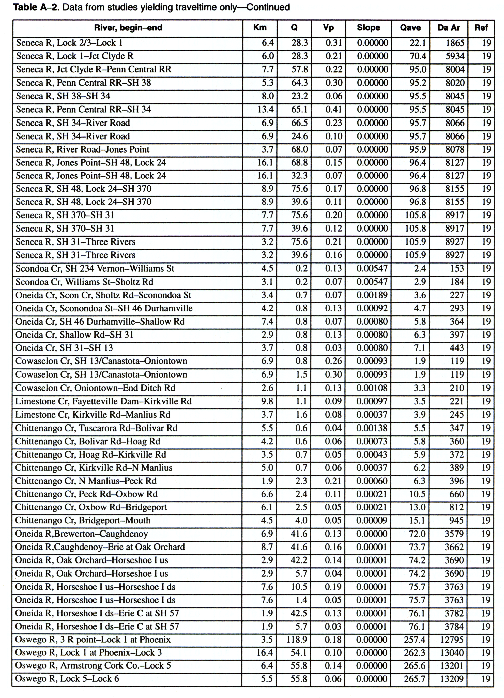
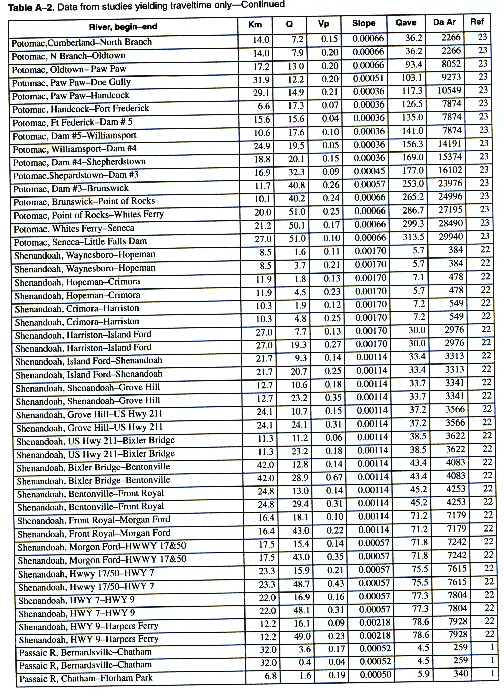
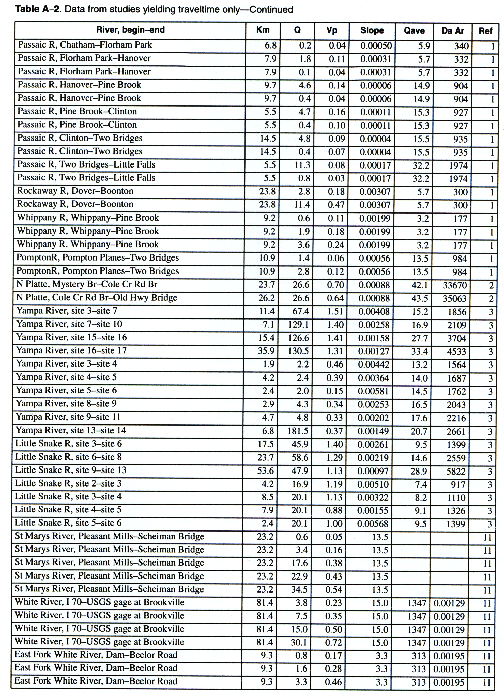
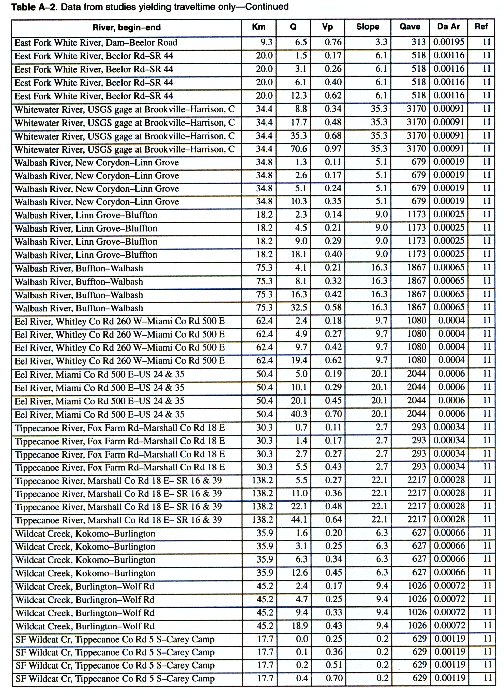
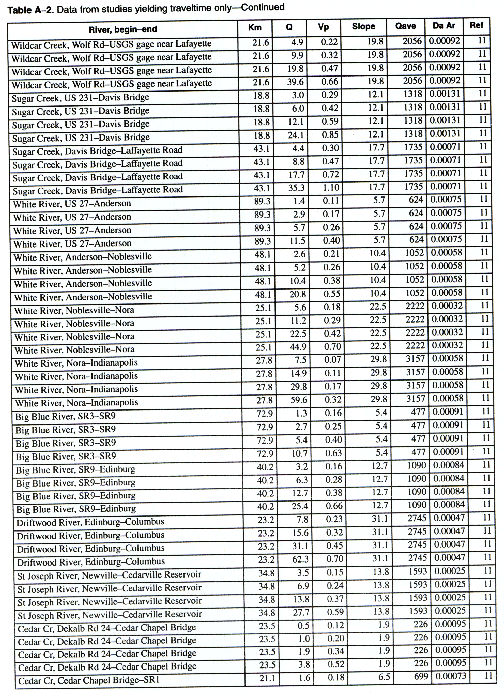
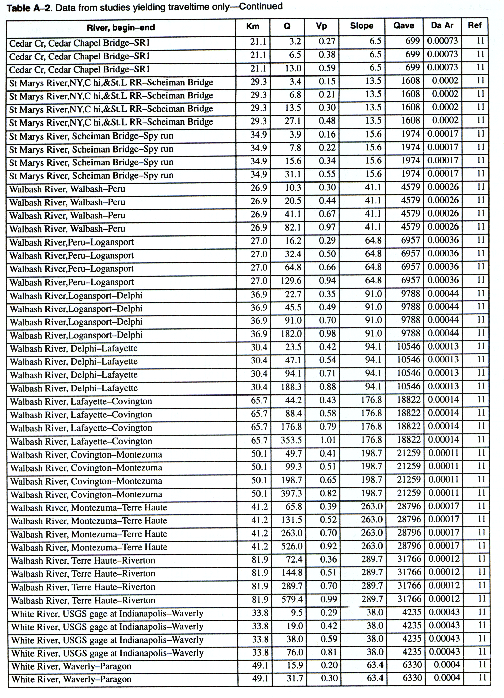
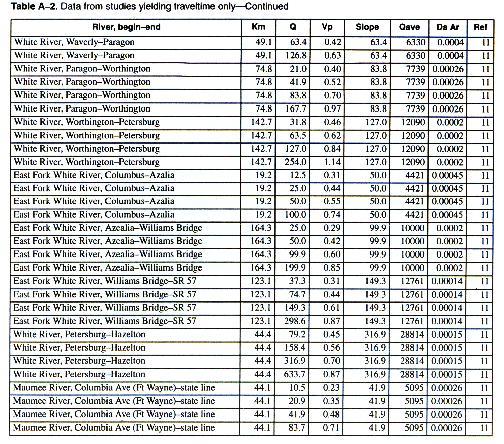
As many of the available data as time permitted were compiled for use in this report. All of the compiled data are listed in Appendix A. The appendix contains two tables and a list of references to the original studies. Table A-1 contains all the data for studies in which the unit-peak concentrations could be determined. Table A-2 contains all the data for studies in which the unit-peak concentrations could not be determined.
Appendix B contains a bibliography of other reports containing time-of-travel data that were not compiled because of time constraints.
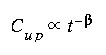 (eqn 5)
in which Cup is the unit-peak concentration, t is time since injection, and b is a coefficient. The value of b should be approximately 1.5 for very short dispersion times (section I on fig. 1) and decrease to 0.5 for very long dispersion times (section V on fig. 1). Nordin and Sabol (1974) argue that a Fickian type equation cannot adequately describe longitudinal dispersion in rivers because the value of b never decreases to a value of 0.5. They conclude that a typical value of b is 0.7
After mixing in the cross section is complete, the decrease of the unit-peak concentration with time (as measured by b) is a measure of the longitudinal mixing efficiency. Larger values of b indicate more rapid longitudinal mixing. The presence of pools and riffles, bends, and other channel and reach characteristics will increase the rate of longitudinal mixing and almost always yield a value of b greater than the Fickian value of 0.5.
Unit-peak concentrations were compiled for 422 cross sections obtained from more than 60 different rivers in the United States. These data represent mixing conditions in rivers with a wide range of size, slope, and geomorphic type. For example, the slope in the study reach of the Mississippi River is 0.01 m/km and the mean annual discharge is about 11,000 m3/s, whereas the study reach of Bear Creek has a slope of 36.0 m/km and a mean annual discharge of only about 1.3 m3/s.
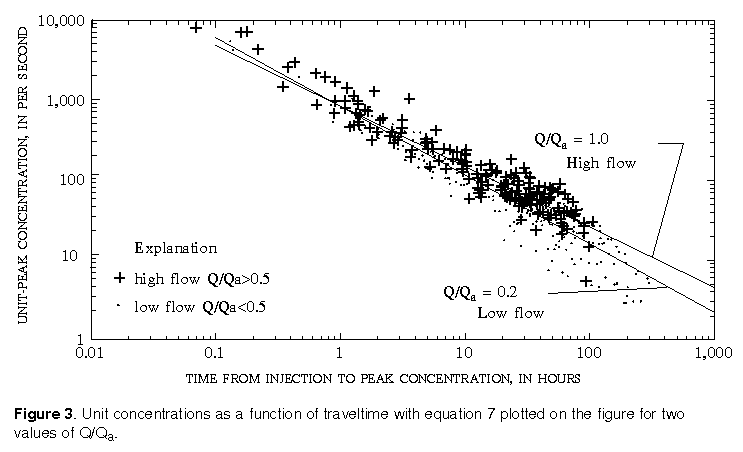
Figure 3 is a plot of the unit-peak concentrations (Cup) as a function of traveltime (Tp) of the peak concentration of all the data for which the mean annual flow was available. A tight correlation is shown by the data, indicating that a reasonable estimate of the unit-peak concentration can be determined from an expression of the form of equation 5. The regression equation based only on traveltime that best fit all of the data was:
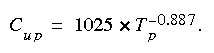 (eqn 6)
This equation predicted the 422 available data points with a root mean square (RMS) error of 0.502 natural log units. The coefficient of variation was 0.112 and the coefficient of determination (R2) value was 0.893. The standard error of estimate of the coefficient is 4.9 percent and the standard error of estimate for the exponent is 1.7 percent.
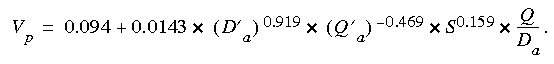
Other river characteristics that were available to help define the relation included the drainage area (Da), the reach slope (S), the mean annual river discharge (Qa), and the discharge at the time of the measurement (Q). The most significant other variable in the correlation was the ratio of the river discharge to mean annual discharge giving a prediction equation:
 (eqn 7)
in which Q is the river flow at the section at the time of the measurement and Qa is the mean annual flow at the section. This equation predicted the 410 available data points with an RMS error of 0.426 natural log units. The coefficient of variation was 0.100 and the R2 value was 0.910. The standard error of estimate of the coefficient is 4.3 percent, and the standard error of estimate for the exponent (0.760) is 1.6 percent.
The data in figure 3 are separated into two groups-one with values of relative discharge (Q/Qa) greater than 0.5 (high flow) and one with a relative discharge less than 0.5 (low flow). The solid lines for high flow and low flow are plotted assuming constant values of relative discharge of 1.0 and 0.2, the approximate median value for each group of data.
Slope was not significant as an explanatory variable. Various regression models based on different combinations of discharge, mean annual discharge, and drainage area were tried. None of the equations produced a smaller RMS error or a larger R22 value than equation 7.
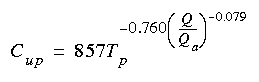
Results for individual rivers generally define a much closer relation. For example, figure 4 presents measured concentrations of dye for the Shenandoah River as published by Taylor and others (1986). The points labeled as Q/Qa=0.65 were actually taken at relative discharges ranging from 0.57 to 0.79 and the points labeled as Q/Qa=0.27 actually ranged from 0.21 to 0.32. Notice that the data for the Shenandoah River show almost no correlation with relative discharge. Equations 6 and 7 are also plotted on the figure for reference. In this case the equations fit the data very closely.
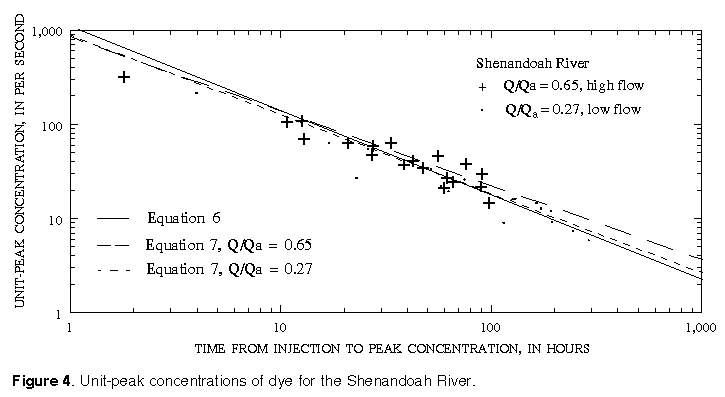
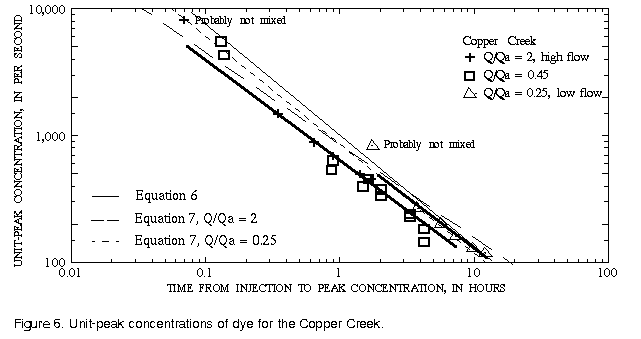
Results for Wind/Bighorn Rivers and Copper Creek show a weak relation with relative discharge (figs. 5 and 6). Notice that the data for all of these rivers define a very good curve although the data for the Wind/Bighorn Rivers are not especially well fit by either equation 6 or 7.
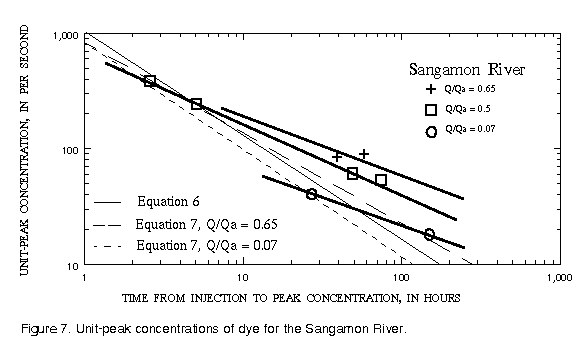
The Sangamon River shows strong correlations with relative discharge (fig. 7). It should be noted, however, that one set of measurements was made at extremely low flow. At any rate, the scatter among points for a single river is typically much less than the scatter among all rivers (fig. 3) so there is significant value in collecting data for individual rivers to improve the ability to predict the variation of unit-peak concentration.
A flow-duration curve is often used to provide a common base for comparison of streams of different sizes (Graf, 1986). A flow-duration curve for a site is developed by plotting the discharge as a function of the percentage of time the flow is exceeded. Several years of continuous discharge data are required but once the flow-duration curve is established for a site, flow-duration frequencies can be determined from the curve. Flows with low flow-duration frequencies are high discharges that occur during floods, whereas flows that occur with high flow-duration frequencies are low discharges that approach base-flow conditions.
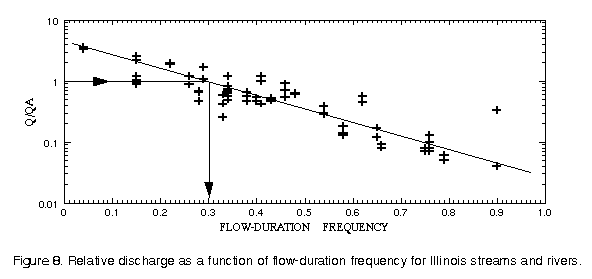
Because the development of a flow-duration curve for a site requires data that are unlikely to be available where predictions are required, the relative discharge (discharge at measurement site/mean annual flow at measurement site, Q/Qa) is used in this report to provide a common base for comparison of streams having different sizes. The mean annual flow (Qa) can be easily estimated from drainage area and runoff relations for the region. An analysis of the data for the ten streams analyzed by Graf (1986) indicated that the relative discharge is equally as efficient as flow-duration frequency for predicting the unit-peak concentrations. Figure 8 is a plot of the relation between relative discharge and flow-duration frequency for Illinois streams as determined from the data of Graf (1986). As can be seen from the figure, the average flow in Illinois streams is one that is exceeded about 30 percent of the time.
The more efficient the mixing in a river, the steeper will be the relation between unit-peak concentration and traveltime. At high flow, river channels generally tend to be relatively uniform in shape, and they tend to increasingly exhibit a pool and riffle structure as the flow decreases. A pool and riffle structure offers great opportunities for tracer trapping; therefore, a pool and riffle structure tends to be efficient in mixing and attenuating the peak concentration. Equation 7 accounts for this process by decreasing the slope of UR curve for lower relative discharges.
Stream velocity and, consequently, traveltime commonly vary with discharge. The relation of mean stream velocity, V, to discharge is generally assumed to take the form:
 (eqn 8)
which is a straight line when the logarithm of discharge, Q, is plotted against the logarithm of velocity. For accurate estimates the constant, K, and exponent, a, must be defined for each river reach of interest, and two or more time-of-travel measurements are required to define the transport characteristics of the river reach. Geomorphic analyses by many investigators, however, suggest that the exponent in equation 8 typically has a value of about 0.34 (Jobson, 1989).
The velocity of the peak concentration and associated hydraulic data are compiled in Appendix A for more than 980 subreaches for about 90 different rivers in the United States representing a wide range of river sizes, slopes, and geomorphic types. Four variables were available in sufficient quantities for regression analysis. These included the drainage area (Da), the reach slope (S), the mean annual river discharge (Qa), and the discharge at the section at time of the measurement (Q). It was reasoned that these variables should be combined into the following dimensionless groups. The dimensionless peak velocity is defined as:
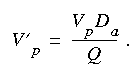 (eqn 9)
The dimensionless drainage area is defined as:
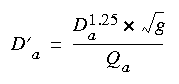 (eqn 10)
in which g is the acceleration of gravity. The dimensionless relative discharge is defined as:
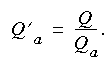 (eqn 11)
These equations are homogeneous, so any consistent system of units can be used in the dimensionless groups. The regression equations that follow, however, have a constant term that has specific units, meters per second. The most convenient set of units for use with the equations is, therefore, velocity in meters per second, discharge in cubic meters per second, drainage area in square meters, acceleration of gravity in m/s2, and slope in meters per meter.
The most accurate prediction equation, based on 939 data points, for the peak velocity in meters per second was:
 (eqn 12)
The standard error of estimates of the constant and slope are 0.026 m/s and 0.0003, respectively. This prediction equation has an R2 of 0.70 and an RMS error of 0.157 m/s. Figure 9 contains a plot of the observed velocities as a function of the variables on the right side of equation 12.
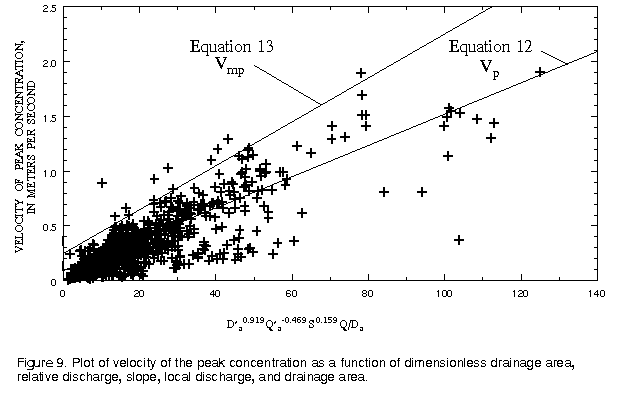
For responses to accidental spills, the highest probable velocity, which will result in the highest concentration, is usually a concern. On figure 9 an envelope line for which more than 99 percent of the observed velocities are smaller is also shown. The equation for this line, the maximum probable velocity, in meters per second (Vmp) is:
 (eqn 13)
The best equation for the velocity of the peak concentration, in meters per second, that did not include slope as a variable was:
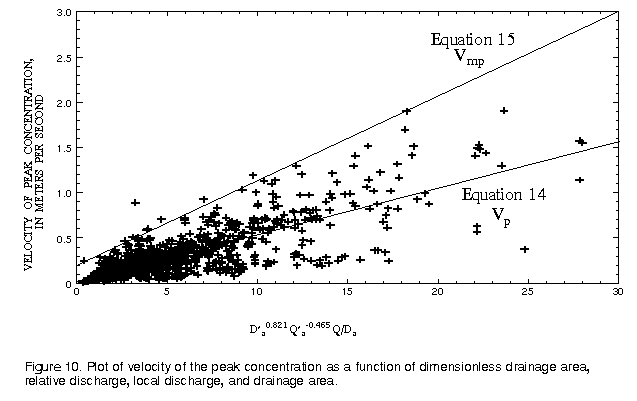
 (eqn 14)
The standard error of estimates of the constant and slope are 0.009 m/s and 0.0013, respectively. The root-mean-square error of the prediction equation, based on 986 points, is 0.17 m/s with an R2 of 0.62. Figure 10 presents a plot of the observed velocities as a function of the variables on the right side of equation 14. Also shown on the figure is a line for which 99 percent of the data points indicate a smaller velocity. The equation for this line, for the probable maximum velocity, in meters per second, is:
 (eqn 15)
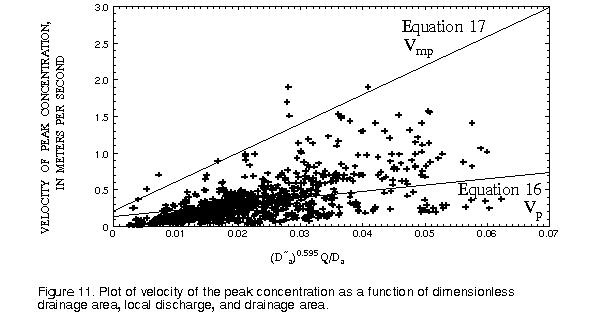
The best equation for the velocity of the peak concentration, in meters per second, using only drainage area was:
 (eqn 16)
The term D a is defined by equation 10 except that the local discharge (Q) is used in place of the mean annual discharge (Q a). The standard error of estimates, based on 986 points, of the constant and slope are 0.009 m/s and 0.28, respectively. The root-mean-square error of the prediction equation is 0.21 m/s with an R2 of 0.46. Figure 11 presents a plot of the observed data as a function of the variables on the right side of equation 16. Also shown on the figure is a line for which 99 percent of the data points indicate a smaller velocity. The equation for this line is:
 (eqn 17)
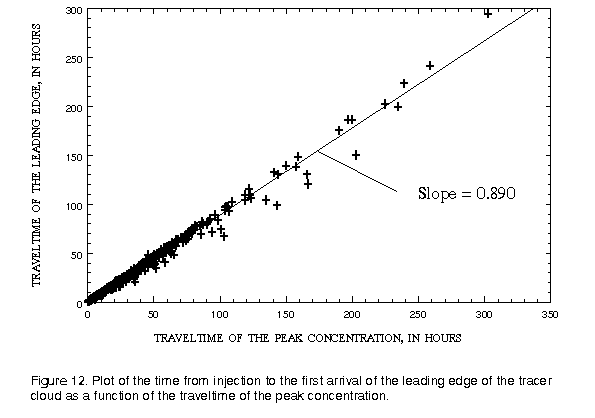
Fewer data are available for the time-of-arrival of the leading edge (520 sites) than are available for the velocity of the peak concentration. Eight variables were available in sufficient quantities for regression analysis. These included the drainage area (Da), the reach slope (S), the mean annual river discharge (Qa), the discharge at the section at time of the measurement (Q), the velocity of the peak concentration (Vp), the width of the river, the depth of the river, and the time from the injection to the passage of the peak concentration (traveltime of the peak concentration, Tp). No significant correlation could be found between any of the variables and the time from injection to the arrival of the leading edge (Tl) except for the traveltime to the peak concentration. Figure 12 contains a plot of the traveltime of the leading edge as a function of the traveltime of the peak concentration. As can be seen from the figure, the correlation between these two variables is very good with an R2 of 0.989, a coefficient of variation of 0.13, and a RMS error of 3.78 hours. These data indicate that the traveltime of the leading edge can be estimated from:
 (eqn 18)
 (eqn 19)
Furthermore, the area under the tail of the tracer-response curve should approximately balance the area between the falling limb portion of the tracer-response curve and the falling limb of the scalene triangle (fig. 2). This allows a complete tracer-response curve to be sketched in with reasonable accuracy based on the peak concentration and the times to the leading edge and peak.
 (eqn 20)
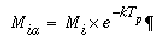
in which Mia is the apparent mass of pollutant spilled after a time of Tp, Mi is the actual mass of pollutant spilled, and k is the decay coefficient with units of time-1. The apparent mass of pollutant is then used in the unit concentration relation to determine the actual concentration from the unit concentration.
No data exist for the stream receiving the spill, but topographic maps show that the drainage area is 350 km2 at the spill site and 430 km2 at the intake for the town. A review of available data also indicates that a gaging station exists for a nearby stream with a drainage area of 452 km2 and a mean-annual flow of 5.22 m3/s. At the time of the spill the flow at the gaging station was 3.88 m3/s. The hydrology and weather are assumed to be fairly uniform within the area so it will be assumed that the stream carrying the spill is flowing at about 3.88 (390/452) = 3.35 m3/s, assuming the average drainage area for the reach is (350+430)/2 = 390 km2. Likewise, the mean-annual flow of the ungaged stream is estimated to be about 5.22 (390/452) = 4.50 m3/s.
The first step is to estimate traveltime of the peak concentration. Because the river slope is not available, equations 14 and 15 will be used to estimate the expected and fastest probable traveltimes in the stream. The dimensionless drainage area and discharge are computed first from equations 10 and 11:
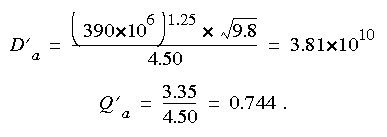
Applying equation 14:

while the maximum probable velocity from equation 15 is:

The most probable traveltime of the peak to the water intake is:
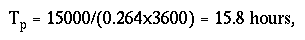
and the probable minimum traveltime of the peak is:
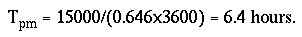
Tpm = 15000/(0.646x3600) = 6.4 hours. With the traveltimes known, the most probable unit-peak concentration at the town intake can be estimated from equation 7 as:

Rearranging equation 4, to give the peak concentration:
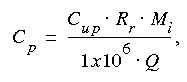
and using the injected mass, Mi, of 6x10⁹ mg, the flow rate at the intake, Q, of (3.88x(430/452)x1000) 3,690 L/s, and assuming the recovery ratio, Rr, to be 1.0, the most probable conservative-peak concentration can be computed as:
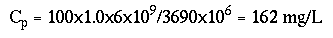
occurring 15.8 hours after the injection.
At the highest probable velocity, the unit-peak concentration is 202 s-1 giving an estimated conservative-peak concentration of 328 mg/L occurring 6.4 hours after the spill.
When will the pollutant first arrive at the intake? As can be seen from equation 18, the time of arrival of the leading edge of the pollutant cloud should occur 0.89x15.8 = 14 hours after the accident. It is highly unlikely that the pollutant will arrive at the intake sooner than 0.89x6.4 = 5.7 hours after the spill.
How long will the intake be affected? As can be seen from equation 19, the most probable time required for the bulk of the dye cloud to pass the site (the concentration to be reduced to 10 percent of the peak value, 16 mg/L) is:
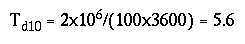
hours after the time of arrival, or 14+5.6 = 19.6 hours after the spill. It is highly unlikely that the pollutant concentration will have reduced to less than 20 mg/L before;
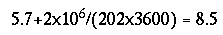
hours after the spill.
All of the above computations were carried out assuming no loss of pollutant between the spill and the intake. Losses could occur by chemical reactions, volatilization, absorption on the streambed, or other processes. Equation 20 can be used to account for these losses.
Two time-of-travel studies have been completed on this reach of the Apple River and the data are contained in table A-1 of Appendix A as injection numbers 83 and 84. One of these studies was conducted at relatively low flow, when the river discharge was about 0.7 times the mean annual flow, and one was conducted at relatively high flow, when the flow rate was about 3.5 times the mean annual flow. The first step is to estimate the times of travel of the leading edge and peak of the pollutant cloud. The traveltimes of the peak concentrations as found in table A-1 are plotted in figure 13.
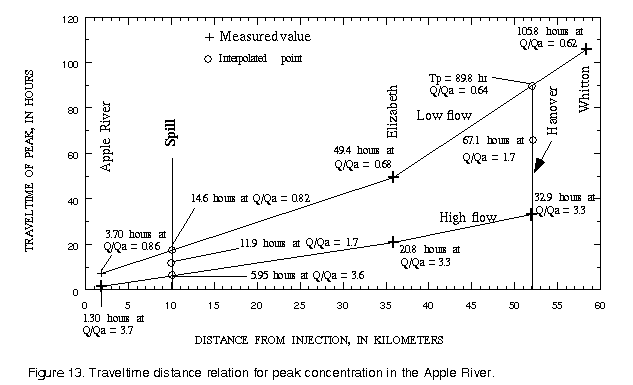
From table A-1 it is seen that the traveltime of the peak concentration to Elizabeth is 49.4 hours at a relative discharge of 0.68, while the traveltime to Whitton is 105.8 hours at a relative discharge of 0.62. Also it is seen that the distance from Elizabeth to Hanover is 16.1 km while the distance from Elizabeth to Whitton is 22.5 km, so Hanover is 72 percent of the way between Elizabeth and Whitton. By linear interpolation, it is easily seen that the traveltime from the injection site to Hanover would be about 49.4+(105.8-49.4)x0.72 = 89.8 hours and that the relative discharge at this point would have been about 0.68+(0.62-0.68)x0.72 = 0.64. Likewise, the traveltime from the town of Apple River to the spill site would be 1.30+(20.80-1.30)x(10-1.9)/(35.9-1.9) = 5.95 hours at a relative discharge of 3.7+(3.3-3.7)x(10-1.9)/(35.9-1.9) = 3.6. In a similar manner, the traveltime from Apple River to the spill site would be 14.6 hours at a relative discharge of 0.82.
Assuming a mean annual flow at the spill site of 1.4 m3/s, the relative discharge at the time of the spill is 2.4/1.4 = 1.7. Then by linear interpolation between the relative discharges, it is seen that the traveltime from Apple River to the spill site would be 5.95+(14.6-5.95)x(1.7-3.6)/(0.82-3.6) = 11.9 hours. Likewise the traveltime from Apple River to Hanover would be 67.1 hours. The traveltime from the spill site to Hanover should, therefore, be 67.1-11.9 = 55.2 hours.
With the relatively small amount of data contained in Appendix A for the Apple River, it is possible to estimate the timing of a spill on the river with much better accuracy than would have been possible by use of equations 12 to 17.
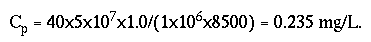
Figure 14 is a plot of the unit-peak concentrations measured on the Apple River during the two tests. As can be seen from the figure, the unit-peak concentration should be about 40 s-1 for a traveltime of 55 hours. Converting the spilled mass into milligrams (5x10⁷ mg), the flow rate at Hanover (Qave = 5 m3/s from table A-1) to liters per second (1.7x5.0x1000 = 8500), and assuming a recovery ratio of 1.0, the peak concentration at the intake can be estimated from equation 4 as:
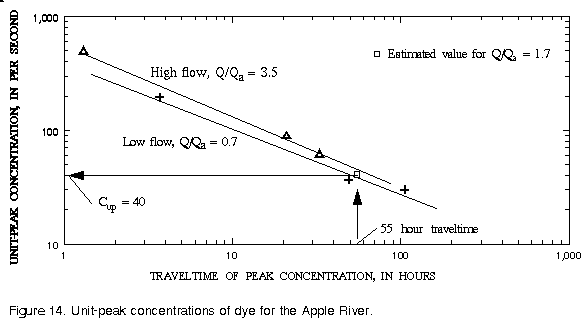
The time required for the pollution cloud to pass the intake and the river concentration to be reduced to 10 percent of the peak value (0.024 mg/L) can be estimated by use of equation 19 as:
The times for the arrival of the leading edge of the tracer cloud, from table A-1, can also be plotted as in figure 14. The traveltime of the leading edge of the tracer cloud from the spill site to Hanover can then be estimated using the same procedure as for the peak concentration, as 51.1 hours. After 51.1+13.9 = 65 hours the pollution cloud should have passed the intake and the concentration reduced to 0.024 mg/L.
In conclusion, the pollutant should first arrive at Hanover 51 hours after the spill. The peak concentration should pass the site 55 hours after the spill; and if there are no losses, it should arrive with a concentration of 0.24 mg/L. By 65 hours after the spill, the concentration should have fallen back to 0.024 mg/L. If there are losses or chemical reactions between the spill and the intake, the concentrations will be smaller and either equation 20 or a numerical model could be used for predictions.
The mean annual flow of the Rhine River is 0.0152 m3/s/km2 (Leeden and others, 1990, p. 181). Because the drainage area is approximately 16,000 and 48,000 km2 at river km 59 and 163.8, respectively, the mean annual flow can be estimated as 240 m3/s at the injection point and 730 m3/s at Birsfelden.
The response function characteristics at Eglisau and Birsfelden are first estimated without the aid of traveltime information. Assuming the drainage area at Eglisau is the same as at the injection site, the dimensionless drainage area, for use in equation 14, is computed as:
During the test, the river flow was 490 m3/s at the injection point (Spreafico and van Mazijk, 1993, p. 65) so the relative discharge is estimated as:
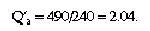
With these values the velocity can be predicted from equation 14 as:

so the traveltime to the peak concentration is estimated as:
Applying equation 7, the unit-peak concentration can be estimated as:
The time of first arrival is estimated as 0.89x5.7 = 5.1 hours (equation 18). The time of passage of the pollutant can be determined from equation 19 to be 2.3 hours, so the time from the spill until the unit concentration has returned to within 24 s-1 is 7.4 hours.
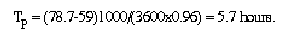
The flow at Birsfelden during the test was 1,068 m3/s (Spreafico and van Mazijk, 1993, p. 65) so the same procedure can be used to determine values a Birsfelden as:
Figure 15 contains a plot of these computed values along with observed data from (Spreafico and van Mazijk, 1993, p. 95). As can be seen from the plot, the timing is not good. Prediction of the solute velocity is the least reliable component of the procedures outlined herein. A major reason for this is that most rivers and streams have been modified so that the storage volume has increased. Equation 16 contains data from rivers with varying degrees of manmade storage and no easy way of quantifying this storage was available. Boning (1974) has presented a traveltime prediction equation that includes the effect of storage volumes if these are available. It may be about as easy, and far more accurate, to measure traveltimes as to accurately quantify the storage volumes.
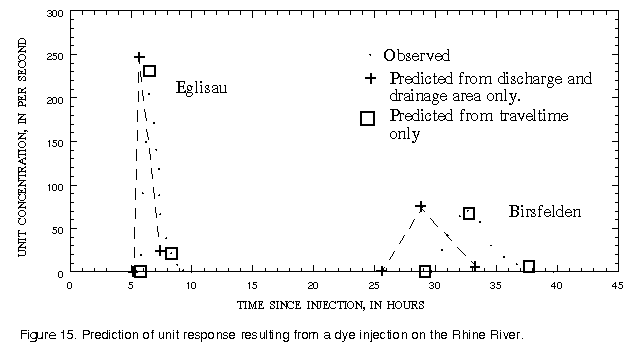
If the traveltime is available, the estimates can be much improved. For example, the traveltime of the peak concentration to Eglisau can be seen from figure 15 to be 6.5 hours, so time to the leading edge can be estimated as 0.89x6.5 = 5.8 hours (equation 18) and the unit-peak concentration can be estimated from equation 7 as 222 s-1. The time for the concentration to be reduced to 10 percent of the peak can be estimated from the duration given by equation 19 (2.5 hours) plus the time to the leading edge (5.8 hours) to be 8.3 hours. Likewise, reading the traveltime of the peak to Birsfelden from figure 15 as 32.7 hours, the time to the leading edge can be estimated as 29.1 hours, the unit-peak concentration as 65.4 s-1, and the time for the concentration to be reduced to 10 percent of the peak as 37.6 hours. The improved estimates (based traveltime to the peak concentration) are also shown on figure 15 for comparison with the observed data and estimates made without the benefit of traveltime information. The entire response function can be predicted with a high degree of accuracy when only the traveltime of the peak concentration is accurately known.
Another application of the linear superposition approach is for the simulation of buildup of soluble-pollutant concentrations in streams and estuaries using tracer tests (Bailey and others, 1966; Yotsukura and Kilpatrick, 1973). By this method, the response to a slug injection of a soluble tracer is assumed to imitate the characteristic of a soluble pollutant, and as such, can be used to simulate it.
The superposition approach has the advantage of simplicity and accuracy when applied to steady flow or to the exact flow conditions for which the response function was measured. Its weaknesses are that it can only be used with flow conditions for which it was derived and chemical interactions cannot easily be considered. The strengths of the numerical modeling approach are that it can account for unsteady flow conditions, and chemical reactions can be easily simulated if the reaction rate constants are known.
Kilpatrick and Cobb (1985) showed that the response curve of a continuous, constant-rate injection of tracer could be simulated by adding tracer-response curves from a sequence of single slug injections on the same stream, location, and discharge. For example, assume a series of slug injections of tracer (simulating a constant injection), each of mass, Mm, is injected in the stream depicted in figure 16. A repetition of the same responses downstream at the different times shown would result.
There would be a buildup to a constant plateau concentration as shown in figure 16. If discharge remained constant and the injection were continued long enough, the same would occur at every distance downstream, so that plateaus of concentration would ultimately exist at every downstream section.
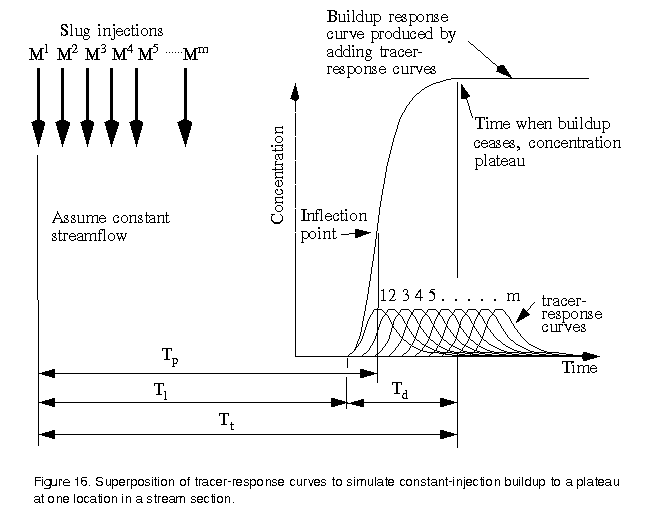
As can be seen on figure 16, in order for a plateau to be reached at any particular location, a constant injection must be maintained for a length of time equal to the duration of the tracer-response curve, Td. Similarly, the duration of the constant injection necessary to establish a plateau in the entire stream reach shown in figure 16 is dictated by the longest slug response duration at the most downstream location.
It becomes apparent that the tracer-response curve produced by a slug injection of tracer may be used as a building block with the superposition principle to simulate the buildup of a given pollutant in the stream. In fact, linearity permits the superposition of a variable loading of pollution to simulate the resulting response downstream. For convenience, it is practical to reduce all measured curves to UR curves using equation 4.
The results of example 2 provided three points on the unit-response curve, the time of the leading edge (51.1 hours), the time (55.2 hours) and magnitude (40 s-1) of the unit-peak concentration, and the time when the trailing edge has been reduced to 4 s-1 (65 hours). These three points are plotted on figure 17 along with a smooth curve drawn through the points. The ordinates of the smooth curve are given in table 1. Notice that the sum of the ordinates, 277.78 s-1, times the number of seconds between ordinates, 3,600, equals 1x10⁶.
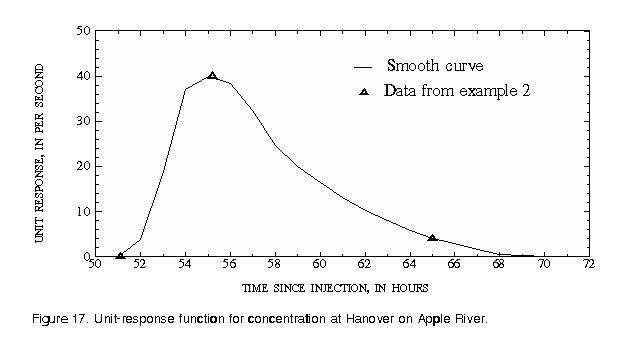
| Hour | Unit concentration |
Hour | Unit concentration |
Hour | Unit concentration |
|---|---|---|---|---|---|
52 53 54 55 56 57 |
3.7 18.78 37.0 40.0 38.5 32.4 |
59 60 61 62 63 64 |
19.9 16.4 13.2 10.2 8.0 5.8 |
66 67 68 69 70 71 Total |
2.9 1.5 0.5 0.2 0.1 0.0 277.78 |
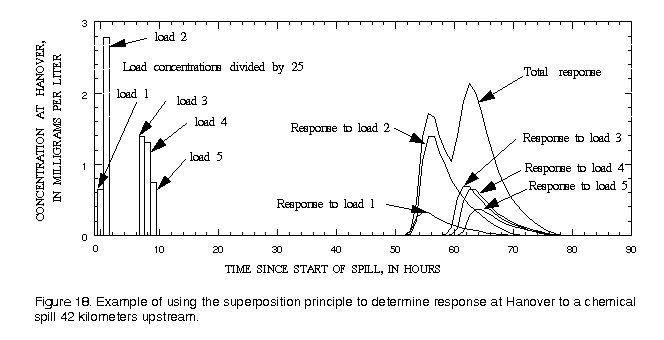
C = (3.7x300+18.78x70)x1x106/(1x106x8.5x1000) = 0.131+0.155 = 0.286 mg/L
in which 3.7 and 18.78 are the first two ordinates of the unit concentration response function (Cu in equation 4) and 300 and 70 (times 106) are the loads, in milligrams, at hour 1 and 0, respectively (Mr in equation 4). The loads, responses to each load, and resulting concentration at Hanover are tabulated in table 2 and plotted on figure 18.
| Time since spill (hour) |
Amount spilled (Kilogram) |
Response at Hanover | ||||||
|---|---|---|---|---|---|---|---|---|
| Time since spill (hour) |
Concentration to result from indicated load | |||||||
| Load 1 | Load 2 | Load 3 | Load 4 | Load 5 | Total | |||
1.0 2.0 3.0 4.0 5.0 6.0 7.0 8.0 9.0 |
300 150 140 80 |
52 53 54 55 56 57 58 59 60 61 62 63 64 65 66 67 68 69 70 71 72 73 74 75 76 77 78 79 80 |
0.030 0.155 0.305 0.329 0.317 0.267 0.203 0.164 0.135 0.109 0.084 0.066 0.048 0.033 0.024 0.012 0.004 0.002 0.001 0.0 |
0.0 0.131 0.663 1.306 1.412 1.359 1.144 0.872 0.702 0.579 0.466 0.360 0.282 0.205 0.141 0.102 0.053 0.018 0.007 0.004 0.0 |
0.0 0.065 0.331 0.653 0.706 0.679 0.572 0.436 0.351 0.289 0.233 0.180 0.141 0.102 0.071 0.051 0.026 0.009 0.004 0.002 0.0 |
0.0 0.061 0.309 0.609 0.659 0.634 0.534 0.407 0.328 0.270 0.217 0.168 0.132 0.096 0.066 0.048 0.025 0.008 0.003 0.002 0.0 |
0.0 0.035 0.177 0.348 0.376 0.362 0.305 0.232 0.187 0.154 0.124 0.096 0.075 0.055 0.038 0.027 0.014 0.005 0.002 0.001 0.0 |
0.030 0.286 0.968 1.635 1.729 1.626 1.347 1.101 1.229 1.685 2.042 2.112 1.912 1.570 1.228 0.963 0.747 0.571 0.441 0.334 0.242 0.172 0.112 0.061 0.026 0.010 0.004 0.001 0.0 |
As can be seen from either figure 18 or table 2, the maximum concentration at Hanover results from the second spill, which has a smaller initial load but a longer duration. The advantage of the superposition principle is its simplicity and its disadvantage is that it assumes steady flow. If unsteady flow conditions are present or if complex chemical reactions are to be simulated, a numerical model would be needed.
This report compiles information from a large number of time-of-travel and dispersion studies and presents empirical relations that appear to have general applicability. These relations are not recommended as a substitute for field studies but are believed to provide reasonable estimates in situations where adequate field data are not available. Empirical relations are given for the unit-peak concentrations, velocity of the peak concentration, velocity of the leading edge of a solute cloud, and the duration of the time of passage as measured from the leading edge to the point where the solute concentration has fallen to 10 percent of its peak value. It is shown how this information can be used to estimate the complete response function, which can then be used with the superposition principle to estimate the effect of multiple spills. The recommended methods are demonstrated by presenting four examples.
If the solute transport in the river is to be modeled, the model must be calibrated to provide the correct traveltimes and rates of attenuation of the peak concentration. The relations presented in this report can be used to calibrate a solute-transport model for use on a river that has little field data.
The relation for unit-peak concentration is the best defined of all the relations needed to predict the transport and dispersion of pollutants. Field data show that the peak concentration tends to decrease more rapidly with time than predicted by Fickian dispersion. Because almost all numerical models are based on the Fickian relation, model dispersion coefficients must be assumed to increase with time for the model results to duplicate observed data.
The relation for predicting mean stream velocity (traveltime) is the least accurately defined of all relations presented in this report. Traveltime information is, therefore, the most valuable information that can be collected to improve the ability to predict the transport and dispersion in a river. These data should be collected at two or more flows, preferably a low flow and a high flow.
Bailey, T.E., McCullough, C.A., and Gunnerson, C.G., 1966, Mixing and dispersion studies in San Francisco Bay: American Society of Civil Engineers proceedings, v. 92, no. SA5, p. 23-45.
Boning, C.W., 1974, Generalization of stream travel rates and dispersion characteristics from time of travel measurements: U.S. Geological Survey Journal of Research, v. 2, no 4, p. 495-499.
Eikenberry, S.E., and Davis, L.G., 1976, A technique for estimating the time of travel of water in Indiana streams: U.S. Geological Survey Water-Resources Investigations 9-76, 39 p.
Environmental Laboratory, 1990, CE-QUAL-RIV1, A dynamic, one-dimensional (longitudinal) water quality model for streams, users manual: Instruction report E-90-1, U.S. Army Engineer Waterways Experiment Station, Vicksburg, Miss., 249 p.
Feurstein, D.L., and Selleck, R.E., 1963, Fluorescent tracers for dispersion measurements: American Society of Civil Engineers proceedings, Journal of the Hydraulics Division, v. 90, no. SA3, p. 1-12.
Fischer, H.B., 1967, The mechanics of dispersion in natural streams: American Society of Civil Engineers proceedings, Journal of the Hydraulics Division, v. 93, no. HY6, p. 187-216.
Fread, D.L., 1977, The development and testing of a dam-break flood forecasting model: Dam-Break Flood Routing Model Workshop, Hydrology Committee, U.S. Water Resources Council, Bethesda, Md., Oct. 18-20, 1977, Proceedings, available from U.S. Department of Commerce, National Technical Information Service, Springfield, Va. 22151, No. PB-275 437, p. 164-197.
_____ 1984, DAMBRK: The NWS dam-break flood forecasting model: Office of Hydrology, National Weather Service, Silver Spring, Md.
Godfrey, R.G., and Frederick, B.J., 1970, Stream dispersion at selected sites: U.S. Geological Survey Professional Paper 433K, 38 p.
Graf, J.B., 1986, Traveltime and longitudinal dispersion in Illinois streams: U.S. Geological Survey Water-Supply Paper 2269, 65 p.
Hetling, L.J., and O'Connell, R.L., 1966, A study of tidal dispersion in the Potomac River: Water Resources Research, v. 2, no. 4, p. 825-841.
Jobson, H.E., 1987, Users manual for a branched Lagrangian transport model: U.S. Geological Survey Water-Resources Investigations Report 87-4163, 80 p.
_____ 1989, Users manual for an open-channel streamflow model based on the diffusion analogy: U.S. Geological Survey Water-Resources Investigations 89-4133, 73 p.
Kilpatrick, F.A., 1993, Simulation of soluble waste transport and buildup in surface waters using tracers: U.S. Geological Survey Techniques of Water-Resources Investigations, book 3, chap. A20, 37 p.
Kilpatrick, F.K., and Cobb, E.D., 1985, Measurement of discharge using tracers: U.S. Geological Survey Techniques of Water-Resources Investigations, book 3, chap. A16, 52 p.
Kilpatrick, F.A., and Taylor, K.R., 1986, Applications of dispersion data: Water Resources Bulletin of the American Water Resources Association, v. 22, no. 4, p. 537-548.
Kilpatrick, F.A., and Wilson, J.F., Jr., 1989, Measurement of time of travel and dispersion in streams by dye tracing: U.S. Geological Survey Techniques of Water-Resources Investigations, book 3, chap. A9, 27 p.
Linsley, R.K., Kohler, M.A., and Paulhus, J.L.H., 1958, Applied Hydrology: McGraw-Hill, New York, 340 p.
Martens, L.A., and others, 1974, Time-of-travel of solutes in the Mississippi River from Baton Rouge to Pointe a la Hache, Louisiana: Louisiana Department of Public Works Water-Resources Technical Report, No. 1, 1 sheet.
Nordin, C.F., Jr., and Sabol, G.V., 1974, Empirical data on longitudinal dispersion in rivers: U.S. Geological Survey Water-Resources Investigations 20-74, 332 p.
Schaffranek, R.W., Baltzer, R.A., and Goldberg, D.E., 1981, A model for simulation of flow in singular and interconnected channels: U.S. Geological Survey Techniques of Water-Resources Investigations, book 7, chap. C3, 110 p.
Scott, C.H., Norman, V.W., and Fields, F.K., 1969, Reduction of fluorescence of two-tracer dyes by contact with a fine sediment, in Geological Research, 1969: U.S. Geological Survey Professional Paper 650-B, p. B164-B168.
Seaber, P.R., Kapinos, F.P., and Knapp, G.L., 1984, State Hydrologic Unit Maps: U.S. Geological Survey Open-File Report 84-708, 22 p.
Smart, P.L., and Laidlaw, I.M.S., 1977, An evaluation of some fluorescent dyes for water tracing: Water Resources Research, v. 13, no. 1, p. 15-33.
Spreafico, M., and van Mazijk, A., eds., 1993, Alarm model `Rhine', a model for the operational prediction of the transport of pollutants in the river Rhine: International Commission for the Hydrology of the Rhine Basin (ICHR), CHR Report No. I-12, 122 p.
Tai, D.Y., and Rathbun, R.E., 1988, Photoanalysis of rhodamine-WT dye: Chemosphere, v. 17, no. 3, p. 559-573.
Taylor, K.R., James, R.W., Jr., and Helinsky, B.M., 1986, Travel-time and dispersion in the Shenandoah River and its tributaries, Waynesboro, Virginia, to Harpers Ferry, West Virginia: U.S. Geological Survey Water-Resources Investigations Report 86-4065, 60 p.
van der Leeden, Frits, Troise, F.L., and Todd, D.K., 1990, The Water Encyclopedia: Lewis Publishers, Inc., Chelsea, Mich., 808 p.
Wilson, J.F., Jr., Cobb, E.D., and Kilpatrick, F.A., 1986, Fluorometric procedures for dye tracing: U.S. Geological Survey Techniques of Water-Resources Investigations, book 3, chap. A12, 34 p.
Yotsukura, Nobuhiro, Fischer, H.B., and Sayre, W.W., 1970, Measurement of mixing characteristics of the Missouri River between Sioux City, Iowa, and Plattsmouth, Nebraska: U.S. Geological Survey Water-Supply Paper 1899-G, p. G1-G29.
Yotsukura, Nobuhiro, and Kilpatrick, F.A., 1973, Tracer simulation of soluble waste concentration: American Society of Civil Engineers, Journal of the Environmental Engineering Division, v. 99, no. EE4, Proceedings Paper 9947, p. 499-515.
Some data, particularly slope, drainage area, and mean annual flow, are not available in the listed references. When slope was missing from the referenced report, it was estimated from topographic maps. Generally, a map scale of 1/25,000 was used for short reaches in the small streams and a map scale of 1/100,000 was used for long reaches of large rivers.
When the drainage area and mean annual flow were missing from the referenced reports, they were generally determined from data contained in annual reports published by the Geological Survey (Water Resources Data STATE Water Year XXX). These reports give daily mean discharge, river mile, and drainage area at each gage operated by the Geological Survey. Generally one or more gaging stations were located on the river within a study reach. Drainage areas at specific cross sections were estimated by assuming that the logarithm of the drainage area varied linearly with the river mile between points of known drainage area. In some cases, where the study reach extended downstream of an available Geological Survey gage, the drainage area of the entire basin (at river mile 0.0) was determined from the State Hydrologic Unit Maps (Seaber and others, 1984). In a very few cases the drainage area was measured from a topographic map.
The mean annual discharge at specific cross sections was computed by assuming that the discharge was proportional to drainage area for the reach between available gages. In the case of the Mississippi River below Baton Rouge, La., the mean flow was assumed to be two-thirds of the mean flow at Vicksburg, Miss., because the U.S. Army Corps of Engineers diverts one-third of the flow in the Mississippi River to the Atchafalaya River above Baton Rouge.
The column headings in the tables are brief in order to save space. The following is a more complete description of the data contained in tables:
Adams, D.B., 1974, Time of travel and dye dosage for an irrigation canal system near Duchesses, Utah: Journal of Research, v. 2, no. 4, p. 489-493.
Arthur, J.K., 1978, Quality of water and time of solute travel in Tallahala Creek near Laurel, Mississippi: U.S. Geological Survey Open-File Report 78-1000, 47 p.
Balding, G.O., 1970, Data on dye dispersion in a reach of the Sacramento River near Red Bluff, California: U.S. Geological Survey Open-File Report, Menlo Park, Calif., 9 p.
Bauer, D.P., 1968, Time of travel of water in the Great Miami River, Dayton to Cleves, Ohio: U.S. Geological Survey Circular 546, 15 p.
Bednar, G.A., 1980, Quality of water and time of travel in Yockanookany River Choctaw County, Mississippi: U.S. Geological Survey Open-File Report 80-770, 37 p.
_____ 1980, Quality of water and time of travel in Hobolochitto Creek, Pearl River County, Mississippi: U.S. Geological Survey Open-File Report 80-0203, 40 p.
_____ 1981, Quality of water and time of travel in part of Tillatoba Creek basin, Mississippi, October 1974 to September 1980: U.S. Geological Survey Open-File Report 81-0825, 93 p.
Bednar, G.A., and Morris, F., III, 1978, Quality of water and time of travel in Pearl River, Jackson to Byram, Mississippi: U.S. Geological Survey Open-File Report 78-1032, 85 p.
_____ 1978, Quality of water and time of travel in Pearl River, Jackson to Byram, Mississippi: U.S. Geological Survey Open-File Report 78-1032, 85 p.
Bowie, J.E., and Petri, L.R., 1969, Travel of solutes in the Lower Missouri River: U.S. Geological Survey Hydrologic Investigations Atlas HA-332.
Buchanan, T.J., 1964, Time of travel of soluble contaminants in streams: Journal of the Sanitary Engineering Division, Proceedings of American Society of Civil Engineers, v. 90, no. SA3, p. 1-12.
_____ 1968, Comparison of flood-wave and water-particle traveltimes, in Chase, E.B., and Payne, F.N., compilers, Selected techniques in water-resources investigations, 1966-67: U.S. Geological Survey Water-Supply Paper 1892, p. 34-36.
Calandro, A.J., 1976, Time of travel of solutes in Mississippi River from the Arkansas-Louisiana state line to Plaquemine, Louisiana: Water Resources Technical Report 12, Published by Louisiana Department of Transportation and Development, Office of Public Works, Baton Rouge, La., 5 p.
_____ 1977, Time of travel of solutes in Mississippi River from Belle Chasse to the vicinity of Head of Passes, Louisiana: Water Resources Technical Report 13, Published by Louisiana Department of Transportation and Development, Office of Public Works, Baton Rouge, La., 5 p.
_____ 1981, Time of travel of solutes for the Vermilion River, Louisiana: U.S. Geological Survey Open-File Report 81-1065, 21 p.
Cervione, M.A., 1972, Time-of-travel of dye in Quinnipiac River, Connecticut: Connecticut Department of Environmental Protection Bulletin No. 2.
Childress, C.J., 1985, Time of travel, water quality, and bed-material quality in the Cuyahoga River within the Cuyahoga Valley National Recreation Area, Ohio: U.S. Geological Survey Water-Resources Investigations Report 85-4065, 49 p.
Day, T.J., 1975, Longitudinal dispersion in natural channels: Water Resources Research, v. 11, p. 909-918.
Dyar, T.R., Tasker, G.D., Wait, R.L., and others, 1972, Hydrology of the Riceboro area, coastal Georgia: Report to Georgia Water Quality Control Board and Interstate Paper Corporation by U.S. Geological Survey, p. 43-70.
Everett, D.E., 1971, Curves showing time of travel and passage time of a contaminant at downstream locations in the Mississippi River below Baton Rouge, Louisiana: U.S. Geological Survey Open-File Report 71-0096, 1 p.
Fischer, H.B., 1968, Methods for predicting dispersion coefficients in natural streams, with application to lower reaches of the Green and Duwamish Rivers, Washington: U.S. Geological Survey Professional Paper 582-A, 27 p.
Godfrey, R.G., and Frederick, B.J., 1963, Dispersion in natural streams: U.S. Geological Survey Open-File Report, Washington, D.C., 75 p.
Gain, W.S., 1990, Time-of-travel of solutes in the Trinity River from Dallas to Trinidad, Texas, May and August 1987: U.S. Geological Survey Open-File Report 89-0614, 1 map page.
Gardner, R.A., 1985, Data collection for a time-of-travel and dispersion study on the Coosa River near Childersburg, Alabama: U.S. Geological Survey Open-File Report 85-0411, 65 p.
_____ 1986, Time-of-travel and reaeration data for seven small streams in Alabama, June 1983 to August 1984: U.S. Geological Survey Open-File Report 86-0312, 17 p.
Harris, D.D., 1968, Travel rates of water for selected streams in the Williamette River Basin, Oregon: U.S. Geological Survey Hydrologic Investigations Atlas HA-273, 2 sheets.
Harris, D.D., and Sanderson, R.B., 1968, Use of dye tracers to collect hydrologic data in Oregon: American Water Resources Association Bulletin, Urbana, Ill., v. 4, no. 2, p. 51-68.
Horwitz, G.M., and Anderson, P.W., 1966, Time-of-travel measurements on the Passaic and Pompton Rivers, New Jersey: U.S. Geological Survey Professional Paper 550-B, p. B199-B203.
Hubbard, E.F., and Stamper, W.G., 1972, Movement and dispersion of soluble pollutants in the Northeast Cape Fear estuary, North Carolina: U.S. Geological Survey Water-Supply Paper 1873, 31 p.
Jack, A.R., 1986, Traveltime and dispersion of a soluble dye in the South Branch Potomac River, Petersburg to Greenspring, West Virginia: U.S. Geological Survey Water-Resources Investigations Report 84-4167.
James, R.W., Jr., and Helinsky, B.H., 1984, Time of travel and dispersion in the Jones Falls, Baltimore, Maryland: U.S. Geological Survey Water-Resources Investigations Report 84-4203, 29 p.
Kalkhoff, S.J., 1981, Quality of water and time of travel in Goodwater and Okatoma Creeks near Magee, Mississippi: U.S. Geological Survey Open-File Report 81-1012, 39 p.
_____ 1981, Quality of water and time of travel in Little Copian Creek near Crystal Springs, Mississippi: U.S. Geological Survey Open-File Report 81-1069, 31 p.
_____ 1982, Quality of water and time of travel in Bakers Creek near Clinton, Mississippi: U.S. Geological Survey Open-File Report 82-0427, 55 p.
Kauffman, C.D., Jr., 1982, Time-of-travel and dispersion studies, Lehigh River, Francis E. Walter Lake to Easton, Pennsylvania: U.S. Geological Survey Open-File Report 82-0861, 36 p.
Kauffman, C.D., Jr., Armbruster, J.T., and Voytik, Andrew, 1976, Time-of-travel studies Susquehanna River, Binghamton, New York, to Clarks Ferry, Pennslyvania: U.S. Geological Survey Open-File Report 76-0247, 18 p.
Kilpatrick, F.A., 1972, Automatic sampler for dye tracer studies: Water Resources Research, v. 8, no. 3, p. 737-742.
Kilpatrick, F.A., and Cobb, E.D., 1985, Measurement of discharge using tracers: U.S. Geological Survey Techniques of Water-Resources Investigations, book 3, chap. A16, 52 p.
Kolpin, D.W., and Kalkhoff, S.J., 1992, Time of travel and dispersion in a selected reach of Roberts Creek, Clayton County, Iowa: U.S. Geological Survey Water-Resources Investigations Report 91-4145, 16 p.
Laenen, Antonius, and Woo, W.H., 1994, Stream velocities and reaeration coefficients for the South Umpqua River between Tiller and Roseburg: U.S. Geological Survey Water-Resources Investigations Report 92-4191, 26 p.
Lamb, T.E., 1982, Time of travel of selected Arkansas streams: U.S. Geological Survey Water-Resources Investigations Report 82-4048, 64 p.
Limerinos, J.T., 1967, Data for time-of-travel study of Eel River, California: U.S. Geological Survey Open-File Report, Menlo Park, Calif., 38 p.
_____ 1967, Time-of-travel study of Mad River, California: U.S. Geological Survey Open-File Report, Menlo Park, Calif., 20 p.
_____ 1967, Time-of-travel study of Trinity River, California: U.S. Geological Survey Open-File Report, Menlo Park, Calif., 26 p.
Lindskov, K.L., 1974, Movement and dispersion of soluble materials in Salem Creek, Muddy Creek, and Yadkin River between Winston-Salem and Salisbury, North Carolina: U.S. Geological Survey Water-Resources Investigations, No. 6-74, 30 p.
Lowham, H.W, 1982, Streamflows and channels of the Green River Basin, Wyoming: U.S. Geological Survey Water-Resources Investigations 81-71, 73 p.
Lowham, H.W., and Wilson, J.F., Jr., 1971, Preliminary results of time-of-travel measurements on Wind/Bighorn Rivers from Boysen Dam to Greybull, Wyoming: U.S. Geological Survey Open-File Report 71-0185, 7 p.
Lowry, M.E., Lowham, H.W., and Lines, G.C., 1976, Water resources of the Bighorn Basin, northwestern Wyoming: U.S. Geological Survey Hydrologic Investigations Atlas HA-512, 2 sheets.
Marie, J.R., and Davis, L.G., 1974, Water Resources of the Middle Wabash River Basin, Indiana: U.S. Geological Survey Hydrologic Investigations Atlas HA-508, 3 sheets.
Martens, L.A., and others, 1974, Time of travel of solutes in the Mississippi River from Baton Rouge to Pointe a la Hache, Louisiana: Louisiana Department of Public Works Water Resources Technical Report, No. 9, 1 sheet.
Mills, W.B., 1972, Travel time for solutes, upper Sabine River basin, Texas, April 16-30, 1972: U.S. Geological Survey Open-File Report 72-0257, 2 sheets.
Morris, F., III, 1978, Quality of water and time of travel in the Pearl River, Byram to near Terry, Mississippi: U.S. Geological Survey Open-File Report 78-0909, 62 p.
Morton, R.J., 1962, Status report no. 3 on Clinch River study: Health Physics Divivision, Oak Ridge National Laboratory, Oak Ridge, Tenn., p. 88-111.
_____ 1962, Status report no. 4 on Clinch River study: Health Physics Division, Oak Ridge National Laboratory, Oak Ridge, Tenn., p. 61-76.
_____ 1962, Status report no. 5 on Clinch River study: Health Physics Division, Oak Ridge National Laboratory, Oak Ridge, Tenn., p. 108-129.
_____ 1962, Status report no. 6 on Clinch River study: Health Physics Division, Oak Ridge National Laboratory, Oak Ridge, Tenn., p. 42-58.
Myers, D.R., and Slade, R.M., Jr., 1976, Time of travel of solutes in the East Fork Trinity River, November 1975; and Elm Fork Trinity River, December 1975: Trinity River basin, Texas: U.S. Geological Survey Open-File Report 76-0683, map.
Nelson, J.L., Perkins, R.W., and Haushild, W.L., 1966, Determination of Columbia River flow time downstream from Pasco, Washington, using radioactive tracers introduced by the Hanford reactors: Water Resources Research, v. 2, no. 1, p. 31-39.
Nichols, W.J., Reed, B.M., and Greenlaw, F.W., 1981, Time-of-travel studies for the Little Androscoggin River, Maine: U.S. Geological Survey Open-File Report 81-0640, 18 p.
Nordin, C.F., Jr., and Troutman, B.M., 1980, Longitudinal dispersion in rivers: the persistence of skewness in observed data: Water Resources Research, v. 16, p. 123-128.
Ollman, R.H., 1975, Time-of-travel of solutes in the Trinity River basin, Texas, September 1973 and July-August 1974: U.S. Geological Survey Open-File Report 75-0558, 3 map sheets.
Parker, G.W., 1980, Time of travel in the Presumpscot River basin, Maine: U.S. Geological Survey Open-File Report 80-0570, 24 p.
_____ 1981, Time of travel in the Sebasticook River basin, Maine: U.S. Geological Survey Open-File Report 81-0545, 54 p.
Parker, G.W., and Hunt, G.S., 1983, Initial assessment of time of travel and mixing through Gulf Island pond and the lower Androscoggin River, Maine: U.S. Geological Survey Water-Resources Investigations Report 83-4020, 60 p.
Parker, G.W., Westerman, G.S., Hunt, G.S., and Morrill, G.L., 1983, Time of travel and dispersion study in the Androscoggin River basin, Maine: U.S. Geological Survey Water-Resources Investigations Report 83-4232, 135 p.
Petri, L.R., 1984, Time-of-travel data for Nebraska streams, 1968 to 1977: U.S. Geological Survey Open-File Report 84-0602, 69 p.
Pettijohn, R.A., and Davis, L.G., 1973, Water Resources of the Maumee River basin, northeastern Indiana: U.S. Geological Survey Hydrologic Investigations Atlas HA-493, 3 sheets.
Rathbun, R.E., Kennedy, V.C., and Culberson, J.K., 1971, Transport and dispersion of fluorescent tracer particles for the flat-bed condition, Rio Grande conveyance channel near Bernardo, New Mexico: U.S. Geological Survey Professional Paper 562-I, 56 p.
Runner, G.S., 1963, Kanawha River Basin time-of-travel study: U.S. Geological Survey Open-File Report, Charleston, W.Va., 20 p.
Searcy, J.K., and Davis, L.C., Jr., 1961, Time of travel of water in the Potomac River, Cumberland to Washington: U.S. Geological Survey Circular 438, 12 p.
Schuster, J.C., 1965, Canal discharge measurements with radioisotopes: American Society of Civil Engineers, Journal of the Hydraulics Division, v. 91, no. HY2, p. 101-124.
Simpson, E.S., Beethaam, W.A., and Ruggles, F.H., 1959, Hydrologic and tracer studies in the Mohawk River at Knolls Atomic Power laboratory: AEC Research and Development Report, no. SO-45, 285 p.
Stall, J.B., and Hiestand, D.W., 1969, Provisional time of travel for Illinois streams: Illinois State Water Survey Report of Investigations, no. 63, 321 p.
Steacy, R.E., 1961, Time of travel of water in the Ohio River, Pittsburgh to Cincinnati: U.S. Geological Survey Circular 439, 14 p., 8 fig.
Stewart, M.R., 1967, Time of travel of solutes in Mississippi River from Baton Rouge to New Orleans, Louisiana: U.S. Geological Survey Hydrologic Investigations Atlas HA-260, 3 sheets.
Tate, C.H., Davis, L.G., Johnson, L.E., and Pettijohn, R.A., 1973, Water resources of the Upper Wabash River basin, northeastern Indiana: U.S. Geological Survey Hydrologic Investigations Atlas HA-433, 3 sheets.
Taylor, K.R., and Solley, W.B., 1971, Traveltime and concentration attenuation of a soluble dye in Antietam and Coinococheague Creeks, Maryland: Maryland Geological Survey Information Circular, No. 12, 25 p.
Wagner, L.A., and Hamecher, P.H., 1975, Time of travel and dye dispersion in La Chute and Lake Champlain, northeastern New York: U.S. Geological Survey Open-File Report 75-0639, 16 p.
Westfall, A.O., 1976, Travel time of solutes in selected reaches of the Sandusky River basin, Ohio, 1972-1973: available from U.S. Department of Commerce, National Technical Information Service, Springfield, Va. 22151, No. PB-273 109/AS, 69 p.
_____ 1977, Travel time of solutes in selected reaches of Ohio streams, 1973 and 1975: available from U.S. Department of Commerce, National Technical Information Service, Springfield, Va. 22151, No. PB-81 230 393, 67 p.
Westfall, A.O., and Webber, E.E., 1977, Time of travel of solutes in the Tuscarawas River basin, Ohio, August and September, 1974: U.S. Geological Survey Water-Resources Investigations 77-0023, 7 p.
White, K.E., and Kratzer, T.W., 1993, Traveltime in the Delaware River, Hancock, New York, to the Delaware Water Gap by use of a conservative dye tracer: U.S. Geological Survey Water-Resources Investigations Report 93-4203, 54 p.
Wilson, J.F., Cobb, E.D., and Yotsukura, N., 1969, Movement of a solute in the Potomac River estuary at Washington, D.C.: U.S. Geological Survey Circular 529-B, 14 p.
Wilson, J.F., Jr., and Forrest, W.E., 1965, Potomac River time-of-travel measurements, in Ichiye, Takashi, Symposium on diffusion in oceans and fresh waters: Palisades, N.Y., Lamont Geol. Observatory, Proc. Lamont Geol. Observatory of Columbia University, p. 1-18.
Wilson, J.F., and McAvoy, R.L., 1967, Water movement (in the Patuxent River basin), in Crooks, J.W., O'Bryan, Deric, and others, eds., Water Resources of the Patuxent River basin, Maryland: U.S. Geological Survey Hydrologic Investigations Atlas HA-244, sheet 5.
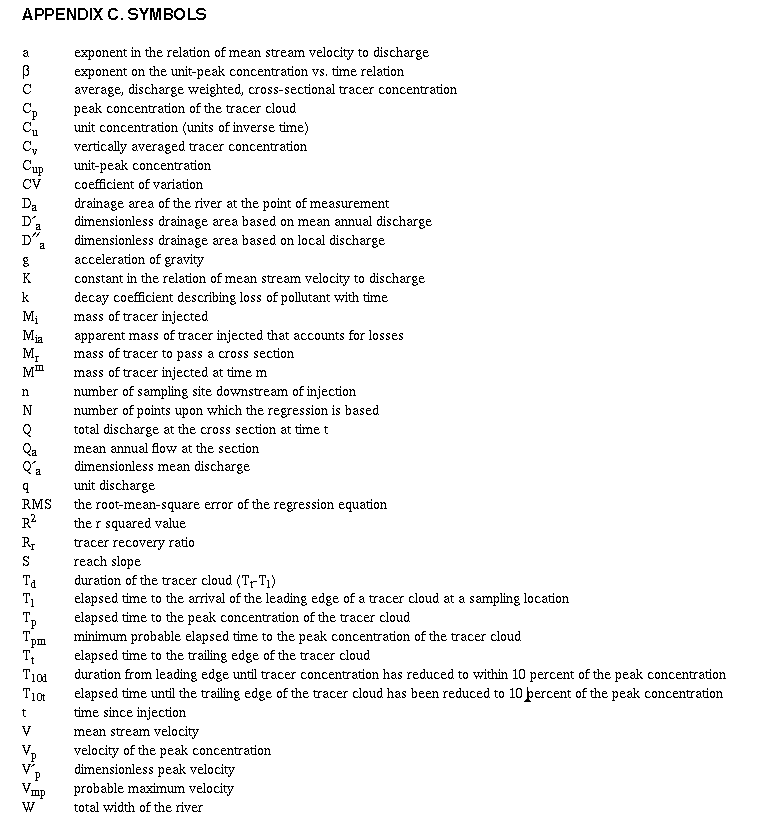

![]() U.S. Department of the Interior |
U.S. Geological Survey
U.S. Department of the Interior |
U.S. Geological Survey
URL: http://pubsdata.usgs.gov/pubs/wri/1996/4013/documents/dispersion.html
Page Contact Information: GS Pubs Web Contact
Page Last Modified: Wednesday, 07-Dec-2016 13:29:42 EST
