
By Valerie J. Kelly, Richard P. Hooper, Brent T. Aulenbach, and Mary Janet
Station Network || Sampling Strategy || Constituents
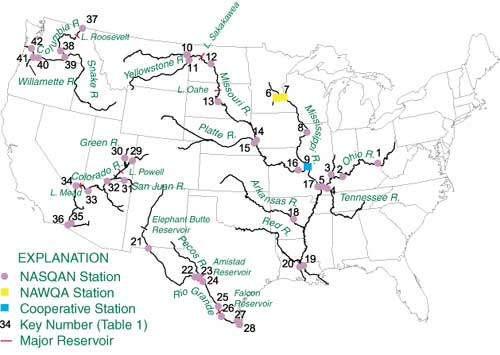
During 1996-2000, the NASQAN network consisted of 39 stations located along the main stems and on the major tributaries of four large rivers (Figure 1, Table I). This report also includes data from three additional stations, depicted in Figure 1 with different color symbols, where the constituent coverage was similar to that at the NASQAN stations (excluding dissolved and suspended trace elements). All other data for these stations are comparable to NASQAN data because similar sample-collection and sample-processing techniques were used, and the same laboratory performed all chemical analyses. Although water-quality sampling generally began in WY96 (water year 1996), sampling was delayed at a few stations until WY97 or, in one case, WY98, as indicated in Table I. Further information on the location of NASQAN stations is provided in (Table 2). Data files containing station information, as well as land use (Vogelmann and others, 2001) and population density are also available.
The locations of NASQAN stations were generally selected where large differences in mass flux were expected or where inputs and outputs of major reservoirs could be measured. The average area of the subbasins defined by NASQAN stations varies among the river basins: subbasin area averages approximately 70,000 mi2 (180,000 km2) in the Mississippi, 39,000 mi2 (100,000 km2) in the Columbia, 30,000 mi2 (78,000 km2) in the Colorado, and 23,000 mi2 (60,000 km2) in the Rio Grande. The smaller subbasin areas in the Colorado and Rio Grande result from the requirement to measure the inflows and outflows to large mainstem reservoirs such as Lake Mead and Amistad Reservoir (Figure 1). Stream discharge also was continuously measured either at the same location or at a nearby station where conditions make gaging and chemical sampling difficult to co-locate (Table I). At most NASQAN sites, the USGS operates the gaging station. At some sites, other agencies are responsible for stream-discharge data: along the Rio Grande, the International Boundary and Water Commission operates the stream-gaging stations; at selected sites in the Columbia, the lower Mississippi, and the Tennessee River basins, the U.S. Army Corps of Engineers is responsible for these data.
 |
The objective of estimating annual flux guided the sampling strategy and many other aspects of operating the NASQAN network. Gilroy and others (1990) developed a regression-based approach for estimating annual flux. Typically, the explanatory variables in these models are stream discharge and day-of-year (for modeling seasonal effects on concentration). Therefore, the year was divided into 4-5 hydrologic seasons, defined primarily by considerations of the water source and when constituents of interest, such as pesticides/herbicides, were expected to be present in the river. The general strategy was that sampling should cover at least 80% of the typical range of discharge within each hydrologic season. Sampling was biased towards wet seasons and high flow to obtain greater resolution of flux variations when the majority of the annual transport occurs. Because large rivers have fairly predictable seasonal discharge patterns and because storm hydrographs persist for days rather than hours, it was possible to tentatively plan the timing in advance for the majority of samples, such as scheduling the week in which the sample will be collected.
Sampling frequency varied among stations on the basis of the hydrologic setting of the station. For stations on freely flowing reaches, generally a total of 15 samples were collected annually, of which 12 were scheduled in advance, and 3 were reserved for high-discharge conditions. The scheduled samples were collected at roughly fixed intervals during each season, but the frequency varies among season. For example, in the Mississippi River Basin, samples were collected every 2 weeks during peak runoff periods, but only every 6 weeks during low discharge periods in the winter. Fewer samples were collected at stations immediately downstream from reservoirs, where concentrations were less variable. Each basin had a coordinator to determine which flow conditions should be sampled. The basin coordinator also could shift collection of samples among sites, if necessary, due to unusual conditions.
The sampling coverage during water years 1996-2000 for four stations is shown in Figure 2. The Mississippi River at Saint Francisville, Louisiana (Figure 2A) is an example of a station on a large, unregulated river where there are only a few high-flow events that last weeks to months every year. The other figures exemplify a snowmelt-dominated site (Figure 2B), a highly controlled site downstream from a reservoir (Figure 2C), and a smaller river site that is characterized by many small storms imposed on a broad seasonal pattern of low and high flow (Figure 2D). NASQAN sampling effectively covered nearly the full range of annual discharge. However, individual storms that produced short-duration runoff were not sampled with sufficient intensity to evaluate possible hysteresis or lag effects on constituent concentration in relation with flow. Hydrographs with sampling coverage are available for all stations in the Results section of this report.
A broad suite of constituents was measured at all stations, including suspended sediment, major ions, nutrients, dissolved trace elements, suspended sediment chemistry, selected dissolved pesticides, and field parameters. Analytical protocols for NASQAN are uniformly well established by the USGS National Water Quality Laboratory (NWQL), reproducible, and amenable to a large-scale production laboratory.
Continue to Methods or Return to Table of Contents