![]()
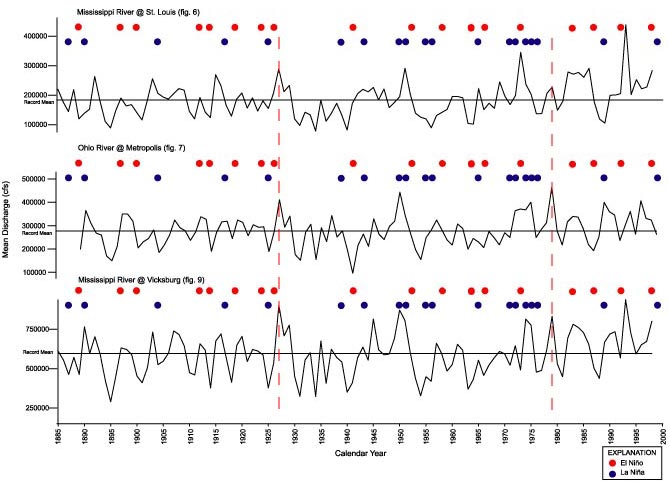
Figure 16. Mean annual discharge through time at three gaging stations - the Mississippi River at St. Louis and Vicksburg, and the Ohio River at Metropolis - showing El Niño (red dots) and La Niña (blue dots) events from figure 4. Dashed vertical lines track similarities between
the records; the horizontal line in each record represents the mean discharge for the entire record. cfs, cubic feet per second.
U.S. Geological Survey, U.S. Department of the Interior
This page is https://pubs.usgs.gov/bulletin/b2187/figure16.html
Contact: Harry Dowsett (hdowsett@usgs.gov)
Last modified 09.07.01 (krw)
This page is https://pubs.usgs.gov/bulletin/b2187/figure16.html
Contact: Harry Dowsett (hdowsett@usgs.gov)
Last modified 09.07.01 (krw)