![]()
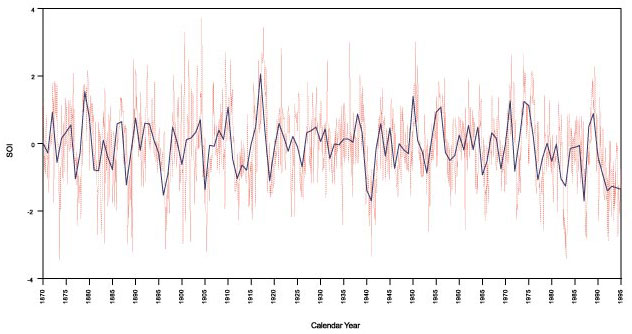
Figure 18. The mean annual Southern Oscillation Index (SOI) in blue and the monthly SOI in red, 1870-1995. See text section, "ENSO Events and Discharge Records."
U.S. Geological Survey, U.S. Department of the Interior
This page is https://pubs.usgs.gov/bulletin/b2187/figure18.html
Contact: Harry Dowsett (hdowsett@usgs.gov)
Last modified 09.07.01 (krw)
This page is https://pubs.usgs.gov/bulletin/b2187/figure18.html
Contact: Harry Dowsett (hdowsett@usgs.gov)
Last modified 09.07.01 (krw)