Contaminants in the Mississippi River
U.S. GEOLOGICAL SURVEY CIRCULAR 1133
Reston, Virginia, 1995
Edited by Robert H. Meade
Setting: Geology, Hydrology, Sediments, and Engineering of the
Mississippi River
By Robert H. Meade
Geologic Settings
 (Click on image for a larger version, 132K)
Figure 4. -- The Mississippi River follows the trend
of an ancient continental rift system down the center of North
America, flowing through different landscapes that record different
geologic histories (Redfern, 1983). Three vignettes (A, B, and C) in
this figure exemplify some of the different processes that shaped the
landscapes during the latest ice ages and during the 10,000 years
since the ice melted away.
-
A
-
The Upper Mississippi River ("Upper" is conventionally
assigned to the Mississippi above its confluence with the Ohio) flows
for much of its length through a valley 1-10 km wide between bluffs
that stand 50-100 m above the river and its fringing flood plain. The
painting, done in 1844 by John Casper Wild, shows the bluffs above the
confluence of the Minnesota (left) and Mississippi (right) Rivers, at
the site of Fort Snelling, which is now included in the city of
Minneapolis. The bluff-bordered river valleys here and farther down
the Upper Mississippi were formed by a combination of glacial and
riverine processes. The great ice ages of the Pleistocene epoch gave
the basin of the Upper Mississippi much of the shape that we consider
characteristic today. Pre-existing river valleys were widened and
deepened by the ice as it pushed its way south. Between and after the
ice ages, the rivers transported and rearranged the sediments in the
valleys by meandering across them and constructing islands and flood
plains. The main valley in the painting (upper left to lower right)
formed mostly when the ice-age predecessor to the Minnesota River
(called Glacial River Warren) was the main outlet of a large lake, Lake
Agassiz, that was dammed along its northern margin in southern Canada
by the retreating ice sheet. The small notch out of which the
Mississippi River is flowing (upper right in painting) was cut, mostly
after the demise of Glacial River Warren, by a retreating headcut that
can be seen today at St. Anthony Falls, 13 km upriver of the
confluence with the Minnesota River.
-
B
-
The Lower Mississippi River flows along and through a wide alluvial
plain formed by the river and its predecessors. Vignette B (taken
from R.T. Saucier, 1991) shows the contrast in stream patterns between
those formed during the latest ice age (left) and those formed since
the ice ages. Typical of glacial meltwater rivers heavily laden with
coarser sediments are the so-called "valley trains" like
those shown in the western half of the vignette. Even though no great
river has flowed there for thousands of years, the braided and
anastomosing pattern still shows on the landscape and is clearly
visible from the air. The present pattern, in which the Mississippi
River meanders through a belt 20-30 km wide defined by the traces and
remnants of older meanders through which the river once flowed, is
typical of most of the length of the lower river.
-
C
-
Where the Mississippi River meets the Gulf of Mexico, its delta has a
complex history that has been described in classic papers by C.R. Kolb
and J.R. Van Lopik (1958, 1966). The succession of different river
channels and delta lobes during the last 5,000 years are numbered from
oldest (1) to youngest (7) in Vignette C. Let John McPhee (1989,
p. 5-6) recount the story:
"Southern Louisiana exists in its present form because the
Mississippi River has jumped here and there within an arc about two
hundred miles wide, like a pianist playing with one hand-frequently
and radically changing course, surging over the left or the right bank
to go off in utterly new directions. Always it is the river's purpose
to get to the Gulf by the shortest and steepest gradient. As the
mouth advances southward and the river lengthens, the gradient
declines, the current slows, and sediment builds up the bed.
Eventually, it builds up so much that the river spills to one side.
Major shifts of that nature have tended to occur roughly once a
millennium. The Mississippi's main channel of three thousand years
ago is now the quiet water of Bayou Teche [3], which mimics the shape
of the Mississippi......Eight hundred years before the birth of
Christ, the channel was captured from the east [4]. It shifted
abruptly and flowed in that direction for about a thousand years. In
the second century A.D., it was captured again, and taken south, by
the now unprepossessing Bayou Lafourche [5], which, by the year 1000,
was losing its hegemony to the river's present course, through the
region that would be known as Plaquemines [6, 7]."
Water Discharge

(Click on image for a larger version, 99K)
Figure 5. -- The Mississippi River discharges an
average of 520 cubic kilometers of water each year past the cities of
Vicksburg and Natchez, Mississippi. This represents the greatest
amount of water discharged by the river while it still is confined to
a single channel, but it does not represent all water that the
Mississippi River system discharges to the Gulf of Mexico. The river
bifurcates 77 km below Natchez, and the lesser of its two main
distributaries is joined by another significant tributary, the Red
River. The two outlets of the Mississippi River eventually discharge
a combined average of 580 cubic kilometers per year (or about 420
billion gallons per day) of freshwater to the Gulf of Mexico. This
discharge ranks seventh in the world, being exceeded only by those of
the Amazon, Congo (or Zaire), Orinoco, Yangtze, the combined
Ganges-Brahmaputra, and Yenisey Rivers.
-
A
-
Not all parts of the Mississippi River drainage basin contribute water
in equal measure. Nearly one-half the water discharged to the Gulf is
contributed by the Ohio River and its tributaries (including the
Tennessee) whose combined drainage areas constitute only one-sixth of
the total area drained by the Mississippi. By contrast, the Missouri
River drains 43 percent of the total area but contributes only 12
percent of the total water. As the Mississippi flows southward from
its headwaters in the northern Midwest, its discharge is more than
doubled by the waters it receives from the Illinois and Missouri
Rivers. This combined discharge, in turn, is more than doubled again
as it joins the waters of the Ohio River.
-
B
-
Just as the spatial distribution of sources of water in the
Mississippi River is uneven, so is the temporal distribution of river
flow. Shown here are the yearly flows of the Mississippi since 1930
at Keokuk, Iowa, and since 1931 at Vicksburg, Mississippi. Keokuk is
at the Iowa-Missouri State line, 235 and 270 km, respectively, up the
Mississippi from its confluences with the Illinois and Missouri
Rivers. Vicksburg is downriver of the mouth of the Arkansas River and
upriver of the Atchafalaya diversion (see fig. 10B), and the
discharges recorded at Vicksburg represent the largest and most
integrated flows measured in the Mississippi River system. The two
graphs are drawn so that the long-term mean discharges at the two
stations are represented equally; although the mean discharges at the
two stations differ by a factor of nine, the scales and ranges of
variability can be compared directly by simple visual inspection. Wet
years and dry years at the two cities generally coincide. The range
of flow variation is somewhat less extreme at Vicksburg than at
Keokuk, which is a reflection of the damping influence of flows from
the intervening large tributaries, especially the Illinois, Missouri,
Ohio, and Arkansas Rivers. The ratio between the extreme maximum and
minimum yearly discharges shown here (1973 compared to 1934) is 5.5 at
Keokuk but only 3.1 at Vicksburg.
-
C
-
Average seasonal differences in river discharge are on the same order
as the extreme annual differences between wet and dry years. Shown
here are mean monthly discharges at Keokuk and Vicksburg for the same
periods of record as shown in B. In nearly all years along the length
of the Mississippi River, mean discharges during the high-water months
can be expected to be about three times the discharges during the
low-water months. At Keokuk, spring runoff usually begins quickly, in
response to the melting of ice on the river. At Vicksburg, the
usually high flows from the Ohio River during the months of December
through March give a more gradual beginning to the annual peak of
spring runoff.
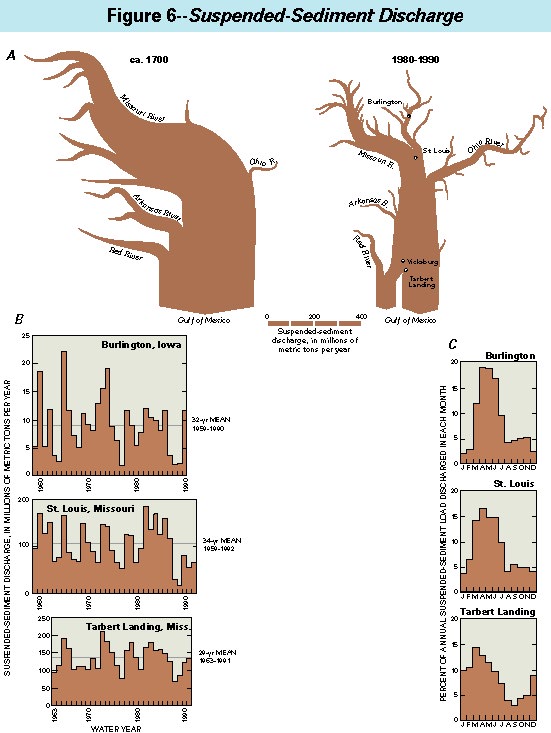
Suspended-Sediment Discharge
 (Click on image for a larger version, 83K)
Figure 6. -- The Mississippi River now discharges an
average of about 200 million metric tons of suspended sediment per
year past Vicksburg and eventually to the Gulf of Mexico. This
sediment discharge to the ocean ranks about sixth in the world today,
being equaled or exceeded by those of four rivers of Asia (the Yellow
and Yangtze Rivers of China, the Ganges-Brahmaputra of India and
Bangladesh, and probably the Irrawaddy River of Burma) and two rivers
of South America (the Amazon River of Brazil and possibly the
Magdalena River of Colombia).
-
A
-
The suspended-sediment loads carried by the Mississippi River to the
Gulf of Mexico have decreased by one-half since the Mississippi Valley
was first settled by European colonists. This decrease has happened
mostly since 1950, as the largest natural sources of sediment in the
drainage basin were cut off from the Mississippi River main stem by
the construction of large reservoirs on the Missouri and Arkansas
Rivers (see fig. 8). This large decrease in sediments from the
western tributaries was counterbalanced somewhat by a five- to tenfold
increase in sediment loads in the Ohio River-an increase that has
resulted from deforestation and rowcrop farming. Further complicating
the picture today is the controlled diversion of part of the water and
sediment from the Mississippi River below Vicksburg into the Old River
Outflow Channel and the Atchafalaya River (see fig. 10B). The average
suspended-sediment discharges portrayed for 1980-90 are taken mainly
from the extensive compilations of M.P. Keown and his colleagues
(1981, 1986) and of R.S. Parker (1988).
-
B
-
Temporal variation of suspended-sediment discharge in the Mississippi
River is more pronounced than that of water discharge (compare with
fig. 5B). Shown here are the yearly totals of suspended sediment
discharged past three long-term monitoring stations: Burlington, Iowa,
335 km upriver of the confluence with the Missouri River; St. Louis,
Missouri, 25 km downriver of the confluence with the Missouri River;
Tarbert Landing, Mississippi, 13 km downriver of the Atchafalaya
diversion at Old River. Sediment discharges shown for Burlington and
Tarbert Landing are based on data of the U.S. Army Corps of Engineers
(Rock Island and New Orleans Districts). Although records of sediment
at all three stations began some years prior to 1959, only partial
records are shown here to eliminate the confusion that might have been
introduced by including pre-reservoir sediment discharges at St. Louis
(see fig. 8) and pre-diversion sediment discharges at Tarbert Landing
(see fig. 10B). The three graphs are drawn so that the long-term mean
sediment discharges at all three stations are represented equally and
the scales and ranges of variability may be compared by simple visual
inspection. Years of high and low sediment discharges generally
coincide at all three stations, but the range of year-to-year
variation is more extreme in the upper river than in the lower river.
The ratios between extreme maximum and minimum yearly
suspended-sediment discharges for the periods of record shown here are
11.7 at Burlington, 9.2 at St. Louis, and only 2.8 at Tarbert Landing.
Even during 1988 and 1989, when sediment discharges in the upper river
were especially small, the Ohio River contributed enough sediment to
damp the extremes of year-to-year variation at Tarbert Landing.
-
C
-
Average seasonal differences in river-sediment discharges are of the
same order as extreme annual differences between wet and dry years in
the Upper Mississippi, and they exceed the range of year-to-year
differences in the Lower Mississippi. Shown here are the monthly
average suspended-sediment discharges at Burlington, St. Louis, and
Tarbert Landing for the same periods of record as shown in B. In the
Upper Mississippi River (Burlington), average suspended-sediment
discharges during the high-water months following ice breakup are
nearly ten times greater than discharges during midwinter months when
the river usually is covered with ice. In the Lower Mississippi
(Tarbert Landing), the late winter-early spring runoff from the Ohio
River contributes sediment during the months of December through
March. Even with this temporal offset in tributary contributions, the
maximum monthly sediment discharge (March) in the lower river averages
five times greater than the minimum monthly discharge (September).
Particle Sizes of Sediments
 (Click on image for a larger version, 83K)
Figure 7.-- Sediment particles in the Mississippi
River range in size from the very finest clays or colloids to coarse
sand and gravel. Different sizes of particles are found in suspension
and on the river bed, and the interrelations between the sediments
being transported in suspension and those stored or being transported
along the riverbed are complex and variable. The finest particles
play the largest role in the transport and storage of toxic
contaminants.
-
A
-
In the freely flowing reaches of the Mississippi River downstream from
St. Louis, part of the suspended-sediment load interacts with the
channel bed and part of it is independent of any such interaction.
The examples shown here are data collected from the Mississippi River
at Thebes, Illinois, on June 10, 1989, and at Vicksburg, Mississippi,
on March 27, 1989. The channel bed at these two sites (and through
most of the 1850-km length of the Mississippi between St. Louis and
the Gulf of Mexico) consists almost entirely of sand and fine gravel,
with few particles, if any, finer than 0.063 mm (millimeter) in
diameter. Some of the finest sand (mostly 0.125-0.25 mm) is mobilized
from the channel bed to become part of the suspended sediment;
hydraulic engineers refer to such sand in suspension as
"bed-material load" because it usually represents an
exchange of sand particles between the river waters and the beds over
which they flow. Most of the sediment in suspension, however, is
finer than sand. To aid in understanding the chemistry of the
suspended matter, we have divided the fine suspended sediment into two
fractions called "silt" and "colloid." The
division between the two fractions is here defined arbitrarily at
about 0.001 mm. The relative volumes of silt and colloid shown in the
figure represent the sizes of the individual particles after they have
been disaggregated in the laboratory with a dispersing agent. In the
river itself, most of the colloid-size particles are found in
aggregates that are large enough to be transported and deposited as
silt particles.
-
B
-
In the Upper Mississippi River, which has been dammed in order to form
a series of lakes to provide depth sufficient for barge navigation
(see fig. 10A), the sizes of the particles in both the bed sediments
and suspended sediments are distributed differently from those in the
unimpounded reaches of the lower river. The examples shown here are
data collected from the Mississippi River at Hastings, Minnesota, in
the upper end of navigation Pool 3 on October 10, 1991, and from the
nonchannel areas of lower Pool 3 on October 11, 1991; and from the
Mississippi River near Winfield, Missouri, at the upper end of Pool 26
on July 24, 1991, and from the nonchannel areas of lower-middle Pool
26 on November 1, 1991. In the navigation channels, the bed sediments
consist largely of sand, as they do in the channels of the freely
flowing lower river. Suspended sediments, however, consist almost
entirely of silt and colloidal particles and contain very little sand
except during floods. In the shallow nonchannel areas of the
navigation pools, which cover the former flood plains of the upper
river, the bed sediment is typically intermediate in size-finer than
the bed material in the main channels but generally coarser than the
bulk of the sediment in suspension.
Effects of Reservoirs
 (Click on image for a larger version, 99K)
Figure 8.-- Reservoirs reduce the sediment discharges
of the Mississippi River and its tributaries by trapping sediment that
otherwise would have been transported downriver.
-
A
-
The Missouri River has been the principal supplier of sediment to the
Mississippi River since the end of the last ice age. The graphs show
the annual discharges of suspended sediment measured by the U.S. Army
Corps of Engineers and the USGS at three gaging stations on the
Missouri River and two gaging stations on the Mississippi River over a
period of about four decades. After five large dams were completed
for hydroelectric power and irrigation above Yankton, South Dakota,
between 1953 and 1963, the discharge of sediment from the Upper
Missouri River Basin virtually was stopped. Following the closure of
Fort Randall Dam and Gavins Point Dam in 1953, downriver sediment
discharges were diminished immediately, and the effect could be
observed all the way down to the mouth of the Mississippi River.
Sediment discharges to the Gulf of Mexico in 1992 were less than
one-half of what they were before 1953.
-
B
-
In this downriver view (looking west-southwest) of Lake Cumberland, a
reservoir on the Cumberland River in Kentucky, sediment-laden brown
water can be seen flowing into the upper end of the lake during late
winter (February 28, 1988); the sediment gradually settles out to
leave blue water farther down the lake.
-
C
-
Deltas form where rivers flow into reservoirs, especially if the
inflowing rivers transport substantial amounts of sand. This large
sand delta has formed where the Canadian River flows into Lake Eufala,
a large reservoir in eastern Oklahoma near where the Canadian River
joins the Arkansas River. The view is down Lake Eufala (looking
east-northeast) in early spring (March 25, 1988).
Engineering Activities
 (Click on image for a larger version, 99K)
Figure 9. -- For more than 270 years, the banks and
the channel of the Mississippi River have been engineered for various
purposes: originally, starting about 1720, for flood control;
eventually, starting about a century later, for navigation.
-
A
-
The Lower Mississippi River from Cairo, Illinois, to the Gulf of
Mexico is constrained by a system of flood-control levees that is
longer than the Great Wall of China. The Z-shaped levee in this
photograph (view north) separates the active flood plain of the
Mississippi River (left of levee) from intensively cultivated cropland
in the fertile "Delta" region of Mississippi about 30 km
upriver of Vicksburg.
-
B
-
Dikes and wing dams are constructed to focus the main flow of the
river into the navigation channels, and they encourage sediment to
deposit in areas of the river that lie outside the navigation
channels. These dikes have allowed sandbars to grow and stabilize
into permanent islands along the right (western) bank of the
Mississippi River about 10 km upriver of Cape Girardeau, Missouri.
The sediment stored behind and between dikes such as these is
virtually immobilized and is unlikely to be resuspended for transport
downriver during the foreseeable future.
-
C
-
Bank-protection measures are applied along most of the Mississippi to
impede erosion and to maintain the shape of the navigation channel.
Shown here is an articulated concrete mat that is laid like carpet on
the riverbank by a special machine. Other banks along the Mississippi
are stabilized by boulder-size rock fragments that are quarried from
bluffs near the banks of the Upper Mississippi and brought downriver
by barge. One effect of the bank stabilization is to prevent the
remobilization of sediment previously deposited on the flood plains of
the river.
-
D
-
Despite the controls on water flow and sedimentation that are provided
by dikes and other engineering works, some reaches of the river
require periodic dredging to maintain the depth of water necessary for
navigation. In the Lower Mississippi, as shown in the photograph, the
dredged material is frequently piped out to the fast flowing part of
the river to be discharged. In the Upper Mississippi, where sand is
frequently the material dredged, large spoil banks and artificial
islands have been built alongside the main navigation channel.
Major Engineering Works
 (Click on image for a larger version, 83K)
Figure 10.-- The two most prominent examples of river
engineering on the Mississippi are the lock-and-dam system on the
upper river and the Atchafalaya diversion on the lower river.
-
A
-
The entire 1080-km reach of the Upper Mississippi River between
Minneapolis, Minnesota, and St. Louis, Missouri, is controlled for
barge navigation by a series of 29 lock-and-dam structures (O'Brien
and others, 1992). One of these structures-the first to be completed,
in 1913, at Keokuk, Iowa-was built to impound water to generate
hydroelectric power. The other 28 structures were built, mostly
during the 1930s, to maintain a minimum river depth of 9 feet (2.7
meters) for barge navigation.
Before the dams were built, navigation during low-water periods was
extremely hazardous, if not impossible, across rapids such as those at
Keokuk and Rock Island, and it was difficult in many other reaches of
the upper river. The lower reaches of the navigation pools, such as
the one shown in the photograph, are shallow lakes in which former
flood plains, previously inundated for infrequent short periods, are
now permanently under water. These shallow lakes are storage areas
for fine-grained sediments and the contaminants adsorbed to them.
-
B
-
About 500 km upstream from its main outlet to the Gulf of Mexico, the
Lower Mississippi River is partly diverted into the Atchafalaya River.
About one-fourth, on average, of the water that flows down the
Mississippi River past Vicksburg is diverted at a place called
"Old River" to join the waters of the Red and Ouachita
Rivers in forming the Atchafalaya River (McPhee, 1989). The diagram
on the lower right is an excerpt of figure 5A that has been enlarged
and rotated 90 degrees so that the direction of flow is to the right.
The accompanying photograph (view east, June 1991) shows the
Mississippi River flowing from center left to upper right. In the
foreground is the Old River Outflow Channel (flow west toward the
viewer), an artificial channel that joins the Red River just off the
lower edge of the photograph to form the Atchafalaya. Three
artificial channels, each containing a control structure, divert water
from the Mississippi River into the Old River Outflow Channel: (1) the
original channel, in the center, contains the Old River Control
Structure, completed in 1963; (2) the southernmost channel (upper
right in photograph) contains the Old River Auxiliary Control
Structure, completed in 1987; and (3) the northernmost channel (left
center) contains a low-head hydroelectric power dam, completed in 1990
and having a rated capacity of 194 megawatts, which supplies
electricity to communities in Louisiana.
REFERENCES
- Keown, M.P., Dardeau, E.A., Jr., and Causey, E.M., 1981,
-
Characterization of the suspended-sediment regime and bed-material
gradation of the Mississippi River Basin: U.S. Army Engineer Waterways
Experiment Station Potamology Program (P-1) Report 1, 2 vols., 62 p.,
7 app.
- ___ 1986,
- Historic trends in the sediment flow regime of the
Mississippi River: Water Resources Research, v. 22, no. 11,
p. 1555-1564.
- Kolb, C.R., and Van Lopik, J.R., 1958,
- Geology of the Mississippi
River deltaic plain, southeastern Louisiana: U.S. Army Engineer
Waterways Experiment Station Technical Report 3-483, 120 p.
- ___ 1966,
- Depositional environments of the Mississippi River deltaic
plain-Southeastern Louisiana, in Shirley, M.L., and Ragsdale, J.A.,
eds., Deltas in their geologic framework: Houston Geological Society,
p. 17-61.
- McPhee, John, 1989,
- Atchafalaya, in The control of nature: New York,
Farrar Straus Giroux, p. 3-92.
- O'Brien, W.P., Rathbun, M.Y., O'Bannon, Patrick, and Whitacre,
Christine, 1992,
- Gateways to commerce-The U.S. Army Corps of
Engineers' 9-foot channel project on the Upper Mississippi River:
National Park Service, Rocky Mountain Region, 238 p.
- Parker, R.S., 1988,
- Uncertainties in defining the suspended sediment
budget for large drainage basins, in Bordas, M.P., and Walling, D.E.,
eds., Sediment budgets: International Association of Hydrological
Sciences Publication 174, p. 523-532.
- Redfern, Ron, 1983,
- Fluvial plain, in The making of a continent: New
York, Times Books, p. 159-178.
- Saucier, R.T., 1991,
- Geomorphology, stratigraphy, and chronology,
inAutin, W.J., and others, Quaternary geology of the Lower Mississippi
Valley, in Morrison, R.B., ed., Quaternary nonglacial geology:
Geological Society of America, The Geology of North America, v. K-2,
p. 550-564.
Continue to '
Setting: Chemical character of the Mississippi River
', or return to '
Contents
'
Contaminants in the Mississippi River
U.S. GEOLOGICAL SURVEY CIRCULAR 1133
Reston, Virginia, 1995
Edited by Robert H. Meade
http://water.er.usgs.gov/pubs/circ1133/geosetting.html
Maintainer:
h2o Webserver Team
Last Modified: 1230 01 Oct 96 ghc
 (Click on image for a larger version, 132K)
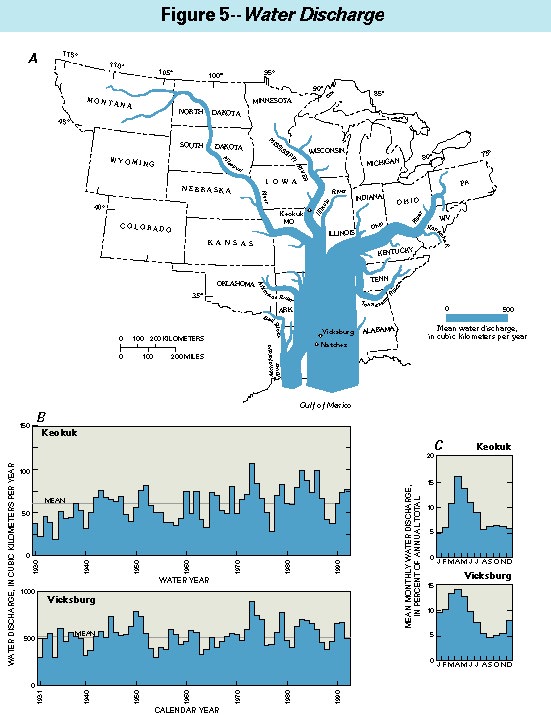
 (Click on image for a larger version, 83K)
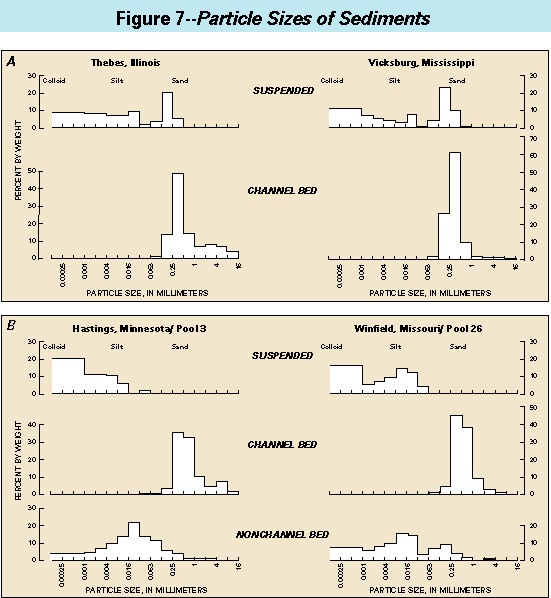 (Click on image for a larger version, 83K)
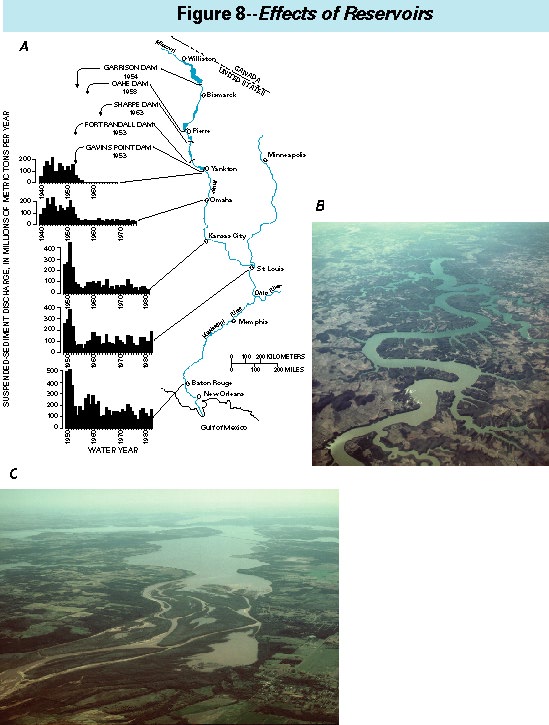 (Click on image for a larger version, 99K)
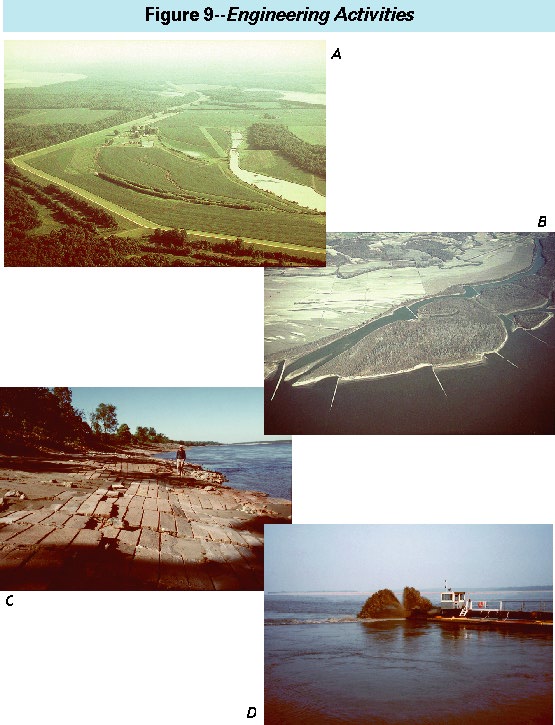 (Click on image for a larger version, 99K)
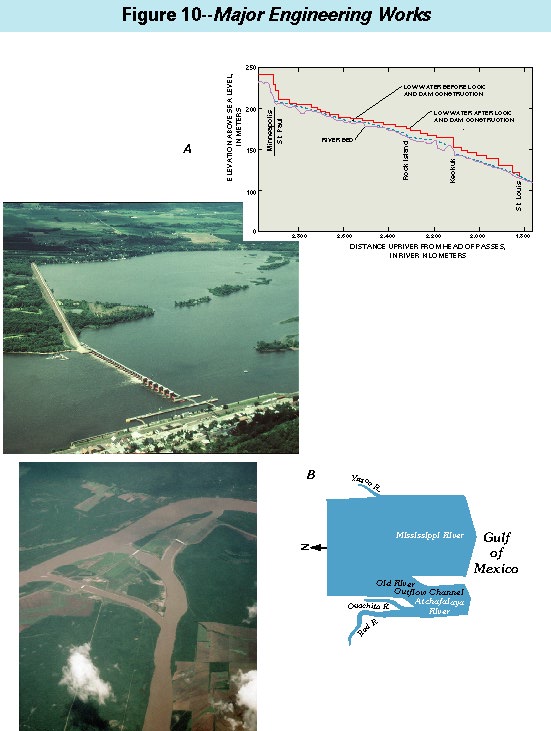 (Click on image for a larger version, 83K)