Contaminants in the Mississippi River
U.S. GEOLOGICAL SURVEY CIRCULAR 1133
Reston, Virginia, 1995
Edited by Robert H. Meade
Heavy Metals in the Mississippi River
John R. Garbarino, Heidi C. Hayes, David A. Roth, Ronald
C. Antweiler,
Terry I. Brinton, and Howard E. Taylor
Introduction
Metals in the Mississippi River come from natural as well as
artificial sources. Metals that are naturally introduced into the
river come primarily from such sources as rock weathering, soil
erosion, or the dissolution of water-soluble salts. Naturally
occurring metals move through aquatic environments independently of
human activities, usually without any detrimental effects. However,
as the valleys of the Mississippi River and its tributaries were
settled and industrialized, the metals added by human activities have
affected the water quality of the Mississippi River and ultimately the
Gulf of Mexico. Some of these metals are essential for proper
metabolism in all living organisms yet toxic at high concentrations;
other metals currently thought of as non-essential are toxic even at
relatively low concentrations.
Sources and Sinks of Heavy Metals

(Click on image for a larger version, 83K)
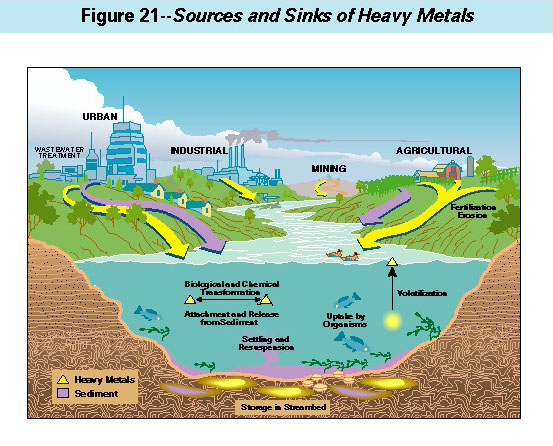
Figure 21.--Heavy metals are released to the Mississippi River from numerous
sources. Typical sources are municipal wastewater-treatment plants,
manufacturing industries, mining, and rural agricultural cultivation and
fertilization. Heavy metals are transported as either dissolved species in
water or as an integral part of suspended sediments. Heavy metals may be
volatilized to the atmosphere or stored in riverbed sediments. Toxic heavy
metals are taken up by organisms; the metals dissolved in water have the
greatest potential of causing the most deleterious effects.
Health Significance of Metals in the Environment
The metallic elements can be categorized into two groups. The heavy
metals are those having densities five times greater than water, and
the light metals, those having lesser densities. Well-known examples
of heavy metallic elements are iron, lead, and copper. Examples of
light metals are sodium, magnesium, and potassium. Humans consume
metallic elements through both water and food. Some metals such as
sodium, potassium, magnesium, calcium, and iron are found in living
tissue and are essential to human life-biological anomalies arise when
they are depleted or removed. Probably less well known is that
currently no less than six other heavy metals including molybdenum,
manganese, cobalt, copper, and zinc, have been linked to human growth,
development, achievement, and reproduction (Vahrenkamp, 1979; Friberg
and others, 1979). Even these metals, however, can become toxic or
aesthetically undesirable when their concentrations are too great.
Several heavy metals, like cadmium, lead, and mercury, are highly
toxic at relatively low concentrations, can accumulate in body tissues
over long periods of time, and are nonessential for human
health. Table 1 lists metals according to their toxicities.
No specific health guidelines for heavy metals associated with
suspended or bed sediments have been established by the
U.S. Environmental Protection Agency. This lack of national
guidelines based on concise scientific criteria causes difficulty when
evaluating the environmental effects of heavy metals in sediments.
Several different criteria have been defined, primarily on the basis
of observed effects on aquatic life (Lyman and others, 1987). Table 2
(page 57) lists criteria for open-water disposal of polluted sediments
that can be used for comparison purposes.
Sources of Metals in the Mississippi River
Heavy metals in the Mississippi River originate from either natural
processes or human activities. Natural erosion and weathering of
crustal materials take place over long periods of time and the amount
of heavy metals released is small. However, the potential for
contamination is increased when mining exposes metal-bearing ores.
When compared to the natural exposure of ore bodies through erosion,
the exposure rate through mining is over ten times faster for lead and
zinc (Massachusetts Institute of Technology, 1970). Leaching of mine
tailings and drainage from mined areas can introduce substantial
amounts of metals into the river.
Two of the largest lead-zinc mining areas in the world are located
along the Mississippi River. The reach of the Mississippi River
between Prairie du Chien, Wisconsin, and Galena, Illinois, passes
through the Upper Mississippi Valley lead-zinc district of southwest
Wisconsin, northwest Illinois, and northeast Iowa. The New Lead Belt
lies in southeast Missouri adjacent to the Mississippi River downriver
of St. Louis, Missouri.
Lead in River Waters and Sediments

(Click on image for a larger version, 99K)
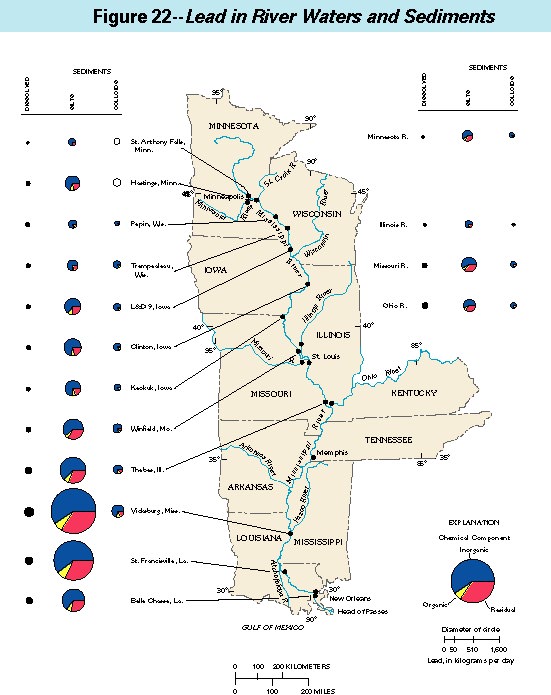
Figure 22. --Like most of the heavy metals in the
Mississippi River, lead is transported largely in association with the
suspended sediments. The areas of the dots and pie diagrams on the
left side of the figure are proportional to the quantities of lead
that were being transported down the Mississippi River at 12 sites
sampled during July-August 1991; the dots and pie diagrams on the
right side of the figure show the inputs from four main tributaries
(complete tabulations of the data are given by Hayes, 1993). The lead
loads transported by suspended sediment, both silt and colloid, were
larger than the dissolved loads because lead is a strongly
"hydrophobic" element-that is, it adsorbs onto sediment
particles more readily than remaining in solution by a factor of
thousands to one. The suspended silt loads are greater than the
colloidal loads because the river transports much more silt than
colloid. The quantities of colloid in suspension, for example, were
so low at the two most downstream sites sampled during this trip that
not enough could be collected for chemical analysis.
Both the silt and colloid fractions were analyzed further to determine
in detail how the lead is associated with the sediments. More than
one-half the lead in the sediment phases is designated
"inorganic," which means that it is an inorganic salt or a
component of the iron and manganese hydroxides that coat the surfaces
of the sediment particles. The second largest percentage of the lead
is called "residual," meaning lead sulfide (galena) or other
minerals that contain lead. Usually less than 10 percent of the lead
is associated with organic material in the suspended sediment. The
blank pie diagrams for St. Anthony Falls and Hastings indicate that
there was not enough material to obtain the distribution of lead in
the suspended colloid. However, enough colloid was available to
determine the total amount of lead present and therefore calculate the
corresponding load.
Cadmium is distributed in suspended sediment in much the same way as
lead, with the largest proportion being inorganic. Chromium and
copper, on the other hand, have much greater residual than inorganic
components.
Mercury in River Waters and Sediments

(Click on image for a larger version, 99K)
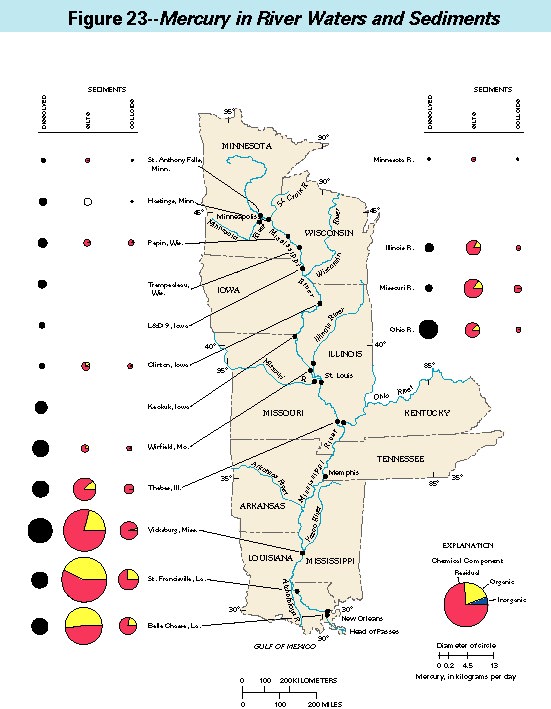
Figure 23. -- The transport of mercury in the
Mississippi River differs from that of lead in three important
respects. First, there is considerably less mercury than lead in the
river; notice the difference in the scales between this and the
preceding figure. Second, a greater proportion of mercury is
transported in the dissolved phase. Third, most of the mercury in the
sediment phases is residual, most likely as mercury sulfides, and the
remainder is associated with the organic matter in suspension. The
dots and pie diagrams in the figure represent samples collected during
the downriver cruise of October-November 1991 at 12 sites on the
Mississippi River (left) and in 4 major tributaries (right). Complete
tabulations of the data are given by Roth (1994). The percentage of
mercury in the organic phase of the silt increased downriver of
Thebes. Toxicological implications of this increase are strong
because the human body absorbs organic forms of mercury 14 times more
readily than inorganic forms (Task Group on Metal Accumulation, 1973).
Mercury concentrations in both silts and colloids at Trempealeau, Lock
& Dam 9, and Keokuk were not determined; therefore, loads could
not be calculated.
Major sources of toxic metals arising from human activities are
domestic and industrial wastewaters and their associated solid wastes.
On the average, the USEPA estimates that 81 percent of the metals
introduced into wastewater treatment plants comes from various
regulated industries that dispose of their wastes into municipal sewer
systems and that about 19 percent comes from consumer households in
the form of common household products (U.S. Environmental Protection
Agency, 1986). Cadmium, chromium, copper, lead, and mercury are used
extensively in industries along the Mississippi River (table 3,}. The
two main by-products of municipal treatment plants are solid wastes
and treated wastewater. In the most common form of treatment, 70 to
90 percent of cadmium, chromium, copper, lead, and zinc are removed as
solid wastes (Lester, 1983). The other 10 to 30 percent of these
heavy metals remain dissolved in the water that is released back into
the river. The concentration and transport of several heavy metals in
treated effluent from a wastewater- treatment plant are shown in table
4 . Note that, in undiluted wastewater, the concentrations
of cadmium, chromium, copper, and mercury exceed USEPA aquatic life
standards, and concentrations of cadmium, chromium, lead, and mercury
exceed the USEPA drinking water standards listed in table 2. The solid
waste or sewage sludge is commonly disposed in landfills or sold as
fertilizer. Heavy metals can be released through leaching of sewage
sludge in landfills. Sewage sludge also contains plant nutrients and
compares favorably to other fertilizers in crop production. The
amount of sewage sludge that can be applied to cropland is regulated by
the USEPA and depends on the concentration of heavy metals in the
sludge and the soil chemistry of the cropland. Some toxic heavy
metals, especially cadmium, have been found at elevated concentrations
in corn kernels harvested from soils fertilized with sewage sludge
(Kiemnec and others, 1990).
Rural cropland and pasture land abound along the Mississippi River
and its tributaries. Soil cultivation accounts for at least 90 percent
of the soil erosion in the more humid areas of the United States, and
it increases the amount of sediment introduced into the streams and
rivers (McElroy and others, 1975). Millions of tons of fertilizers
and pesticides are applied to croplands every year. Cultivated soils
can become enriched with toxic metals associated with these
applications. Although the concentrations may vary between specific
formulations, many of these fertilizers contain chromium, copper,
iron, manganese, nickel, and zinc. Selected pesticides use heavy
metals such as mercury as an integral component. During the late
spring and early summer, after fertilizers and pesticides have been
applied, the runoff from rain flushes these contaminants into the
Mississippi River. For example, the uranium concentration in the
Mississippi River is 20 times that found in the Amazon River, a result
linked to the specific use of phosphate fertilizers (Spalding and
Sackett, 1972).
The atmosphere is also a source of metal contamination to aquatic
environments. Metal-containing particulates that are washed from the
atmosphere by rain and snow are deposited in drainage basins and find
their way into lakes and rivers. As of 1973, the total nationwide
airborne particulate emissions were distributed basically among three
sources: 51 percent from industrial processes, 29 percent from
fossil-fuel combustion, and 20 percent from miscellaneous burning
practices (Magee and others, 1973). Since 1973, vehicle emissions
(and perhaps other emissions as well) have decreased. Stone and rock
crushing, iron and steel foundries, grain-handling operations, and
cement production emit the greatest percentage of the particulates.
Coal, used extensively for power generation, often contains
significant concentrations of metals such as vanadium, copper, nickel,
chromium, zinc, lanthanum, cobalt, molybdenum, gallium, germanium,
tin, and mercury (Magee and others, 1973). Automobile fuels have
historically contained lead additives for valve lubrication, but their
usage is slowly being phased out.
Lead in Silts and Colloids

(Click on image for a larger version, 66K)
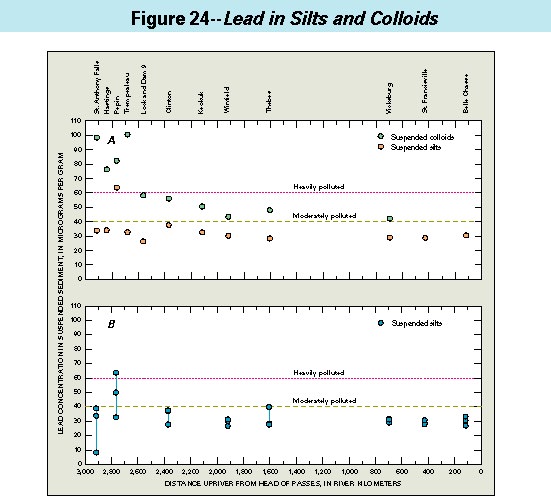
Figure 24. -- Concentrations of lead in suspended
sediments are greater and more variable in the Upper Mississippi than
in the Lower Mississippi River. Lead concentrations shown in these
graphs are the totals of inorganic, organic, and residual (see
fig. 22). Complete data are tabulated by Hayes (1993).
-
A
-
Lead concentration in colloidal sediments is generally greater than or
equal to the concentration in silts. Data shown in this graph are
from suspended sediments collected during the down-river cruise of
July-August 1991. Lead concentrations in colloids decrease markedly
downriver; concentrations in silts also decrease downriver, but less
markedly. Concentrations of lead at some sites in the uppermost river
exceed the guideline of 60 micrograms per gram (ug/g) for heavily
polluted sediments. Cadmium, chromium, and copper concentrations were
similar to those of lead in that they were greater in the colloidal
fraction, decreased downriver, and reached a fairly constant level
downriver of Winfield, Missouri. Suspended sediment was heavily
polluted with chromium and copper at 75 percent of all the locations
sampled on the Mississippi River main stem.
-
B
-
The variability of concentrations of lead in suspended silts in the
Mississippi River main stem decreases markedly downriver. Shown in this
graph are the concentrations of lead in suspended silts collected during
the three downriver cruises of July-August 1991, October-November 1991, and
April-May 1992. Concentrations in the upper river differed seasonally by
factors of two or more; those in the lower river registered seasonal
differences of only 10 to 15 percent. The greater variability in the upper
river probably reflects a diversity of sediment sources and the impoundment
of sediment behind the navigation dams. The downriver increase in the
uniformity of the concentration probably reflects the progressive
homogenization of the suspended sediment by repeated episodes of deposition
and resuspension. The concentrations of 27 to 34 ug/g that were
measured during 1991-92 in the lowest reaches of the Mississippi River are
similar to the 32 3 ug/g measured by Trefry and others (1985) in
samples collected there during 1982-83.
Range of Lead Dissolved in River
Waters Range of Lead Dissolved in River Waters

(Click on image for a larger version, 50K)
Figure 25. -- None of the concentrations of dissolved
heavy metals that were measured in the Mississippi River during
1987-92 exceeded the USEPA standards for drinking water or the standards
for aquatic life. Shown in the graph are the concentrations of dissolved
lead measured in depth-integrated composite samples collected during
1987-92 between Minneapolis and New Orleans (complete tabulations of the
data are given by Brinton and others, 1995, and Garbarino and others,
1995). All the concentrations shown here were less than the drinking-water
standard by a factor of at least 100. More than one-half of the samples
collected had dissolved lead concentrations too small to be measured; in
the fraction given at the lower end of each bar, the denominator is the
total number of samples analyzed from that site, and the numerator is the
number of analyses in which the concentration of lead was less than the
detection limit of 0.06 ug/L. The principal tributaries sampled generally
contained metal concentrations greater than the main stem Mississippi
River. However, these concentrations decreased downstream from the
confluences through simple dilution, precipitation, or adsorption onto
sediments. The concentrations of heavy metals are controlled by the volume
of the flow of the Mississippi River and are greater during the late fall
and winter when freezing temperatures decrease river flow and sediment
concentrations than in the spring and early summer when runoff is high.
Some fluctuations in concentrations can be attributed to seasonal releases
of metals from specific sources.
The Fate of Metals in the Mississippi River
The numerous studies of the heavy-metal water quality of the
Mississippi River that have been conducted over the last several
decades have emphasized mostly the water quality in specific regions
of either the lower reaches of the river (Everett 1971; Hartung, 1974;
Presley and Trefry, 1980; Shiller and Boyle, 1983; Newchurch and
Kahwa, 1984; Trefry and others, 1986) or the upper reaches of the
river (Eisenreich and others, 1980; Water Quality Work Group of the
Great River Environmental Action Team, 1980a, 1980b; Bailey and Rada,
1984; Buhl and McConville, 1984; Wiener and others, 1984). The water
quality of the Mississippi River at selected locations has also been
reported (Briggs and Ficke, 1978; DeLeon and others, 1986; Smith and
others, 1987; Costner and Thornton, 1989; Taylor and others, 1990).
However, our study assesses the heavy-metal contamination through the
full length of the Mississippi River from Minneapolis, Minnesota, to
the Gulf of Mexico. Over the 5-year assess ment period, the effects
of seasonal variation and changes in the river flow rate could be
evaluated. The water and sediment samples were collected by the same
group of scientists during the entire study using proven sampling
protocols. In addition, all samples were analyzed by one group of
scientists in a single laboratory using state-of-the-art
instrumentation and meth odology. Heavy metals released into the
Mississippi River, by both natural processes and human activities, can
be distributed among several different forms within the water
environment as shown in figures 22 and 23. Metals can be either
transported with the water and suspended sediment or stored within
the riverbed bottom sediments. Heavy metals are transported as (1)
dissolved species in the water, (2) suspended insoluble chemical
solids, or (3) components of the sus pended natural sediments. Metals
dissolved in the water can exist as hydrated metal ions or as aqueous
metal complexes with other organic or inorganic constituents.
Water-insoluble inorganic (non-carbon-containing, except for car
bonates) chemical solids such as metal hydroxides may be formed, as
may organic (carbon-containing) chemical solids, such as those
associated with compounds derived from the decay of living organisms.
Both inorganic and organic solids can be transported with the water as
individual entities or as chemical coatings on sus pended sediments.
In addition, mineral components of suspended sediments themselves can
contain heavy metals. Heavy-metal solids can also be stored in
river-bottom sediments. Suspended sediments and metallic chemical
solids are stored in riverbed sediment after they aggregate to form
large, denser-than-water particles that settle from the water when the
river's flow is not sufficient to keep them in suspension.
Uranium and Copper Dissolved in
River Waters

(Click on image for a larger version, 83K)
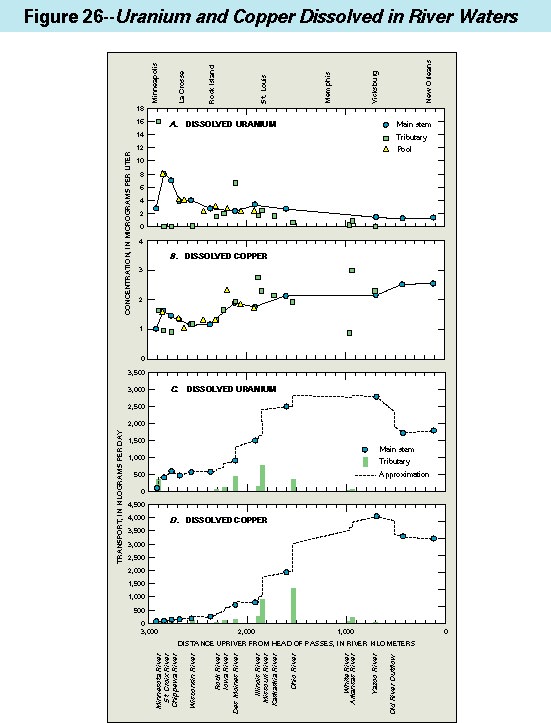
Figure 26. -- Although they are well within
drinking-water standards, concentrations and loads of dissolved heavy
metals in the Mississippi River give clues to their sources. The data for
dissolved uranium and dissolved copper shown here were collected during the
downriver sampling cruise of April-May 1992. Represented in the figure are
depth-integrated composite samples of the flowing main stem (circles) and
four tributaries (the Minnesota, Illinois, Missouri, and Ohio Rivers:
squares and bars), areally composited samples of backwaters in the
navigation pools (triangles), and samples of water dipped from surfaces of
tributaries other than the four listed above (squares and bars). The
complete data are tabulated by Garbarino and others (1995).
-
A
-
Uranium dissolved in the Mississippi River comes, in large part, from
phosphate fertilizers applied to croplands. Uranium occurs naturally in
phosphate rock that is mined for fertilizer. Rain falling on fertilized
croplands washes some uranium-containing fertilizer from the fields into
streams and rivers. Concentrations of dissolved uranium are greatest in
the Upper Mississippi River. Tributaries like the Minnesota and Des Moines
Rivers, which drain areas that are farmed intensively for corn and other
grains, have high concentrations of dissolved uranium that increase the
concentrations in the Mississippi River downstream from their confluences.
-
B
-
Copper dissolved in the Mississippi River comes mostly from industrial and
municipal wastewaters. Concentrations of dissolved copper generally
increase in the downriver direction, especially near urban centers. Some
tributaries carry greater concentrations of copper than the main stem
Mississippi, but their influences on main stem concentrations seem to be
minimal.
-
C
-
The transport of dissolved uranium downriver depends on water discharge as
well as on the concentration of the element in solution. Transports
usually are greater during high-flow periods such as spring runoff (shown
here) than during periods of lower flow. For example, the transport of
dissolved uranium measured at Vicksburg during the spring sampling trip
shown here was twice the transport measured at the same site the previous
November--even though the dissolved concentrations were virtually the same.
During the sampling trip shown here, the Mississippi River was receiving
high loads of dissolved uranium from the Minnesota and Des Moines Rivers
(because of their high concentrations) and from the Missouri and Ohio
Rivers (because of their high water discharges). The abrupt decrease in
uranium transport near river kilometer 500 represents the Old River Outflow
where about one-fourth of the flow of the Mississippi River is diverted
into the Atchafalaya River.
-
D
-
The transport of dissolved copper in the Mississippi River, like that of
dissolved uranium, varies directly with the water discharge. The most
significant increases in the transport of dissolved copper occur at the
confluences of the Mississippi with the Missouri and Ohio Rivers.
Mercury Dissolved in River Waters

(Click on image for a larger version, 50K)
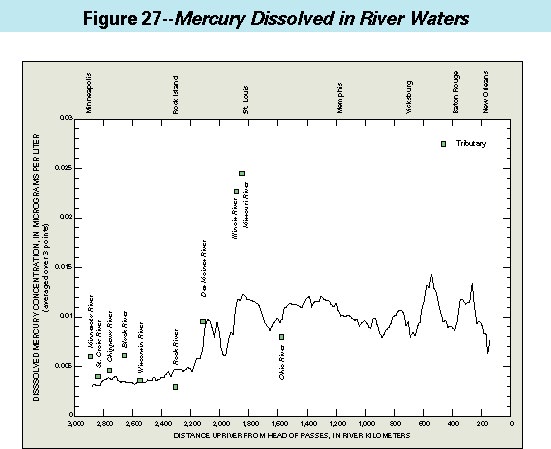
Figure 27. -- Mercury dissolved in the Mississippi
River is derived (like copper) from municipal and industrial sources.
The distribution of dissolved mercury in the Mississippi can be shown
in more detail than that of other heavy metals (such as uranium and
copper, shown in the previous figure) because samples were collected
specifically for mercury analyses during upriver transects. Shown in
the graph are the concentrations of dissolved inorganic mercury in
samples collected from the river surface at 15- to 20-kilometer
intervals between New Orleans and Minneapolis during the upriver
cruise of September 25-October 4, 1991 (a complete tabulation of the
data is given by Roth, 1994). The line in the graph represents the
average of the concentrations of each three adjacent samples (that is,
a 3-point moving average) over 45- to 60-kilometer reaches of the
river. Mercury concentrations were lowest in the upper reaches and
gradually increased downriver. Large concentrations were measured
downstream from tributaries such as the Des Moines, Illinois, and
Missouri Rivers and near large metropolitan and industrial centers,
specifically St. Louis, Missouri, Vicksburg, Mississippi, and below
Baton Rouge, Louisiana. Farther downstream from each of these inputs,
the concentration of dissolved mercury appears to have decreased;
these decreases may be due to transformations of inorganic mercury to
organic forms or to its adsorption onto sediment rather than to a
decrease in the overall concentration of mercury in the river.
The different chemical forms of heavy metals in the river influence
their availability and toxicity to organisms. Heavy metals are
readily available to aquatic organisms and pose a significant health
hazard when they are present as dissolved inorganic or organic species
in the water or loosely adsorbed to particulate surfaces. When heavy
metals are present as components of particulates, such as inorganic
metal-hydroxide coatings or metal-organic compounds, some chemical
alterations are required before they can be released and become
biologically available. Even stronger chemical reactions are required
to release heavy metals that are integral parts of the minerals
composing river sediments.
The water chemistry of the Mississippi River, the aqueous chemistry of
individual heavy metals, the type and surface area of the particulates
present in the Mississippi River, and other hydrologic factors control
where the metals will be found. The water chemistry is controlled by
many complex factors such as water acidity and the type and
concentration of the major inorganic compounds, organic compounds, and
suspended sediment. Many of these factors are also influenced by
seasonal variation in river flow and temperature, and the
decomposition of vegetation. The Mississippi River, like the majority
of natural waters in the United States, can be described as having
bicarbonate-type water because bicarbonates, especially calcium
bicarbonate, predominate as the dissolved salt (Water Quality Work
Group of the Great River Environmental Action Team, 1980b).
Bicarbonate water is slightly alkaline rather than acidic. An aqueous
solution of baking soda is a good example of an alka-line solution,
whereas orange juice is an acidic solution. The major fraction of
heavy metals released into alkaline natural waters becomes associated
with either the suspended particulates or the bed sediments. This
association reduces or eliminates dissolved heavy metals, which are
usually the most toxic form. For example, dissolved lead and zinc
compounds from mine wastes tend to be adsorbed onto natural silt and
clay sediments or organic matter, rather than staying dissolved in the
water of the Mississippi River (Jennett and others, 1973). In
contrast, most of the light metals tend to remain as dissolved species
in the water.
Heavy-Metal Water Quality of the Mississippi River
The brief glimpse at the heavy metals in the Mississippi River
described in this chapter generally was based on data collected during
the summer and autumn of 1991 and the spring of 1992. Data that were
collected in the Lower Mississippi River during 1987-90 (Brinton and
others, 1995) reinforce the findings presented here. Concentrations
of toxic heavy metals dissolved in the water in the 2,900 km reach of
the Mississippi River from Minneapolis, Minnesota, to Belle Chasse,
Louisiana, are well below USEPA guidelines for drinking water and
water that supports aquatic life. However, heavy metals associated
with suspended sediments exceeded the pollution guidelines at many of
the main-stem sampling locations. Heavy-metal concentrations in the
suspended sediments were generally greater in the small
colloidal-sized particles than the larger silt-sized particles. Even
though the colloids compose a significantly lower percentage of the
total suspended sediment, their heavy-metal concentrations are
greater, and they are small enough to pass through some of the
filtering systems used in water-treatment facilities. Sediments
stored in pools upstream from every lock and dam of the Upper
Mississippi River also have elevated heavy-metal concentrations. The
biological accessibility to heavy metals associated with suspended and
stored sediment also depends on the chemical form in which the metal
exists. A high percentage of the heavy metals in all the sediment
sizes exist in chemical forms that can be dissolved if appropriate
conditions driven by chemical or biological processes are present.
Concentrations of dissolved heavy metals and those associated with
suspended sediment vary seasonally. Dissolved heavy-metal
concentrations are generally greater during periods when the river
flow is low, during droughts and winter months, because the decrease
in water volume decreases dilution effects and the decrease in
suspended sediment concentrations decreases metal-scavenging
processes. Conversely, the increases in river flow during the warmer
months either dilute heavy metal concentrations with greater volumes
of water or decrease dissolved metal concentrations through increased
scavenging processes resulting from higher suspended-sediment
concentrations. As a result, heavy-metal transport on suspended
sediment increases during high-flow periods. Wastewater treatment,
agricultural practices, and mining activities all influence the water
quality. Crop fertilization periodically introduces specific heavy
metals into the hydrologic system after spring applications and spring
runoff. Discharges from wastewater- treatment facilities and
industrial manufacturing activities cause increases in heavy-metal
concentrations near major urban areas.
Whether the loads and concentrations of heavy metals in the
Mississippi River have increased or decreased in recent years is
difficult to determine. Although most of the heavy metals in the
river are associated with sediment, most of the previous studies have
focused on the dissolved metals. Even for the dissolved metals,
comparisons are difficult to draw between earlier and more recent data
because analytical laboratory techniques have become markedly more
sensitive in the last decade and field sampling techniques have not
been adequately standardized. Specific conclusions about increases or
decreases in heavy metals with time in the Mississippi River are
tenuous at best.
Metals Dissolved in River Waters

(Click on image for a larger version, 33K)
Figure 28. -- Statistical analysis of dissolved
heavy-metal concentrations measured at all main-stem locations of the
Mississippi River during the July-August 1991, October-November 1991, and
April-May 1992 cruises indicate that cadmium, chromium, copper, lead, and
uranium varied little with season. Of 36 samples collected during this
period only one cadmium concentration was greater than the detection limit
of 0.1 ug/L. In 11 of the 36 samples, concentrations of chromium
were less than the detection limit of 0.2 ug/L. In 20 of the 36
samples, lead concentrations were less than the detection limit of 0.06
ug/L. Dissolved mercury was less than the detection limit of 0.004
ug/L in 15 of the 36 samples. All the samples contained
measurable concentrations of copper and uranium.
Lead and Mercury in Bed Sediments

(Click on image for a larger version, 83K)
Figure 29. -- The bed sediments stored in the nonchannel
(backwater) areas of the navigation pools of the Upper Mississippi River
contain substantial quantities of heavy metals. However, the
concentrations of lead and mercury in these bed sediments are generally
less than those measured in the suspended sediments in transport; and, in
the case of lead, the concentrations usually are less than the criterion
value of 40 ug/g for moderately polluted sediment. Data used in this
figure are the concentrations measured in a composite sample derived from
15-20 bed samples collected from the lower reaches of each navigation pool.
The difference between lead and mercury concentrations measured in the bed
sediments and in suspended sediments is mostly due to the differences in
sediment particle size. Bed sediment samples were composed of a wide
variety of particle sizes that ranged from coarse sand to colloid (see fig.
7B), markedly different than the suspended sediment. In addition, bed
sediment samples were not separated into individual particle-size fractions
prior to analysis, as was the case for suspended sediment, but rather were
analyzed as a whole. As a result, the heavy-metal concentrations measured
in the bed sediments would be expected to be lower because of the presence
of less metal-laden sand particles. Complete data are tabulated in the
reports by Hayes (1993) and Roth and others (1995).
-
A
-
The distribution of bed-sediment particle sizes in navigation pools of the
Upper Mississippi River depends on factors such as pool size and
configuration. More than 80 percent of the bed sediment collected from
Lake Pepin, Pool 9, Pool 12, Pool 13, and Pool 26 was composed of silt and
colloid particles (shown here as percent finer than 63 micrometers); more
than 70 percent of the sediment collected in Pools 2, 3, 11, and 19 was
silt and colloid.
-
B
-
The bed sediments collected from the rest of the pools contained
significantly lower percentages of silt and colloid. In bed sediments
collected from 25 navigation pools of the Upper Mississippi River between
July 1991 and April 1992, the greatest concentrations of lead were in Lake
Pepin, Pool 12, Pool 19, and Pool 26. Lake Pepin, a large and narrow
natural lake, is known to trap large proportions of the suspended sediment
that the Mississippi River delivers to it from the north. Pool 12 receives
inflow from the Galena River, which drains a lead and zinc mining district.
Lead leaching from the lead mines has an affinity for sediment. However,
the relation of the high lead concentration in Pool 12 to the nearby mining
district has not been confirmed. The high lead concentrations could simply
be a result of the large proportion of fine bed-sediment material present
in the pool. Pool 19 is the largest of the artificial pools, not as large
as Lake Pepin, but more likely than the other smaller pools to trap and
retain sediments and their associated contaminants. Elevated lead
concentrations in the bed sediment of Pool 26 suggest a link to the input
of lead-laden sediment from the Illinois River. Grab samples of the bed
sediment collected from the Illinois River near Hardin, Illinois, contained
25 ug/g of lead, or about twice the concentration found in the bed
sediments from Pool 25. Cadmium, chromium, copper, nickel, and zinc
followed nearly the same trend as lead, with bed-sediment concentration
maximums at Lake Pepin, Pool 12, Pool 19, and Pool 26. Only bed sediments
from Lake Pepin, and possibly from Pool 12, can be described as moderately
polluted in lead. In most pools, approximately 50 percent of the lead in
the bed sediment was associated with the inorganic component, 40 percent
with the residual component, and 10 percent with the organic component.
The greatest proportions of the inorganic component were found where the
lead concentrations were highest. Therefore, most of the lead in the pool
bed-sediment environment may be readily accessible and could be released if
the proper conditions existed. Other heavy metals-cadmium, chromium, and
copper-had their greatest percentages in the residual component. Except
for cadmium, the proportions of heavy metals designated as inorganic,
organic, and residual were similar to those in the main-stem suspended
sediments. The concentrations shown in the figure are similar to earlier
data collected by Bailey and Rada (1984), who reported the following
average concentrations of lead in bed sediments: 40 ug/g in Lake
Pepin, 13 ug/g in Pool 5, and 14 ug/g in Pool 9.
-
C and D
-
Mercury concentrations in pool bed sediments of the Upper Mississippi River
can be correlated to the organic carbon content of the sediments. Mercury
concentrations in the bed sediments of most pools, except for Lake Pepin,
were not large enough to cause adverse toxicological effects. Bed-sediment
mercury concentrations in Lake Pepin exceeded 0.18 ug/g, a level that has
been shown to increase the mortality rates in fish embryos, eggs, and
larvae (Birge and others, 1977). Mercury can bioaccumulate in many aquatic
organisms, especially fish, by direct ingestion of suspended or bed-
sediment particles. High organic-carbon concentrations in the presence of
mercury in the bed sediments increase the methylation rate of mercury and
subsequently increase the absorption and retention of mercury in fish and
human tissues. Lake Pepin, Pools 2, 3, 12, 19, and 26 are the most likely
areas in which this might occur because of the high percent organic carbon
in their bed sediments.
REFERENCES
- Bailey, P.A., and Rada, R.G., 1984,
- Distribution and enrichment of
trace metals (Cd, Cr, Cu, Ni, Pb, Zn) in bottom sediments of
navigation Pools 4 (Lake Pepin), 5, and 9 of the Upper Mississippi
River, in Wiener, J.G., Anderson, R.V., and McConville, D.R., eds.,
Contaminants in the Upper Mississippi River: Boston, Butterworth
Publishers, p. 119-138.
- Birge, W.J., Black, J.A., Westerman, A.G., Francis, P.C., and Hudson,
J.E., 1977,
- Embryopathic effects of waterborne and
sediment-accumulated cadmium, mercury, and zinc on reproduction and
survival of fish and amphibian populations in Kentucky:
U.S. Department of the Interior, Research Report 100, Washington,
D.C., 28 p.
- Boyer, H.A., 1984,
- Trace elements in the water, sediments, and fish of
the Upper Mississippi River, Twin Cities metropolitan area, in Wiener,
J.G., Anderson, R.V., and McConville, D.R., eds., Contaminants in the
Upper Mississippi River: Boston, Butterworth Publishers,
p. 195-230.
- Briggs, J.C., and Ficke, J.F., 1978,
- Quality of rivers of the United
States, 1975 water year: U.S. Geological Survey Open-File Report
78-200, 436 p.
- Brinton, T.I., Garbarino, J.R., Peart, D.B., Taylor, H.E., and
Antweiler, R.C., 1995,
- Concentration and transport data for dissolved
inorganic constituents in water collected during seven cruises on the
Mississippi River and some of its tributaries, July 1987-June 1990:
U.S. Geological Survey Open-File Report 94-524, 102 p.
- Buhl, K.J., and McConville, D.R., 1984,
- Heavy metal accumulation in
selected sessile components of Fountain City Bay, Pool 5A, of the
Upper Mississippi River, in Wiener, J.G., Anderson, R.V., and
McConville, D.R., eds., Contaminants in the Upper Mississippi River:
Boston, Butterworth Publishers, p. 171-194.
- Costner, Pat, and Thornton, Joe, 1989,
- We all live downstream-The
Mississippi River and the national toxics crisis: Washington, D.C.,
Greenpeace USA, 120 p., l app. (61 p.).
- Dean, J.G., Bosqui, F.L., and Lanouette, V.H., 1972, Removing heavy
metals from waste water: Environmental Science and Technology, v. 6,
p. 518-522.
DeLeon, I.R., Byrne, C.J., Peuler, E.A., Antoine, S.R., Schaeffer,
Jeffrey, and Murphy, R.C., 1986,
- Trace organic and heavy metal
pollutants in the Mississippi River: Chemosphere, v. 15, no. 6,
p. 795-805.
- Eisenreich, S.J., Hoffmann, M.R., Rastetter, D., Yost, E., and Maier,
W.J., 1980,
- Metal transport phases in the upper Mississippi River,
in Kavanaugh, M.C., and Leckie, J.O., eds., Particulates in water:
American Chemical Society, Advances in Chemistry Series No. 180, p.
135-176.
- Everett, D.E., 1971,
- Hydrologic and quality characteristics of the
lower Mississippi River: Louisiana Department of Public Works
Technical Report 5, 48 p.
- Friberg, L., Nordberg, G.F., and Vouk, V.B., eds., 1979,
- Handbook on
the toxicology of metals: Amsterdam, Elsevier/North-Holland Biomedical
Press, 709 p.
- Garbarino, J.R., Antweiler, R.C., Brinton, T.I., Roth, D.A., and
Taylor, H.E., 1995,
- Concentration and transport data for selected
dissolved inorganic constituents and dissolved organic carbon in water
collected from the Mississippi River and some of its tributaries, July
1991-May 1992: U.S. Geological Survey Open-File Report 95-149, 149 p.
- Great Lakes Water Quality Board, Dredging Subcommittee, 1982,
- Guidelines
and register for evaluation of Great Lakes dredging projects: International
Joint Commission, Great Lakes Regional Office, 365 p.
- Hartung, R., 1974,
- Heavy metals in the lower Mississippi River,
in Proceedings of the International Conference on Transport of
Persistent Chemicals in Aquatic Ecosystems: Ottawa, National Research
Council of Canada, p. 93-98.
- Hayes, H.C., 1993,
- Metal associations in suspended sediments and bed
sediments from the Mississippi River: Golden, Colorado School of Mines,
Department of Chemistry and Geochemistry, M.S. thesis, 131 p.
- Jennett, J.C., Wixson, B.G., Bolter, E., and Gale, N., 1973,
- Transport
mechanisms of lead industry wastes, in Proceedings of Industrial Waste
Conference, 28th, Purdue University: Boston, Butterworth Publishers, p.
496-512.
- Kiemnec, G.L., Hemphill, D.D., Hickey, M., Jackson, T.L., and Volk, V.V.,
1990,
- Sweet corn yield and tissue metal concentrations after seven years of
sewage sludge application: Journal of Production Agriculture, v. 3, no.
2, p. 232-237.
- Lester, J.N., 1983,
- Significance and behavior of heavy metals in waste
water treatment processes�sewage treatment and effluent discharge: The
Science of the Total Environment, v. 30, p. 1-44.
- Lyman, W.J., Glazer, A.E., Ong, J.H., and Coons, S.F., 1987,
- An overview of
sediment quality in the United States: U.S. Environmental Protection
Agency, Monitoring and Data Support Division, Office of Water Regulations
and Standards, Contract No. 68-01-6951, Task 20, 111 p., 3 app.
- Magee, E.M., Hall, H.J., and Varga, G.M., Jr., 1973,
- Potential pollutants
in fossil fuels: U.S. Environmental Protection Agency Publication
EPA-R2-73-249, p. 54-56.
- Massachusetts Institute of Technology, 1970,
- Man's impact on the global
environment-Report of the study of critical environmental problems:
Cambridge, Massachusetts Institute of Technology, 116 p.
- McElroy, A.D., Chiu, S.Y., Nebgen, J.W., Aleti, A., and Vandergrift, E.,
1975,
- Water pollution from non-point sources: Water Research, v. 9, p.
675-681.
- Newchurch, E.J., and Kahwa, I.A., 1984,
- Heavy metals in the Lower
Mississippi River: Journal of Environmental Science and Health, v. A19,
no. 8, p. 973-988.
- Presley, B.J., and Trefry, J.H., III, 1980,
- Heavy metal inputs to
Mississippi delta sediments-A historical view: Water, Air, and Soil
Pollution, v. 13, no. 4, p. 481-494.
- Roth, D.A., 1994,
- Ultratrace analysis of mercury and its distribution in
some natural waters in the United States: Fort Collins, Colorado State
University, Department of Chemistry, Ph.D. dissertation, 309 p.
- Roth, D.A., Garbarino, J.R., and Taylor, H.E., 1995,
- Major and trace
elements, in Moody, J.A., ed., Chemical data for water samples collected
during four upriver cruises on the Mississippi River between New Orleans,
Louisiana, and Minneapolis, Minnesota, May 1990-April 1992: U.S. Geological
Survey Open-File Report 94-523, p. 127-209.
- Roth, D.A., Hayes, H.C., Antweiler, R.C., Brinton, T.I., Garbarino, J.R.,
Peart, D.B., and Taylor, H.E., 1995,
- Major and trace elements, and
nutrients, in Moody, J.A., ed., Hydrologic, sedimentologic, and chemical
data describing surficial bed sediments and water in the navigation pools
of the Upper Mississippi River, July 1991- April 1992: U.S. Geological
Survey Open-File Report 95-708.
- Shiller, A.M., and Boyle, Edward, 1983,
- Trace metals in the plume of the
Mississippi River [abs.]: EOS American Geophysical Union Transactions, v.
64, p. 1021.
- Smith, R.A., Alexander, R.B., and Wolman, M.G., 1987,
- Water-quality trends
in the Nation's rivers: Science, v. 235, p. 1607-1615.
- Spalding, R.F., and Sackett, W.M., 1972,
- Uranium in runoff from the Gulf of
Mexico distributive province: anomalous concentrations: Science, v. 175,
p. 629-631.
- Task Group on Metal Accumulation, 1973,
- Accumulation of toxic metals with
special reference to their absorption, excretion, and biological
half-times: Environmental Physiology and Biochemistry, v. 3, p. 65-107.
- Taylor, H.E., Garbarino, J.R., and Brinton, T.I., 1990,
- The occurrence and
distribution of trace metals in the Mississippi River and its tributaries:
The Science of the Total Environment, v. 97/98, p. 369-384.
- Taylor, H.E., and Shiller, A.M., 1995,
- Mississippi River methods
comparison study-Implications for water quality monitoring of dissolved
trace elements: Environmental Science and Technology, v. 29, p.
1313-1317.
- Taylor, H.E., Shiller, A.M., Garbarino, J.R., and Brinton, T.I., 1995,
-
Intercomparison experiments on dissolved trace-metal data from the
Mississippi River and some of its tributaries, 1989-90: U.S. Geological
Survey Open-File Report 93-628, 28 p.
- Trefry, J.H., III, Metz, S., and Trocine, R.P., 1985,
- A decline in lead
transport by the Mississippi River: Science, v. 230, p. 439-441.
- Trefry, J.H., III, Nelson, T.A., Tocine, R.P., Metz, S., and Vetter,
T.W., 1986,
- Trace metal fluxes through the Mississippi River delta
system, in Kullenberg, G., ed., Contaminant fluxes through the
coastal zone: Rapports et Proces-Verbaux des Reunions, Conseil
International pour I'Exploration de la Mer, v. 186, p. 277-288.
- U.S. Environmental Protection Agency, 1982,
- Maximum contaminant levels
(subpart B of part 141, National interim primary water regulations): U.S.
Code of Federal Regulations, Title 40, Parts 100 to 149, revised as of July
1, 1982, p. 315-318.
- ___ 1986,
- Report to Congress-Discharge of hazardous wastes to publicly
owned treatment plants, (530/SW-86-004): Environmental Protection Agency,
February 28, 1986.
- ___ 1992,
- Drinking water regulations and health advisories: U.S.
Environmental Protection Agency, Office of Water, unpublished.
- Vahrenkamp, H., 1979
- , Metalle in Lebensprozessen: Chemie in Unserer Zeit,
v. 7, p. 97-105. Water Quality Work Group of the Great River
Environmental Action Team, 1980a, Water quality, sediment & erosion: GREAT
I, Study of the Upper Mississippi River, v. 4, 125 p., 2 app.
- ___ 1980b,
- Water quality work group appendix: GREAT II, Study of the Upper
Mississippi River (Guttenberg, Iowa, to Saverton, Missouri), 216 p.
- Wiener, J.G., Jackson, G.A., May, T.W., and Cole, B.P., 1984,
- Longitudinal
distribution of trace elements (As, Cd, Cr, Hg, Pb, and Se) in fishes and
sediments in the Upper Mississippi River, in Wiener, J.G., Anderson, R.V.,
and McConville, D.R., eds., Contaminants in the Upper Mississippi River:
Boston, Butterworth Publishers, p. 139-170.
- Wood, J.M., 1974,
- Biological cycles for toxic elements in the environment:
Science, v. 183, p. 1049-1052.
Continue to '
Nutrients in the Mississippi River
', or return to '
Contents
'
Contaminants in the Mississippi River
U.S. GEOLOGICAL SURVEY CIRCULAR 1133
Reston, Virginia, 1995
Edited by Robert H. Meade
http://water.er.usgs.gov/pubs/circ1133/heavy-metals.html
Maintainer:
h2o Webserver Team
Last Modified: 1230 01 Oct 96 ghc