![]()
Table of contents || Previous section || Next section || Glossary || PDF document
Although the major land use in the basin is agriculture, urban areas also can affect water quality. The primary sources of contamination from urban areas are stormwater runoff, municipal wastewater discharge, and industrial discharge. This study did not focus specifically on point discharges; but generally, water quality downstream from Fargo can be compared to the water quality upstream.
 (7,815 bytes)
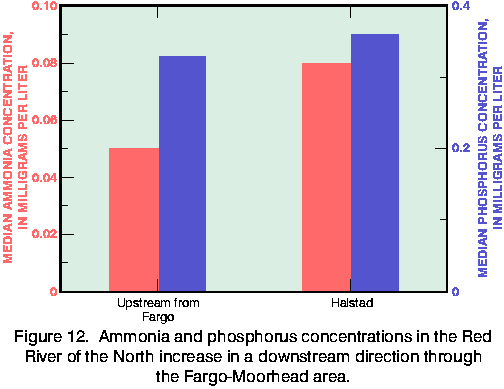
Figure 12. Ammonia and Phosphorus concentrations in the Red River of the North increase in a downstream direction through the Fargo-Moorhead area.
The effect of municipal wastewater discharges on the total nitrogen concentration can be estimated through a mass balance model. In this model, the total nitrogen concentration is computed from the concentration in the average daily municipal wastewater-treatment outflow and the concentration in streamflow at the time of measurement. Adding the municipal wastewater outflow from Fargo and Moorhead increases the median total nitrogen concentration from 1.41 mg/L upstream from the Fargo-Moorhead area to 1.68 mg/L downstream (Tornes and others, 1997). The effect on the Red River is difficult to assess farther downstream because the streamflow nearly doubles between the Fargo-Moorhead area and Halstad, Minnesota. This analysis assumes a total nitrogen concentration of 11.2 mg/L for sewage effluent (national average, Larry Puckett, U.S. Geological Survey, written commun., 1993). This model may not be appropriate for conditions after September 1995 because a new sewage-treatment plant went into full service at that time.Nitrite plus nitrate concentrations tended to be slightly higher than historical concentrations at sites along the Red River. Median ammonia concentrations for the Red River at Halstad, downstream from the Fargo-Moorhead urban area, were about 0.16 mg/L in historical samples, but were only 0.08 mg/L in samples collected for this study (Tornes and others, 1997). Increases in nitrate and decreases in ammonia have been identified in several streams nationwide, particularly downstream from urban areas; these trends likely reflect improved aeration of wastewater effluent, whereby ammonia is nitrified to nitrate. It also is possible that reduced loading of oxygen-demanding materials is allowing streams to remain aerated, decreasing the instream production of ammonia.
Although urban areas contribute only a portion of the phosphorus in the Red River (fig. 12), it is a major issue in Red River water quality. Eutrophication due to high concentrations of phosphorus is possible in streams and in Lake Winnipeg, into which the Red River flows (fig. 1). Noxious algal blooms have occurred frequently in Lake Winnipeg (Nielsen and others, 1996). From 1969 to 1974, the Red River contributed about 58 percent of the total phosphorus but only 9 percent of the total flow to Lake Winnipeg (Brunskill and others, 1980). More recently, from 1975 to 1988 the Red River contributed, on average, twice the phosphorus load but only one-fifth the flow of the Winnipeg River (the other major tributary to the southern part of Lake Winnipeg); furthermore, about 60 percent of the phosphorus load at the outflow of the Red River comes from the U.S. portion of the Red River Basin (Brigham and others, 1996).
 (36,777 bytes)
The Fargo municipal outflow pipe discharged into the Red River of the North until September 1995 when a tertiary treatment system was completed (photograph by Edwin Wesolowski, USGS).