MAJOR ISSUES AND FINDINGS
(B) Agriculture and Water Quality
This study focused on the relation between land use and water quality.
Agriculture, and particularly crop production, is the primary use of land in
the Red River Basin Study Unit. Streams and surficial sand and gravel aquifers are vulnerable to the effects of agricultural activities. These resources are important for public and commercial uses.
Nutrients
detected in streams and pesticides detected in streams and water in surficial aquifers did
not exceed any existing drinking-water standards and, except for a single instance for triallate, were not toxic to aquatic life.
A single sample from the Snake River (fig.
2) contained a triallate concentration of 0.28 microgram per
liter (µg/L), which exceeded the interim Canadian guidelines for the
protection of freshwater aquatic life (Canadian
Council of Ministers of the Environment, 1992). Twenty-seven percent of
the ground
water sampled in the west subregion and 8 percent of the ground water in
the southeast subregion exceeded the 10-mg/L drinking-water standard for nitrate (Cowdery, in
press). None of the ground water in the central subregion exceeded the
drinking-water standard for nitrate. Currently (1998), USEPA drinking-water
standards exist for 7 of the 44 pesticides detected in the basin. No ground
water exceeded any of the existing standards. Pesticide and nutrient
persistence and regional differences in soils, geology, and climate govern the
distribution of these water-quality indicators in the Red River Basin Study
Unit (Tornes and
others, 1997; Cowdery, 1997; and Cowdery, in press). Data from this study and previous studies were not sufficient to determine changes in pesticide levels over time. Continued monitoring might help to satisfy concerns about pesticide trends in water.
Streams draining areas of extensive cropland (central and southern parts of
the Study Unit) had the highest concentrations of nutrients (dissolved phosphorus,
nitrate, and organic nitrogen) and the most detections of herbicides (Tornes and others, 1997). No stream water exceeded any of the existing drinking-water standards for pesticides or nutrients.
Table 2 shows that selected indicators of water quality varied across the four
subregions, which generally relate to major categories of land use (fig. 2). The water-quality indicators used are commonly associated with agricultural land use but are also affected by environmental conditions, such as geology, soils, climate and hydrology.
Table 2. Water quality varies by major subregions in the Red River Basin Study Unit
[SW, surface water; GW, ground water (surficial aquifers); --, not sampled;
µg/L, micrograms per liter; mg/L, milligrams per liter; <, less than]
|
|
Value |
|
Water-quality |
Water |
Subregion |
Remarks or specific findings |
|
indicator |
resource |
West |
Central |
Northeast |
Southeast |
| Pesticides (µg/L) |
| Mean total, (mostly |
SW |
0.36 |
0.17 |
-- |
0.23 |
Central does not include the Red River as an indicator of this subregion. |
| herbicides) |
GW |
.01 |
.05 |
-- |
.03 |
Southeast had highest percent detection rate, but values were all low. |
| Nutrients (mg/L) |
| Median total nitrogen |
SW |
.67 |
1.02 |
0.82 |
.59 |
The Red River is a major source of nutrients to Lake Winnipeg. |
| Median nitrate nitrogen |
GW |
.39 |
<.05 |
-- |
<.05 |
Nitrate concentrations in ground water exceeded the USEPA drinking-water standard in 27, 0, and 8 percent of samples in the west, central, and southeast subregions, respectively. |
| Median total phosphorus |
SW |
.14 |
.14 |
.04 |
.03 |
Minnesota Pollution Control Agency goal is 0.10 mg/L phosphorus in rivers. |
| Median orthophosphate (dissolved) |
GW |
.03 |
.01 |
-- |
.02 |
Subregions with high nutrient levels do not necessarily have high pesticide levels. |
| Ecological indicator |
| Median Index of Biotic Integrity (IBI) |
SW |
41 |
25 |
36 |
43 |
These scores were strongly related to stream habitat. |
Pesticide concentrations in water are not related only to amounts used in agriculture.
Despite having a drainage area composed of 64 percent cropland, the Red River
delivered relatively low concentrations and loads of pesticides into Canada (table 3). Pesticide concentrations in water commonly were related to the drainage of water over and through agricultural soils, pesticide uptake by plants and microbes, and attachment to soil particles.
Table 3. The amount of pesticides in the Red River is a small percentage of the amount applied
[Units in pounds per year, except as indicated.]
| Pesticide |
Annual rate of application (1990) |
Load at Emerson (1993�95) |
Percent output |
Atrazine |
120,000 |
1,100 |
0.9 |
| Triallate |
450,000 |
270 |
.06 |
| 2,4-D |
1,700,000 |
370 |
.02 |
The most heavily applied pesticides (2,4-D, MCPA, bromoxynil, and trifluralin)
were not always the most frequently detected in streams and shallow aquifers
(fig. 7 and tables 6 and 7, p. 24-26) (Tornes and others,
1997; Cowdery, in press). The infrequency of 2,4-D detection may be
related to factors such as the following: (1) 2,4-D is applied as a
post-emergent herbicide and mostly is taken up by plants where it is
metabolized to other compounds, (2) soil microbes effectively degrade 2,4-D,
or (3) soils retain 2,4-D instead of allowing it to run off or seep downward
into ground water (Tornes and others, 1997). Triallate was detected in northern streams of the Study Unit, an area where it is most commonly applied to small grains. Triallate usually was applied during autumn and reached streams during spring snowmelt runoff.
 (14,755 bytes)
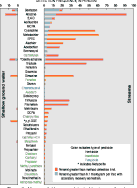
Figure 7. More pesticides were detected in streams than in shallow surficial ground water, and most were herbicides.
 (71,952 bytes)
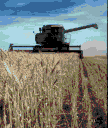
Wheat harvest is a major agricultural activity in August (photograph courtesy of Don Brennemen, University of Minnesota Agricultural Extension Service).
Some pesticides were ubiquitous.
Atrazine, applied on corn mostly in the southern part of the basin, and its
metabolite, deethylatrazine, were the most frequently detected pesticides in
streams throughout the basin and shallow ground water beneath cropland.
Atrazine was detected in nearly every stream sample collected from the basin,
even during winter. Simazine, commonly applied for weed control in
rights-of-way in the Study Unit, also was detected frequently in streams and
shallow ground water. Although DDT was banned for use in the United States
more than 20 years ago, low concentrations of DDT and its metabolites were
detected in stream sediments and fish tissues (Goldstein and others, 1996a; Brigham and others, 1996). The metabolite p,p'-DDE was detected in some ground water and streams. DDT and its metabolites are more prevalent in agricultural areas, indicating that residue from past DDT use is a more prevalent source than atmospheric transport from distant sources (outside of the Red River Basin Study Unit).
Cropland activity has contributed to nutrients found in streams and shallow ground water.
Nutrient concentrations were relatively low, but cropland activity has
increased the amount of nutrients (particularly phosphorus) available to
aquatic plants in streams (fig. 8). Phosphorus concentrations occasionally
were high enough to produce eutrophic conditions in streams and receiving
waters, such as lakes and wetlands. For example, streams draining the
western and central parts of the basin (mostly cropland) had the highest
concentrations of total phosphorus--0.12 to 0.32 mg/L. Streams draining the
eastern part of the basin (where the percent cropland is smaller) had the
lowest total phosphorus concentrations--0.08 mg/L or less. Concentrations of
dissolved and suspended phosphorus increased substantially during runoff after
snowmelt and rainfall. High phosphorus concentrations in the Pembina River
probably resulted from agricultural applications and naturally occurring
phosphorus in soils that is readily delivered to this river because of steep
terrain in the watershed. From 1975 to 1988, 60 percent of the phosphorus load
to Lake Winnipeg by the Red River came from the U.S. portion of the Red River
Basin (Brigham and others, 1996).
 (17,010 bytes)
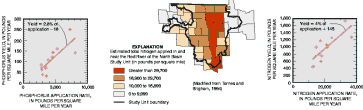
Figure 8. Cropland applications of nitrogen and
phosphorus have contributed nutrients to streams (1993-95).
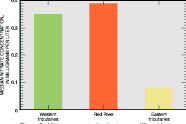
The median concentration of nitrate was higher in the Red River than in the tributaries (fig. 9). These values indicate that activities in and near the Red River are contributing to the nitrate concentrations in the river. These activities could be both agricultural and nonagricultural.
 (6,090 bytes)
Figure 9. Nitrate concentrations in streams differed by subregion in the Study Unit.
Generally, water in aquifers sampled for the Red River Basin Study Unit is
safe to drink relative to nutrients and herbicides (Cowdery, in press) (fig. 10). As related to
agricultural pesticide application, volatile organic compounds (VOCs) were not
detected in surficial aquifers (Cowdery, 1997; Cowdery, in
press). Concentrations of pesticides and nutrients in water from the
buried aquifers, naturally protected by overlying sediments, indicated no
significant contamination from irrigation (Cowdery, in press).
 (9,652 bytes)
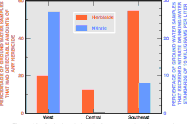
Figure 10. Agricultural chemical concentrations in ground water differed by subregion in the Study Unit.
Detections of pesticides and nitrate in shallow ground water were related to cropland in sandy soils over coarse-textured aquifers.
Nitrate concentrations near the water table exceeded the drinking-water
standard (10 mg/L) in some areas but decreased significantly at greater depths
in the surficial aquifers (Cowdery, 1997).
Irrigation has enhanced crop production in some areas by allowing for
increased yields and a greater variety of crops. Increased applications of
fertilizer and pesticides are sometimes associated with irrigation. Irrigation
has also been associated with pesticides and nutrients reaching parts of some
surficial aquifers. The concentrations of pesticides in shallow ground water
in the irrigated parts of the Otter Tail outwash aquifer (fig. 11) are higher than
elsewhere in the Study Unit and indicate the potential for contamination in
deeper ground water (Cowdery, 1997).
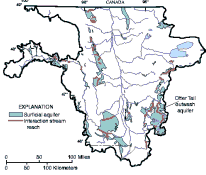 (13,302 bytes)
Figure 11. Several sites of possible stream-aquifer interaction occur in the Red River of the North Basin Study Unit.
A detailed study of the Otter Tail outwash aquifer (see page 22) that included analyses of ground-water
age, water chemistry, and historical land use showed a trend of increased
nitrate and nitrogen levels over the past 30 years (Stoner and others, 1997). The combination of irrigation, sandy soils, aquifer materials with low carbon content, and conditions not favorable for biological reduction of nitrate resulted in elevated nitrate in the shallow ground water.
The Otter Tail outwash aquifer, with high nitrate concentrations near the
water table, discharged water with low nitrate concentrations to the Otter Tail
River, according to one intensive case study (Puckett and others, 1995; Tornes and others, 1996; Stoner and others, 1997). Mixing with older,
low-nitrate ground water and denitrification (whereby nitrate was
transformed to nitrogen gas and removed from the water) as water flowed
beneath riparian wetlands accounted for the low concentrations of nitrate
discharging to the river. These conditions helped reduce the possibility of eutrophication in the river and downstream lakes and wetlands. Figure 11 shows other areas in the Study Unit where surficial aquifers potentially discharge water to streams.
A direct link between pesticides and nutrients in streams and fish communities was not established.
Fish were studied as part of the overall assessment of stream quality.
Detailed analysis showed that both chemical and physical factors affect the
composition of fish communities in the streams of the Study Unit. Specific
cause-and-effect relations could not be established, however. Differences in
fish communities could not be explained directly by differences in
concentrations of nutrients and pesticides in streams in agricultural areas
(Goldstein and
others, 1996b). Only one pesticide (triallate) was detected in one stream
sample that exceeded a level of concern for acute toxicity to aquatic
organisms (Tornes
and others, 1997). More work will be helpful to better assess the effects
of nutrients on the aquatic food chain and the effects of pesticides on the
reproductive abilities of fish (Goodbred and others, 1997).
Limitations of this assessment of agriculture and water quality should be recognized.
Some insecticides and most fungicides applied to specialty crops, such as potatoes and sugar beets, were not analyzed in this study; also, the results of this water-quality assessment likely were affected by the unusually wet summers that occurred during the period of intensive sampling (1993-95). Dilution or increased loads to streams or surficial aquifers were possible as a result of these wet conditions. Therefore, the relation established between agriculture and water quality during this study may not represent average conditions.
Fish distribution and abundance may not be a good indicator of nutrient effects on stream quality. Most of the nutrients enter the stream early in the spring when temperatures are low and most metabolic rates for aquatic plants and animals likewise are low. Therefore, the amount of nutrients applied in a watershed correlated poorly with fish distribution and abundance.
Currently (1998), drinking-water standards are set only for individual
pesticides. However, pesticides commonly occur in mixtures of up to nine
compounds in surface water that is a potential source of drinking water.
Although most shallow ground water did not contain detectable concentrations
of pesticides, more than one pesticide commonly was detected in water where
there were detectable concentrations. The health effects of such combinations
of pesticides in drinking water are not well understood. However, the effects
of various pesticides on human health may differ when pesticides are present
in combination, even at low concentrations, in drinking water. The USEPA (1994) is considering establishing drinking-water standards for combinations of triazine pesticides and their individual degradation products.
 (14,755 bytes)
 (71,952 bytes)
 (17,010 bytes)
 (6,090 bytes)
 (13,302 bytes)