
Hydrologic Benchmark Network Stations in the Eastern U.S. 1963-95 (USGS Circular 1173-A)
| Abstract and Map Index | List of all HBN Stations | Introduction to Circular | Analytical Methods |
To download a printer friendly PDF version of this information click here.
This report details one of the approximately 50 stations in the Hydrologic Benchmark Network (HBN) described in the four-volume U.S. Geological Survey Circular 1173. The suggested citation for the information on this page is:
|
All of the tables and figures are numbered as they appear in each circular. Use the navigation bar above to view the abstract, introduction and methods for the entire circular, as well as a map and list of all of the HBN sites. Use the table of contents below to view the information on this particular station.
|
|
| 1. Site Characteristics and Land Use |
| 2. Historical Water Quality Data and Time-Series Trends |
| 3. Synoptic Water Quality Data |
| 4. References and Appendices |
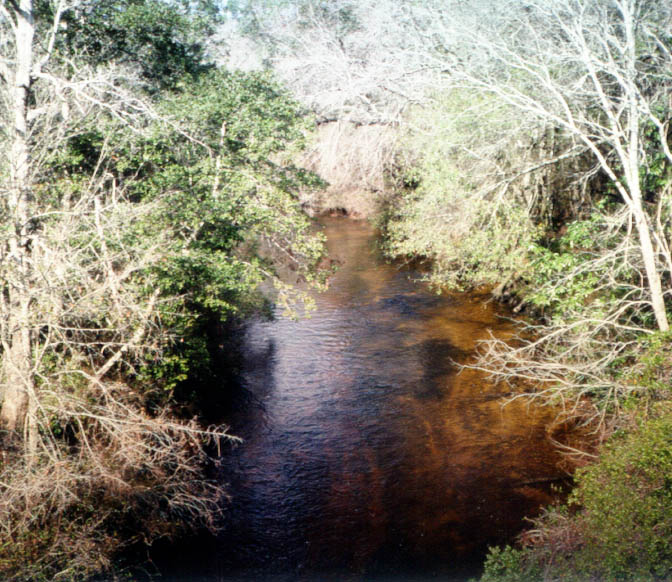
The Blackwater River HBN Basin is in the Coastal Plain physiographic province (Atwood, 1940) in southern Alabama (Figure 2. Map of the study area in the Blackwater River Basin and photograph of the stream channel near the gage). The HBN basin drains 227 km² of rolling terrain that is interspersed with sinkholes and bays, some of which hold water year-round. The USGS gaging station is 1.6 km east of
 |
The basin lies in the Outer Coastal Plain Mixed Forest ecoregion, which is characterized by temperate evergreen forests (Bailey and others, 1994). Vegetation communities and soil types are closely related to the two major landform types in the basin--pine hills and bays. The pine hills landform covers more than 75 percent of the basin and consists of upland ridges with gently sloping side slopes. The pre-logging vegetation of the pine hills was a park like forest composed of more than 75 percent longleaf pine with an understory of wire grass. Secondary species, such as slash pine, southern red oak, and post oak, began to increase in numbers after the area was logged around the turn of the century. Soils in the pine hills are mapped in the Benndale-Orangeburg-Troup association and are developed in unconsolidated fluvial sediments and have a loam or sandy clay loam subsoil (Cotton, 1989). These soils tend to be highly permeable and acidic (pH 4.5 to 6.0) and have a low organic-matter content (less than 4 percent). The bay landform, which is found in the eastern half of the basin, has very little topographic relief and is almost entirely composed of wetlands. Bay vegetation is dominated by sweet bay, bull bay, and red bay with secondary species, such as swamp tupelo, slash pine, pond pine, sweet gum, and water oak. Soils are mapped in the Doravon association and are developed in highly decomposed acidic organic matter. These soils tend to be deep, very poorly drained, and have a mucky peat subsoil (Cotton, 1989).
Bedrock in the basin includes gently dipping, unconsolidated fluvial sediments of the Miocene Catahoula Sandstone and the Paynes Hammock Sand (Cagle, 1963). Both units consist of light gray to white sand, sandy clay, and clay deposits with subordinate beds of gravel. The sandstones are composed of fine- to coarse-grained, sub angular to rounded quartz with limonite cement in some layers. The clay is predominantly kaolinite, but mica and lignite are common in some places.
The Blackwater River Basin drains parts of Escambia and Covington Counties and is entirely in the boundaries of the Conecuh National Forest. About 10 percent of land in the northeast corner of the basin also is in the boundaries of the Blue Springs Wildlife Management Area. About 32 percent of land in the National Forest boundary is owned by private individuals or logging companies. More than 150 km of forest and county roads provide vehicle access to most areas of the basin.
 |
Current land cover in the basin is 89 percent forest land, 10 percent agricultural land, and 1 percent residential development (Ray Albright, U.S. Department of Agriculture Forest Service, written commun., 1996). The principal land-use activity on both Federal and private land is timber production. Other land-use activities in the basin include cattle grazing, row-crop farming, road networks, rural residences, and recreation. The only discernible shift in land use during the past 30 years has been the conversion of some farm land into forest land (Ray Albright, written commun., 1996). The residential population of the basin has remained relatively stable since the HBN station was established, although recreational use, particularly hunting, has increased significantly during the past 10 years. Forest management policies of the National Forest are directed at maintaining the health and abundance of the major pine species and providing habitat for the endangered red-cockaded woodpecker. Pines are harvested on an 80- to 120-year rotation with some intermediate thinning at 20 to 30 years. Tractor logging is the sole harvest method in the basin. Most cuts in the Conecuh National Forest range from 2 to 30 ha in size and are primarily shelterwood or seedtree cuts, although clearcutting was more prevalent in the past. Clearcutting is the most common harvesting method used on private land, and cuts may exceed 200 ha in size (Ray Albright, written commun., 1996).
The data set analyzed for this report includes 95 water-quality samples that were collected from November 1976 through September 1995. Sampling frequency ranged from six to nine samplings per year from 1977 through 1982 and quarterly from 1983 through 1995, although no samples were collected in 1984. Samples were analyzed at the Central Laboratory in Atlanta, Ga., from 1976 through 1985 and at the NWQL in Arvada, Colo., from 1986 through 1995. Daily discharge records for the Blackwater River (station 02369800) are available beginning in October 1967, and records of daily water temperature at the gage are available for October 1967 through September 1969. A precipitation gage was operated at the site in the late 1960's and early 1970's, but the data were not published.
Calculated ion balances for 80 samples with complete major ion analyses are shown in Figures 3a. and 3b. Temporal variation of discharge, field pH, major ion concentrations, and ion balance at Blackwater River, Alabama. Ion balances ranged from - 45 to + 47 percent, and more than 40 percent of the samples had calculated values outside the 10 percent range. This wide range of values is not unexpected considering the difficulties in making precise analytical measurements at the low solute concentrations typical of this station. The mean charge balance of all samples was 3.7 percent, indicating an excess of measured cations over anions in solution. Considering the tealike color of stream water at this site, it is reasonable to assume that the anion deficit is because of the presence of unmeasured organic anions.
Time-series plots of the major dissolved constituents were inspected for evidence of method-related effects . Several notable patterns were observed in the base cation and sulfate concentrations. For example, several extremely high sulfate concentrations were reported during the late 1980's. This pattern coincides with the use of a turbidimetric titration for sulfate analysis at the NWQL between March 1986 and December 1989 (Fishman and others, 1994). In 1989, the NWQL determined that sulfate concentrations can be overestimated by this technique and changed the method to ion chromatography (Office of Water Quality Technical Memorandum No. 90.04, Turbidimetric Sulfate Method, issued December 21, 1989, at URL http://water.usgs.gov/admin/memo/). The bias was most pronounced in dilute waters, although it was not consistent among samples and appeared to be influenced by factors such as color and turbidity (Schertz and others, 1994). Calcium, magnesium, and sodium concentrations all had a similar pattern of high scatter in the early part of the record and low scatter after 1983. This pattern coincides with a change in the analysis method for major dissolved cations and trace inorganic constituents beginning in water year 1983 from atomic absorption (AA) spectroscopy to inductively coupled plasma (ICP) spectroscopy (Office of Water Quality Technical Memorandum No. 82.18, National Water-Quality Networks, issued September 28, 1982, at URL http://water.usgs.gov/admin/memo/). The observed temporal patterns in calcium, magnesium, and sodium, therefore, probably reflect a difference in the precision of these two analytical methods. Changes in field procedures also may have introduced bias into the historical data set.
 |
The time-series plot of field pH measurements in figure 3 shows a definite downward shift in the field pH values in the early 1980's. This coincides with the release of a memorandum in early 1981 that provided guidelines for obtaining accurate pH measurements in low-conductivity waters (Office of Water Quality Technical Memorandum No. 81.08, Electrodes for pH Measurement in Low-Conductivity Waters, issued February 10, 1981, at URL http://water.usgs.gov/admin/memo/). Although it was not required that measurements at HBN stations were made according to these guidelines, it is likely that many field offices changed the procedures and equipment they used for pH measurements shortly after this memorandum was issued.
Median concentrations and ranges of major constituents in stream water collected at the HBN gaging station and VWM concentrations in wet-only deposition measured at the Quincy NADP station in Florida, about 230 km southeast of the basin, are presented in table 2. Wet-precipitation chemistry at the NADP station is dilute and slightly acidic, with a VWM pH of 4.8 during the 11 years of record. The dominant cations in precipitation were hydrogen, which contributed 41 percent of the total cation charge, and sodium and ammonium, which contributed 28 and 13 percent, respectively. Sulfate was the dominant anion, contributing 49 percent of the total anions, and chloride and nitrate accounted for 29 and 22 percent, respectively. These results indicate that solutes in precipitation at the nearby NADP station probably are a mixture of strong acids derived from anthropogenic emissions of sulfur and nitrogen compounds and salt derived from marine aerosols (Fu and Winchester, 1994).
[Concentrations in units of microequivalents per liter, discharge in cubic meters per second, specific conductance in microsiemens per centimeter at 25 degrees Celsius, and silica in micromoles per liter; n, number of stream samples; VWM, volume-weighted mean; inst., instantaneous; spec cond., specific conductance; <, less than; --, not reported.]
|
Parameter |
Stream Water |
Precipitation VMNa |
|||||
|
Minimum |
First Quartile |
Median |
Third Quartile |
Maximum |
n |
||
|
Discharge, inst. |
0.71 |
1.4 |
2.4 |
4.0 |
25 |
94 |
-- |
|
Spec. cond., field |
15 |
20 |
23 |
27 |
42 |
90 |
-- |
|
pH, field |
3.5 |
4.4 |
4.9 |
5.5 |
7.1 |
93 |
4.8b |
|
Calcium |
<5.0 |
30 |
36 |
50 |
160 |
94 |
3.5 |
|
Magnesium |
<8.0 |
32 |
38 |
41 |
88 |
95 |
2.8 |
|
Sodium |
30 |
61 |
70 |
78 |
140 |
95 |
11 |
|
Potassium |
<2.6 |
5.1 |
5.1 |
7.7 |
26 |
95 |
0.7 |
|
Ammonium |
<0.7 |
1.4 |
1.4 |
1.4 |
10.7 |
45 |
5.0 |
|
Alkalinity, laboratory |
<20 |
<20 |
40 |
40 |
100 |
86 |
-- |
|
Sulfate |
<21 |
21 |
35 |
58 |
310 |
92 |
20 |
|
Chloride |
42 |
73 |
82 |
96 |
160 |
93 |
12 |
|
Nitrite plus nitrate |
<0.3 |
7.1 |
7.1 |
14 |
23 |
49 |
9.2c |
|
Silica |
35 |
89 |
100 |
120 |
160 |
94 |
-- |
aData are volume-weighted mean concentrations for 1983-94.
bLaboratory pH.
cNitrate only.
Stream chemistry in the Blackwater River is very dilute and slightly acidic; specific conductances ranged from 15 to 42 m S/cm and were slightly acidic, and the median pH was 4.9. Organic acids, leached from vegetation in wetlands, give the stream water a tealike color and probably are the dominant source of stream-water acidity. The major cation in stream water was sodium and the dominant anion was chloride. The low concentration of the major weathering products, particularly alkalinity and divalent cations, is attributed to the lack of weatherable minerals in the underlying quartz-rich sediments. The median chloride concentration in stream water was 82 m eq/L, which is about six times larger than the VWM concentration of 12 m eq/L in precipitation. On the basis of the difference between average annual runoff and precipitation, evapotranspiration can account for no more than a threefold increase in the concentration of precipitation, indicating that stream-water chloride is derived from sources other than wet deposition. Considering the proximity of this station to the Gulf of Mexico and the almost equal concentrations of sodium and chloride, it seems plausible that dry deposition of marine aerosols is an important source of chloride (and sodium) in stream water at this station. The median concentration of sulfate in stream water was 35 m eq/L compared to 20 m eq/L in precipitation, which is somewhat smaller than expected, considering the combined effects of evapotranspiration and inputs in dry deposition, which indicates a substantial amount of sulfate is retained in the basin. The retention of sulfate by the basin may be because of sulfate adsorption on soils or, alternatively, sulfate reduction in the large areas of the basin covered by wetlands. The basin also retains most atmospheric nitrogen inputs, based on the smaller concentrations of both nitrate and ammonium in stream water compared to precipitation. In addition, these low stream-water concentrations indicate that upstream agricultural activities have little or no effect on inorganic nitrogen concentrations at the gage.
 |
The solute composition of stream water was further evaluated by analyzing correlations between solutes and discharge (table 3). Discharge was poorly correlated with most dissolved constituents, with the exception of weak inverse correlations with alkalinity (r = - 0.437) and magnesium (r = - 0.442). Correlations among the solutes also were weak with the exception of a positive correlation between pH and alkalinity (r = 0.540). The lack of correlations among most parameters probably is because of the narrow range of solute concentrations measured at this station. The quartz-rich sediments underlying the basin are relatively unreactive and produce dilute soil and ground waters that are not significantly different in composition from the incoming precipitation. Hydrologic characteristics of the basin also may contribute to maintaining a constant stream-water composition. The highly permeable soils result in rapid infiltration of precipitation into the ground-water system, which in turn provides a constant source of stream water throughout the year.
[Q, discharge; Ca, calcium; Mg, magnesium; Na, sodium; K, potassium; Alk, alkalinity; SO4 ,sulfate; Cl, chloride; Si, silica]
|
|
Q |
pH |
Ca |
Mg |
Na |
K |
Alk |
SO4 |
Cl |
|
pH |
-0.503 |
-- |
-- |
-- |
-- |
-- |
-- |
-- |
-- |
|
Ca |
-0.277 |
0.339 |
-- |
-- |
-- |
-- |
-- |
-- |
-- |
|
Mg |
-0.442 |
0.163 |
0.388 |
-- |
-- |
-- |
-- |
-- |
-- |
|
Na |
-0.281 |
0.263 |
0.473 |
0.500 |
-- |
-- |
-- |
-- |
-- |
|
K |
0.036 |
-0.053 |
0.211 |
0.347 |
0.092 |
-- |
-- |
-- |
-- |
|
Alk |
-0.437 |
0.540 |
0.295 |
0.332 |
0.143 |
0.092 |
-- |
-- |
-- |
|
SO4 |
0.113 |
-0.372 |
-0.031 |
0.134 |
0.241 |
0.120 |
-0.293 |
-- |
-- |
|
Cl |
0.175 |
-0.375 |
-0.186 |
-0.026 |
0.087 |
0.098 |
-0.368 |
0.266 |
-- |
|
Si |
-0.182 |
0.264 |
0.314 |
0.342 |
0.328 |
0.314 |
0.182 |
-0.198 |
0.229 |
Results of the seasonal Kendall test for trends in discharge and major dissolved constituents are shown in table 4. Statistically significant downward trends were observed for calcium and sodium at the 0.01 confidence level. Trends in both calcium and sodium were similar for unadjusted and flow-adjusted concentrations, indicating that trends were not driven by variations in stream discharge. The LOWESS curves in figure 3 show that most of the decrease in calcium and sodium occurred around the mid-1980's. As discussed previously, this pattern probably was caused by a change in analytical procedure in 1983. A more detailed examination of the data revealed that calcium and sodium concentrations continued to decrease through the latter part of the record. Calculation of trends for the period 1984 through 1995 showed statistically significant downward trends not only for calcium (p = 0.005) and sodium (p = 0.011) concentrations, but for magnesium (p = 0.007) and chloride (p = 0.002) concentrations as well. Because these trends occurred after the change in analytical method, it is possible that they were caused by environmental factors, such as changes in land use or precipitation chemistry. A recent study reported significant downward trends in calcium and magnesium concentrations at many NADP stations in the Southeast between 1980 and 1992 (Lynch and others, 1995). The only substantial change in land use during the period of record was a slight decrease in the amount of agricultural land.
[Trends in units of microequivalents per liter per year, except discharge in cubic meters per second per year, pH in standard units per year, and silica in micromoles per liter per year; <, less than; --, not calculated.]
|
Parameter |
Unadjusted |
Flow adjusted |
||
|
Trend |
p-value |
Trend |
p-value |
|
|
Discharge |
0.02 |
0.454 |
-- |
-- |
|
pH, field |
-0.02 |
0.060 |
-0.02 |
0.040 |
|
Calcium |
-1.2 |
0.000 |
-1.2 |
0.000 |
|
Magnesium |
<0.1 |
0.589 |
-0.1 |
0.490 |
|
Sodium |
-0.9 |
0.000 |
-1.0 |
0.000 |
|
Potassium |
<0.1 |
0.325 |
(b) |
-- |
|
Alkalinity, laboratory |
<0.1a |
0.029 |
-- |
-- |
|
Sulfate |
-0.3 |
0.541 |
(b) |
-- |
|
Chloride |
-0.2 |
0.494 |
(b) |
-- |
|
Nitrite plus nitrate |
0.1 |
0.313 |
-- |
-- |
|
Silica |
-0.4 |
0.303 |
-0.2 |
0.375 |
a Calculated using a trend test for censored data.
b Flow model not significant at alpha = 0.10.
Results of the surface-water synoptic sampling of January 15, 1991, are given in table 5; locations of sampling sites are shown in figure 2. Discharge at the gage was 3.7 m3/s compared to the median daily discharge of 3.8 m3/s for January (Lawrence, 1987), indicating that the basin was sampled during normal flow conditions for that time of year. Solute concentrations measured at the gage (site 1) during the synoptic sampling were generally between the first- and third-quartile concentrations at the gage during the entire period of record except for magnesium and sulfate, which were both larger than the third-quartile concentrations (table 2). Tributary streams were similar in composition to the gage, with sodium and chloride the dominant ions, and most were acidic (pH 3.82 to 5.37). All but one sample had positive ion balance ( - 2.1 to 11.5), inferring the presence of unmeasured organic anions. This organic component probably is the source of most stream-water acidity, although some acidity also may be derived from strong acid inputs in precipitation.
[Site locations shown in Figure 2; Q, discharge in cubic meters per second; SC, specific conductance in microsiemens per centimeter at 25 degrees Celsius; pH in standard units; Ca, calcium; Mg, magnesium; Na, sodium; K, potassium; Alk, alkalinity; SO4 ,sulfate; Cl, chloride; NO3 , nitrate; concentrations in microequivalents; Si, silica in micromoles per liter; <, less than; --, not measured.]
|
Site |
Station Number |
Q |
SC |
pH |
Ca |
Mg |
Na |
K |
Alk |
SO4 |
Cl |
NO3 |
Si |
Criteria a |
Remarks |
|
1 |
|
3.68 |
32 |
4.52 |
39 |
49 |
74 |
6 |
<10 |
79 |
93 |
11 |
130 |
-- |
-- |
|
2 |
310159086425800 |
.045 |
32 |
5.37 |
50 |
79 |
96 |
16 |
<10 |
77 |
140 |
13 |
120 |
LU |
Farming in subbasin |
|
3 |
310337086440500 |
-- |
32 |
4.41 |
25 |
41 |
74 |
3 |
<10 |
94 |
90 |
1 |
150 |
LT |
Undeveloped, pine hills |
|
4 |
310556086431000 |
-- |
24 |
4.87 |
31 |
38 |
74 |
6 |
<10 |
60 |
87 |
6 |
120 |
LU |
Some farming |
|
5 |
310556086431100 |
.032 |
29 |
4.67 |
16 |
22 |
83 |
2 |
<10 |
63 |
82 |
1 |
150 |
LT |
Undeveloped, pine hills |
|
6 |
310421086411800 |
.051 |
16 |
5.02 |
13 |
14 |
61 |
10 |
<10 |
14 |
73 |
<0.7 |
110 |
LT |
Undeveloped, pine hills |
|
7 |
310423086400200 |
.31 |
35 |
4.67 |
49 |
75 |
78 |
10 |
<10 |
123 |
96 |
4 |
140 |
MT, LT |
Undeveloped, pine hills |
|
8 |
310259086382100 |
.74 |
62 |
3.92 |
49 |
60 |
83 |
5 |
<10 |
110 |
120 |
8 |
130 |
LU, LT |
Drains large wetland area |
|
9 |
310533086365700 |
.16 |
63 |
3.82 |
31 |
54 |
91 |
4 |
<10 |
170 |
87 |
<0.7 |
16 |
LT |
Drains large wetland area |
a Criteria used in selection of sampling sites: LT = landform type, MT = major tributary, LU = land use.
The analyses presented in table 5 indicate there was little spatial variability in surface-water chemistry at the time of the synoptic sampling. This invariance probably is because of the unreactive nature of the underlying quartz-rich sediments, which produce dilute soil and ground waters that are not significantly different in composition from the incoming precipitation. The one spatial pattern that does emerge from the data appears to reflect the distribution of landform types in the basin. This can be seen by comparing the chemistry of streams that drain bay areas in the eastern one-half of the basin (sites 7-9) with the chemistry of streams that drain pine hills landscape in the western one-half of the basin (sites 2-6). In general, the bay streams were more acidic and had larger sulfate concentrations and larger charge imbalances than the pine hill streams. These results probably reflect differences in the relative contributions of surface runoff and ground-water discharge to streamflow in these two areas of the basin. Human activities in the basin appeared to have a small but perceptible effect on surface-water chemistry during the sampling period. For example, the subbasins with agriculture or residential development, such as Fish Trap Branch (site 2) and Blackwater Creek near Falco (site 8), had elevated concentrations of chloride compared to streams that drain relatively undisturbed subbasins (sites 3, 5, 6, 7, and 9). Nitrate concentrations were very low at all sampling sites but also were slightly elevated in Fish Trap Branch (site 2) and Blackwater Creek near Falco (site 8).
Bailey, R.G., Avers, P.E., King, T., and McNab, W.H., eds., 1994, Ecoregions and subregions of the United States with supplementary table of map unit descriptions: Washington, D.C., U.S. Department of Agriculture Forest Service, scale 1: 7,500,000 (also at URL http://www.fs.fed.us/land/ecosysmgmt/ecoreg1_home.html).
Cagle, J.W., 1963, Geology and ground-water resources of Escambia County, Alabama: Geological Survey of Alabama Bulletin 74, 205 p.
Cotton, J.A., 1989, Soil survey of Covington County, Alabama: U.S. Department of Agriculture Soil Conservation Service, 156 p.
Fishman, M.J., and Friedman, L.C., eds. 1989, Methods for determination of inorganic substances in water and fluvial sediments: U.S. Geological Survey Techniques of Water-Resources Investigations, book 5, chap. A1, 545 p.
Fu, J.M., and Winchester, J.W., 1994, Sources of nitrogen in three watersheds of northern Florida, USA - Mainly atmospheric deposition: Geochemica et Cosmochimica Acta, v. 58, no. 6, p. 1581-1590.
Lynch, J.A., Grimm, J.W., and Bowersox, V.C., 1995, Trends in precipitation chemistry in the United States - A national perspective, 1980-1992; Atmospheric Environment, v. 29, no. 11, p. 1231-1246.
Lawrence, C.L., 1987, Streamflow characteristics at hydrologic benchmark stations: U.S. Geological Survey Circular 941, 123 p.
Schertz, T.L., Wells, F.C., and Ohe, D.J., 1994, Sources of trends in water-quality data for selected streams in Texas, 1975-89 water years: U.S. Geological Survey Water-Resources Investigation 94-4213, 49 p.
U.S. Geological Survey, published annually, Water resources data, Alabama, Montgomery: U.S. Geological Survey Water Data Report.
Office of Water Quality Technical Memorandum No. 90.04, Turbidimetric Sulfate Method, issued December 21, 1989, at URL http://water.usgs.gov/admin/memo/.
Office of Water Quality Technical Memorandum No. 82.18, National Water-Quality Networks, issued September 28, 1982, at URL http://water.usgs.gov/admin/memo/.
Office of Water Quality Technical Memorandum No. 81.08, Electrodes for pH Measurement in Low-Conductivity Waters, issued February 10, 1981, at URL http://water.usgs.gov/admin/memo/.
Blackwater River near Bradley, Alabama (Station 02369800)
a. U.S. Geological Survey topographic maps:
b. Geologic Maps:
c. Soil Surveys:
d. Other maps:
Table B-1. NWIS site identification numbers and site names for water-quality sampling sites.
|
Site |
Identification Number |
Site Name |
|
1 |
02369800 |
BLACKWATER RIVER NEAR BRADLEY, ALABAMA |
|
2 |
310159086425800 |
FISH TRAP BR AT BRADLEY, ALABAMA |
|
3 |
310337086440500 |
MILLER CR AT FS RD 311 NR BRADLEY, ALABAMA |
|
4 |
310556086431000 |
BEAR CR AT FS RD 305 NR DIXIE, ALABAMA |
|
5 |
310556086431100 |
BEAR HEAD CR AT FS RD 311 NR BRADLEY, ALABAMA |
|
6 |
310421086411800 |
HURRICANE CR AT COUNTY RD 68 NR BRADLEY, ALABAMA |
|
7 |
310423086400200 |
PANTHER CR AT COUNTY RD 68 NR BRADLEY, ALABAMA |
|
8 |
310259086382100 |
BLACKWATER CR NR FALCO, ALABAMA |
|
9 |
310533086365700 |
BLACKWATER CR NR POSSUM POCKET, ALABAMA |
| Back to 1173-A Contents |
This page maintained by Nichole Bisceglia.
Last updated July 31, 2000.