
Hydrologic Benchmark Network Stations in the Eastern U.S. 1963-95 (USGS Circular 1173-A)
| Abstract and Map Index | List of all HBN Stations | Introduction to Circular | Analytical Methods |
Sipsey Fork near Grayson, Alabama (Station 02450250)
To download a printer friendly PDF version of this information click here.
This report details one of the approximately 50 stations in the Hydrologic Benchmark Network (HBN) described in the four-volume U.S. Geological Survey Circular 1173. The suggested citation for the information on this page is:
|
All of the tables and figures are numbered as they appear in each circular. Use the navigation bar above to view the abstract, introduction and methods for the entire circular, as well as a map and list of all of the HBN sites. Use the table of contents below to view the information on this particular station.
|
|
| 1. Site Characteristics and Land Use |
| 2. Historical Water Quality Data and Time-Series Trends |
| 3. Synoptic Water Quality Data |
| 4. References and Appendices |
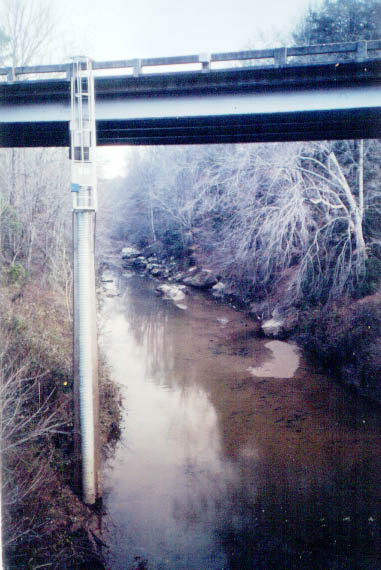
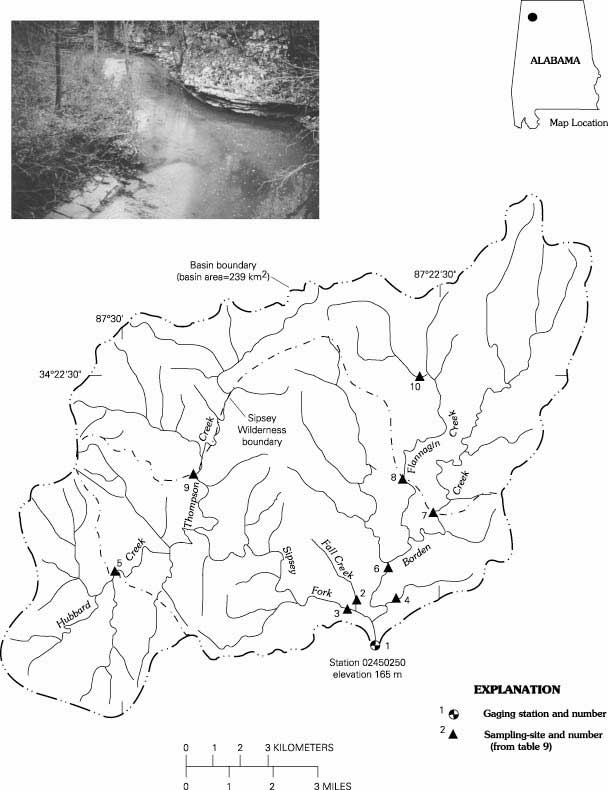
The Sipsey Fork HBN Basin lies in the Cumberland Plateau section of the Appalachian Plateaus physiographic province in northwestern Alabama (Figure 4. Map showing study area in the Sipsey Fork Basin and photograph of the stream channel near the gage ). The topography is characterized by a gently rolling plateau that is dissected by a well-developed drainage pattern with canyon-like bluffs and narrow flood plains. The Sipsey Fork drains 239 km² of this deeply dissected terrain and ranges in elevation from 165 to 325 m. The USGS gaging station is 7.2 km west of Grayson, Ala., at latitude 34°17'07'' and longitude 87°23'56''. Sipsey Fork is a southeast-flowing tributary of the Black Warrior River with a channel length of 17 km upstream from the gage and an average stream gradient of 5.3 m/km. The main channel is perennial, and mean monthly discharge is strongly seasonal, varying from 0.52 m³/s in August to 10.7 m³/s in March. Average annual runoff from the basin was 62 cm for the period 1967 through 1995 (U.S. Geological Survey, Water Resources Data, Alabama). A distinguishing hydrologic characteristic of the Sipsey Fork is its rapid flow response to precipitation events. This rapid response is the result of a combination of basin characteristics including steep topography, deeply incised stream channels, and shallow soils (U.S. Department of Agriculture, 1988). Climate of the area is characterized by long, moderately hot summers and short, mild winters (Smalley, 1979). Average monthly temperatures range from 5°C in January to 25.5°C in July, and the area has an average frost-free period of 220 days per year. Average annual precipitation is 145 cm, which is fairly evenly distributed throughout the year; March is the wettest month and October the driest (Smalley, 1979). Snowfall seldom exceeds a few centimeters and usually melts within a few days.
 |
The Sipsey Fork Basin is at the northern extent of the Southern Mixed Forest ecoregion (Bailey and others, 1994) and supports a wide diversity of plant communities and species because of the variety of landforms, soils, and moisture conditions found in the area (U.S. Department of Agriculture, 1988). Dry ridgetop sites and uplands are covered by hardwood and pine forest types dominated by white oak, chestnut oak, blackgum, hickories, shortleaf pine, Virginia pine, and southern red oak. Understory species include sassafras, huckleberry, big leaf magnolia, dogwood, and persimmon. The cool and moist conditions in the cove and canyon areas provide suitable habitat for Appalachian flora. Common overstory species in these areas are hemlock, yellow poplar, river birch, red maple, beech, and white oak. Understory species include oak-leaf hydrangea, big leaf magnolia, viburnum, dogwood, and box elder. Most soils in the area are highly leached Ultisols belonging to the Montevallo-Enders-Townley soil association (Harkins, 1981). Soils in the southern and northwestern part of the basin are primarily shaley silt loams that have developed in sandstone and shale of the Pottsville Formation. They tend to be deep and moderately permeable and contribute to sustaining streamflow during dry periods in late summer. In contrast, soils in the northeastern part of the basin are developed primarily in limestone and tend to be thin and rocky. These soils are significantly less permeable than soils elsewhere in the basin and are one cause for the flashy behavior of the stream during storm events (U.S. Department of Agriculture, 1988).
Bedrock in the basin consists of gently dipping, marine, sedimentary rocks of Late Mississippian and Early Pennsylvanian age (Schweinfurth and others, 1981). The oldest unit is the Bangor Limestone, which principally crops out along drainages in the northeastern part of the drainage basin. The unit is described as a white to light gray limestone having several zones of interbedded shale and claystone. Overlying the Bangor Limestone are the Parkwood and Pottsville Formations, which crop out in the northwest and central sections of the basin. The Parkwood Formation consists of interbedded sandstone, shale, mudstone, siltstone, claystone, and carbonaceous shale and contains several thin but nonpersistent coal beds. The Pottsville Formation consists of a cliff-forming, coarse-grained, pebbly sandstone separated by interbedded layers of shale and fine-grained sandstone.
The Sipsey Fork Basin drains parts of Lawrence and Winston Counties in northwestern Alabama and is entirely in the boundaries of the William B. Bankhead National Forest. Almost 40 percent of the National Forest land is in the Sipsey Wilderness, and 72 km of the river corridor including the Borden Creek tributaries are designated components of the National Wild and Scenic River System. The entire basin also is in the boundaries of the Black Warrior Wildlife Management Area, which is under the jurisdiction of the Alabama State Division of Game and Fish. Private holdings, which account for about 9 percent of the land, tend to be concentrated along the northern and western basin boundaries. Non wilderness areas of the basin are accessible by way of several gravel and paved roads. The wilderness is almost entirely encircled by roads, although access into the interior is limited to foot trails. The lower section of river is generally floatable by canoe for between 20 and 60 days each spring.
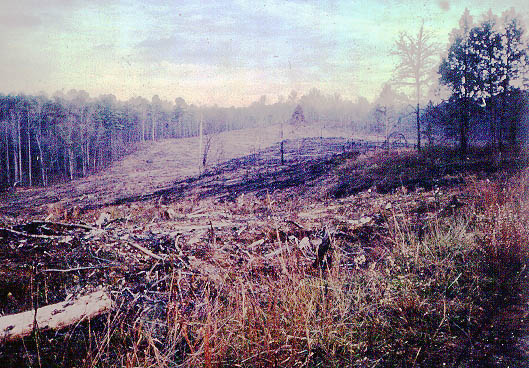
Most forests in the basin were logged at some time during the past century, although small patches of virgin timber still remain in inaccessible canyons where farming and logging are impractical. Natural occurrences also have left their mark on the forest communities during the past century, including the southern pine beetle infestation, American chestnut blight, fires, and tornadoes. Since the establishment of the HBN station, land-use activities in the basin have been limited primarily to timber production and recreation. Logging occurs in nonwilderness areas of the basin in small clearcut and thinning operations on a 60-year rotation for pines and a 100-year rotation for hardwoods. About 500 ha of forest land was harvested in the basin from 1992 through 1995 in plots that ranged from 4 to 84 ha in size (James Ramey, Forest Service, written commun., 1996). The Sipsey Wilderness was established in 1975 and is used primarily for back-country recreation, averaging more than 10,000 visitors per year. The management objective for the wilderness is to maintain the system of natural processes that governs the distribution of plant communities and to allow these natural processes to operate freely. Guidelines for managing components of the Wild and Scenic River System include maintaining the existing free-flowing character of the river, preventing degradation of existing water quality, and preserving natural scenic values. The only recreational facility in the basin is a picnic area near the gage. The Forest Service has operated an aerosol sampler in the basin since 1989 as part of an interagency network to monitor visibility in National Parks and Wilderness Areas (Sisler, 1996).
The HBN data set analyzed for this report includes 160 water-quality samples that were collected from November 1967 through September 1995. Sampling frequency was monthly from 1968 through 1970, bimonthly from 1971 through 1982, and quarterly from 1983 through 1995. Although not documented, samples in the early part of the record probably were analyzed at a USGS laboratory in Tuscaloosa, Ala., which was operated until 1973 (Durum, 1978). After the establishment of the Central Laboratory System, samples were analyzed at the Central Laboratory in Atlanta, Ga., from 1973 through 1985 and at the NWQL in Arvada, Colo., from 1986 through 1995. Daily discharge records for Sipsey Fork (station 02450250) are available beginning in October 1966. A precipitation gage was operated for several years in the basin, but the data were not published.
 |
Calculated ion balances for 117 samples with complete major ion analyses are shown in Figures 5a and 5b. Temporal variation of discharge, field pH, major ion concentrations, and ion balance at Sipsey Fork, Alabama. Ion balances ranged from -30 to +11 percent, and more than 95 percent of the samples had calculated values within the ±10 percent range, indicating that the analyses are of high quality. The mean charge balance of all samples was -1.2 percent, indicating that the measured cations nearly balanced with the measured anions in these waters. Time-series plots of the major dissolved constituents were inspected for evidence of method-related effects (fig. 5). For example, sulfate concentrations were slightly elevated during the period 1983 through 1988. This pattern coincides with the use of a turbidimetric titration for sulfate analysis at the NWQL between March 1986 and December 1989 (Fishman and others, 1994). In 1989, the NWQL determined that sulfate concentrations can be overestimated by this technique and changed the method to ion chromatography in 1990 (Office of Water Quality Technical Memorandum No. 90.04, Turbidimetric Sulfate Method, issued December 21, 1989, at URL http:// water.usgs.gov/admin/memo/). The bias was most pronounced in dilute waters, although it was not consistent among samples and appeared to be influenced by factors such as color and turbidity (Schertz and others, 1994). The time-series plot of calculated ion balances shows a distinct shift to more negative values around 1983. Although the exact cause of the shift could not be identified, it was coincident with a network-wide change in the analytical procedure for cations and metals from AA spectroscopy to ICP spectroscopy in 1983 (Office of Water Quality Technical Memorandum No. 82.18, National Water- Quality Networks, issued September 28, 1982, at URL http://water.usgs.gov/admin/memo/).
Median concentrations and ranges of major constituents in stream water collected at the HBN gaging station and VWM concentrations in wet-only precipitation measured at the NADP site at Sand Mountain Experimental Station about 120 km east of the basin are presented in table 6. Wet-precipitation chemistry at the NADP station is dilute and acidic with a VWM pH of 4.6 during the 11 years of record. The dominant cations in precipitation were hydrogen and ammonium, which accounted for 51 percent and 25 percent of the total cation charge, respectively. Sulfate was the dominant anion, contributing 64 percent of the total anions, whereas nitrate and chloride contributed 23 and 12 percent, respectively. The low pH and predominance of strong acid anions indicate that precipitation at the nearby NADP station probably is affected by anthropogenic emissions of sulfur and nitrogen compounds, which cause acid rain.
[Concentrations in units of microequivalents per liter, discharge in cubic meters per second, specific conductance in microsiemens per centimeter at 25 degrees Celsius, pH in standard units, and silica in micromoles per liter; n, number of stream samples; VWM, volume-weighted mean; inst., instantaneous; spec. cond., specific conductance; <, less than; --, not reported]
| Parameter | Stream Water | Precipitation VWMa | |||||
| Minimum | First quartile | Median | Third quartile | Maximum | n | ||
| Discharge, inst. | 0.05 | 0.37 | 1.6 | 4.1 | 310 | 160 | -- |
| Spec. cond., field | 9.3 | 66 | 80 | 92 | 136 | 145 | -- |
| pH, field | 5.7 | 7.0 | 7.2 | 7.4 | 7.9 | 144 | 4.6b |
| Calcium | 180 | 500 | 600 | 750 | 1,250 | 156 | 3.5 |
| Magnesium | 16 | 80 | 96 | 100 | 220 | 156 | 1.7 |
| Sodium | <17 | 43 | 48 | 57 | 96 | 135 | 5.5 |
| Potassium | 2.6 | 17 | 23 | 31 | 69 | 135 | .7 |
| Ammonium | <14 | <14 | <14 | 29 | 310 | 60 | 12 |
| Alkalinity, laboratory | 100 | 500 | 660 | 780 | 1,300 | 144 | -- |
| Sulfate | 17 | 71 | 83 | 95 | 160 | 156 | 33 |
| Chloride | 5.6 | 31 | 39 | 45 | 110 | 158 | 6.2 |
| Nitrite plus nitrate | <3.6 | <3.6 | <7.1 | <7.1 | 29 | 99 | 12c |
| Silica | 6.5 | 89 | 95 | 110 | 170 | 155 | -- |
aData are volume-weighted mean concentrations for 1984—94.
bLaboratory pH.
cNitrate only.
Stream water in the Sipsey Fork is moderately concentrated and well buffered; specific conductances ranged from 9 to 136 mS/cm and alkalinities generally were between 500 and 780 meq/L. The dominant ions in stream water were calcium and alkalinity, which are produced by weathering of carbonates in the underlying limestone. The median chloride concentration in stream water was 39 meq/L, which is about six times larger than the VWM concentrations of
 |
The solute composition of stream water was further evaluated by analyzing correlations between solutes and stream discharge (table 7). Most solutes were weakly correlated with discharge with the exception of potassium (rho = -0.753). Among the solutes, only calcium and alkalinity were strongly correlated (rho = 0.910). The strong correlation between potassium and discharge is somewhat difficult to explain. Potassium is a common constituent of marine clays and may be released from the weathering of clay-rich units in the Pottsville Formation. The strong correlation between calcium and alkalinity clearly reflects the weathering of limestone, but the lack of correlation with discharge was somewhat unexpected. A more detailed examination of the data revealed that calcium and alkalinity were in fact correlated with flow, but the pattern was more complex. Instead of the more common monotonic relation, calcium and alkalinity concentrations were highest around 0.6 m³/s and decreased with both decreasing flows below this level and increasing flows above this level. Differences in soil characteristics in the basin may provide at least one explanation for this observed pattern in stream chemistry. The highly permeable soils in the southern and northwestern parts of the basin are the dominant source of stream- flow during dry periods in late summer. Because these soils are formed in sandstones and shales, they produce dilute waters, which may explain the decrease in calcium and alkalinity concentrations when flows are less than 0.6 m³/s. During wetter periods of the year, soils in the northeast section of the basin begin to contribute a greater proportion of streamflow. Because these soils are formed in limestone, they produce higher alkalinity waters than the sandstones, which causes a positive relation between discharge and calcium and alkalinity concentrations for flows below 0.6 m³/s. At flows above 0.6 m³/s, the concentrations of both constituents were inversely related to discharge, probably because of dilution.
[ discharrge; Ca, calcium; Mg, magnesium; Na, sodium; K, potassium; Alk, alkalinity; SO4, sulfate; Cl, chloride; Si, silica]
| Q | pH | Ca | Mg | Na | K | Alk | SO4 | Cl | |
| pH | 0.094 | ||||||||
| Ca | .203 | 0.294 | |||||||
| Mg | -.486 | .169 | 0.490 | ||||||
| Na | -.356 | .071 | .323 | 0.643 | |||||
| K | -.753 | -.191 | -.126 | .604 | 0.367 | ||||
| Alk | .050 | .288 | .910 | .609 | .347 | 0.011 | |||
| SO4 | .050 | .035 | .060 | .220 | .171 | .096 | 0.050 | ||
| Cl | -.044 | .033 | .267 | .263 | .394 | .051 | .222 | 0.208 | |
| Si | .007 | .109 | .156 | .287 | .356 | .128 | .175 | .000 | 0.118 |
Results of the seasonal Kendall test for trends in discharge and major dissolved constituents from 1967 through 1995 are shown in table 8. Statistically significant trends were detected in sodium, sulfate, and silica concentrations at the 0.01 confidence level. Trends in the flow-adjusted sodium and silica concentrations were similar to the unadjusted concentrations, indicating that the trends were not caused by variations in stream discharge. The trend in flow-adjusted sulfate concentrations was not calculated because the flow model was not significant at the 0.1 confidence level. The LOWESS curve in figure 5 shows a pattern of increasing sulfate concentrations until the mid-1980's, followed by a slight decrease in concentration in the 1990's. One possible explanation for the trend in stream-water sulfate is a change in atmospheric deposition. Estimates of sulfate deposition in the Southeast indicate that deposition increased significantly between 1960 and 1980 (Husar and others, 1991). Lynch and others (1995) have found that sulfate concentrations at NADP stations in the Southeast have been declining since 1980. Although the pattern in stream-water sulfate appears to mimic the temporal trend in atmospheric deposition, sulfate concentrations during the late 1980's may have been biased by the analytical procedure, thus complicating the interpretation of sulfate trends at this station. The LOWESS curves for sodium and silica indicate that most of the change in concentrations occurred during the early part of the record and concentrations have been fairly stable since the 1980's. Declines in stream- water sodium and silica probably cannot be attributed to increases in acidic deposition. A more plausible cause of the trends in sodium and silica may be a change in land use. Although most of the basin is now designated as wilderness, these areas of the basin may have been subjected to logging prior to establishment of the wilderness in 1975.
[Trends in units of microequivalents per liter per year, except discharge in cubic meters per second per year, pH in standard units per year, and silica in micromoles per liter per year; <, less than; --, not calculated]
| Parameter | Unadjusted | Flow adjusted | ||
| Trend | p-value | Trend | p-value | |
| Discharge | <0.01 | 0.693 | -- | -- |
| pH, field | -.01 | .172 | -0.01 | 0.216 |
| Calcium | -3.3 | .026 | -3.6 | .025 |
| Magnesium | <.1 | .603 | <.1 | .853 |
| Sodium | -.2 | .006 | -.2 | .014 |
| Potassium | <.1 | .465 | <.1 | .516 |
| Alkalinity, laboratory | 1.0 | .524 | 1.6 | .354 |
| Sulfate | .6 | .002 |
|
|
| Chloride | <.1 | .449 |
|
|
| Nitrite plus nitrateb | (b) |
|
-- | -- |
| Silica | -.4 | .005 | -.3 | .005 |
a Flow model not significant at a = 0.10.
b Insufficient data to calculate trend.
 |
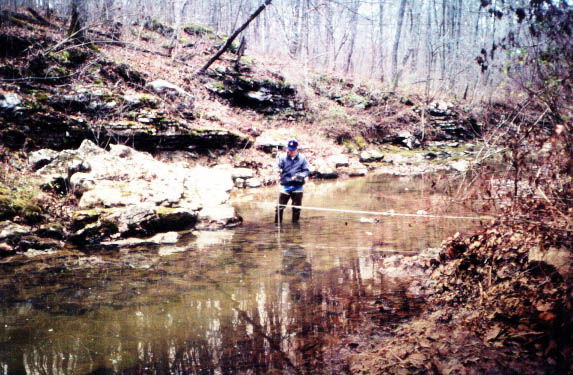
Results of the surface-water synoptic sampling conducted December 6 and 7, 1990, are shown in table 9; location of sampling sites in the basin are shown in figure 4. During the synoptic sampling, discharge at the gage was 0.8 m³/s compared to the median daily discharge of 2.5 m³/s for December (Lawrence, 1987), indicating that the basin was sampled during low-flow conditions for that time of year. Concentrations measured at the gage (site 1) during the synoptic sampling were generally within the median to third-quartile range measured at the gage during the entire period of record (table 6). The tributary streams spanned a wide range of concentrations that bracketed the concentrations at the gage. For example, the alkalinity at the gage was 760 meq/L, whereas the alkalinities of the tributaries ranged from 46 meq/L at site 4 to 2,440 meq/L at site 8. A similar pattern is apparent for calcium, which ranged from 65 meq/L at site 4 to 2,600 meq/L at site 8. Ion balances for the synoptic samples ranged from -1.1 to 3.8 percent, indicating that organic anions did not contribute significantly to the ionic content of stream water during the sampling period.
[Site locations shown in fig. 4; Q, discharge in cubic meters per second; SC, specific conductance in microsiemens per centimeter at 25 degrees Celsius; pH in standard units; Ca, calcium; Mg, magnesium; Na, sodium; K, potassium; Alk, alkalinity; SO4, sulfate; Cl, chloride; NO3, nitrate; concentrations in microequivalents; Si, silica in micromoles per liter; <, less than; --, not measured]
| Site |
|
Q | SC | pH | Ca | Mg | Na | K | Alk | SO4 | Cl | NO3 | Si | Criteriaa |
|
| 1 | 02450250 | 0.79 | 98 | 7.61 | 750 | 110 | 48 | 25 | 760 | 140 | 51 | 8.6 | 98 |
|
|
| 2 | 341750087242300 | .008 | 35 | 6.43 | 110 | 80 | 52 | 26 | 48 | 180 | 39 | <.7 | 120 | LU, BG | Wilderness, sandstone |
| 3 | 341750087242500 | .45 | 43 | 7.06 | 240 | 88 | 48 | 26 | 220 | 100 | 48 | 9.3 | 100 | MT, BG | Mostly sandstone |
| 4 | 341754087234200 | .011 | 25 | 6.26 | 65 | 74 | 39 | 24 | 46 | 120 | 39 | <.7 | 110 | BG | Sandstone only |
| 5 | 341826087301200 | .18 | 29 | 6.67 | 80 | 69 | 48 | 26 | 61 | 92 | 54 | 19 | 93 | BG, LU | Sandstone, some development |
| 6 | 341947087223700 | .15 | 210 | 7.95 | 2,100 | 160 | 52 | 21 | 1,970 | 200 | 70 | 7.1 | 100 | MT, BG | Limestone bedrock |
| 7 | 341834087234000 | .25 | 230 | 8.08 | 2,300 | 170 | 57 | 21 | 2,080 | 230 | 100 | 14 | 97 | BG, LU | Limestone, some development |
| 8 | 342019087231700 | .045 | 260 | 8.06 | 2,600 | 200 | 52 | 19 | 2,440 | 230 | 100 | 7.1 | 98 | BG | Limestone |
| 9 | 342027087281600 | .057 | 100 | 7.60 | 800 | 120 | 57 | 25 | 830 | 120 | 45 | <.7 | 98 | BG | Mixed lithology |
| 10 | 342224087225300 | .014 | 240 | 7.72 | 2,400 | 220 | 61 | 20 | 2,240 | 230 | 110 | 14 | 110 | BG, LU | Limestone, some development |
aCriteria used in selection of sampling sites: BG = bedrock geology, MT = major tributary, LU = land use.
The wide range of solute concentrations measured during the synoptic sampling can be explained by the distribution of different bedrock types in the basin. For example, the tributaries with the highest alkalinity concentrations (sites 6-10) drain areas of the basin underlain by limestone, whereas sites with low alkalinities (sites 2-5) drain areas underlain primarily by sandstone and shale. Calcium and magnesium had the same relationship with rock type, with waters that drain limestone having significantly larger concentrations of calcium and magnesium than those that drain areas of sandstone and shale. A similar relationship between stream chemistry and geology was observed by Ward (1992) in a longitudinal survey of the water chemistry in the Sipsey Fork Basin conducted in June 1991. Controls on spatial variability in the other solutes are more difficult to discern. Sodium and silica concentrations were very uniform among the sites and did not appear to reflect the distribution of bedrock types. Both sulfate and chloride were slightly elevated in streams that drain limestone (sites 6-10) compared to those that drain sandstone (sites 2-5). Because it is unlikely that atmospheric deposition rates would differ significantly between the tributary basins, these results suggest that small amounts of chloride and sulfate may be released by the limestone bedrock. Nitrate concentrations in all tributaries were very low, although tributaries that drain non wilderness areas of the basin (sites 5, 7, and 10) had slightly larger nitrate concentrations than streams that drain the wilderness area (sites 2 and 4). The non wilderness tributaries have slightly more human activity (logging, rural residences) in their basins that could contribute small amounts of nitrate to stream water. Ward (1992) reported relatively high nitrate concentrations in Hubbard Creek that were attributed to logging activity upstream from the sampling site. However, Ward (1992) also reported relatively high nitrate concentrations for the Bee Branch tributary despite the fact that this tributary drains an area entirely in the wilderness boundary.
Bailey, R.G., Avers, P.E., King, T., and McNab, W.H., eds., 1994, Ecoregions and subregions of the United States with supplementary table of map unit descriptions: Washington, D.C., U.S. Department of Agriculture Forest Service, scale 1:7,500,000 (also at URL http://www.fs.fed.us/land/ecosysmgmt/ecoreg1_home.html).
Durum, W.H., 1978, Historical profile of quality of water laboratories and activities, 1879-1973: U.S. Geological Survey Open-File Report 78-432, 235 p.
Fishman, M.J., Raese, J.W., Gerlitz, C.N., and Husband, R.A., 1994, U.S. Geological Survey approved inorganic and organic methods for the analysis of water and fluvial sediment, 1954-94: U.S. Geological Survey Open-File Report 94-351, 55 p.
Harkins, J.R., 1981, Hydrology of area 22, eastern coal province, Alabama: U.S. Geological Survey Water-Resources Investigations 81-135, 72 p.
Husar, R.B., Sullivan, T.J., and Charles, D.F., 1991, Historical trends in atmospheric sulfur deposition and methods for assessing long-term trends in surface water chemistry, in Charles, D.F., ed., Acidic deposition and aquatic ecosystems-Regional case studies: New York, Springer-Verlag, p. 48-92.
Lawrence, C.L., 1987, Streamflow characteristics at hydrologic benchmark stations: U.S. Geological Survey Circular 941, 123 p.
Lynch, J.A., Grimm, J.W., and Bowersox, V.C., 1995, Trends in precipitation chemistry in the United States-A national perspective, 1980-1992: Atmospheric Environment, v. 29, no. 11, p. 1231-1246.
Schertz, T.L., Wells, F.C., and Ohe, D.J., 1994, Sources of trends in water-quality data for selected streams in Texas, 1975-89 water years: U.S. Geological Survey Water-Resources Investigation 94-4213, 49 p.
Schweinfurth, S.P., Trent, V.A., and Helton, E.D., 1981, Geologic map of the Sipsey Wilderness and additions, Lawrence and Winston Counties, Alabama: U.S. Geological Survey Miscellaneous Field Studies Map MF-1288-B.
Sisler, J.F., 1996, Spatial and seasonal patterns and long term variability of the composition of the haze in the United States-An analysis of data from the IMPROVE network: Report by Cooperative Institute for Research in the Atmosphere (CIRA), Colorado State University, Ft. Collins, Colo., ISSN: 0737-5352-32.
Smalley, G.W., 1979, Classification and evaluation of forest sites on the Southern Cumberland Plateau: U.S. Department of Agriculture, Forest Service, Southern Forest Experiment Station, general technical report SO-23.
U.S. Geological Survey, published annually, Water resources data, Alabama, Montgomery: U.S. Geological Survey Water Data Report.
U.S. Department of Agriculture, 1988, Sipsey Fork, West Fork, final environmental impact statement/wild and scenic river study report: Forest Service, Southern Region, Alabama.
Ward, G.M., 1992, A longitudinal survey of the water chemistry of Sipsey Fork, Bankhead National
Forest, Alabama: Report for the Forest Service, Contract 4-4146-0369.
Sipsey Fork near Grayson, Alabama (Station 02450250)
a. U.S. Geological Survey topographic maps:
b. Geologic Maps:
c. Soil Surveys
d. Other maps:
Table B-1. NWIS site identification numbers and site names for water-quality sampling sites.
| Site | Identification Number | Site Name |
| 1 | 02450250 | SIPSEY FORK NEAR GRAYSON, ALABAMA |
| 2 | 341750087242300 | FALL CR AT MOUTH |
| 3 | 341750087242500 | UPPER SIPSEY FORK |
| 4 | 341754087234200 | FIRST EASY TRIB |
| 5 | 341826087301200 | HUBBARD CR |
| 6 | 341947087223700 | BORDEN CR |
| 7 | 341834087234000 | BORDEN CR SECTION 32 |
| 8 | 342019087231700 | FLANNAGIN CR |
| 9 | 342027087281600 | THOMPSON CR |
| 10 | 342224087225300 | UPPER FLANNAGIN CR |
| Back to 1173-A Contents |
This page maintained by Nichole Bisceglia.
Last updated July 17, 2000.