
Hydrologic Benchmark Network Stations in the Eastern U.S. 1963-95 (USGS Circular 1173-A)
| Abstract and Map Index | List of all HBN Stations | Introduction to Circular | Analytical Methods |
Falling Creek near Juliette, Georgia (Station 02212600)
To download a printer friendly PDF version of this information click here.
This report details one of the approximately 50 stations in the Hydrologic Benchmark Network (HBN) described in the four-volume U.S. Geological Survey Circular 1173. The suggested citation for the information on this page is:
|
All of the tables and figures are numbered as they appear in each circular. Use the navigation bar above to view the abstract, introduction and methods for the entire circular, as well as a map and list of all of the HBN sites. Use the table of contents below to view the information on this particular station.
|
|
| 1. Site Characteristics and Land Use |
| 2. Historical Water Quality Data and Time-Series Trends |
| 3. Synoptic Water Quality Data |
| 4. References and Appendices |
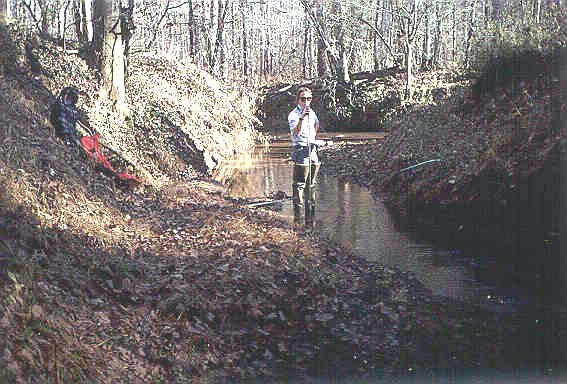
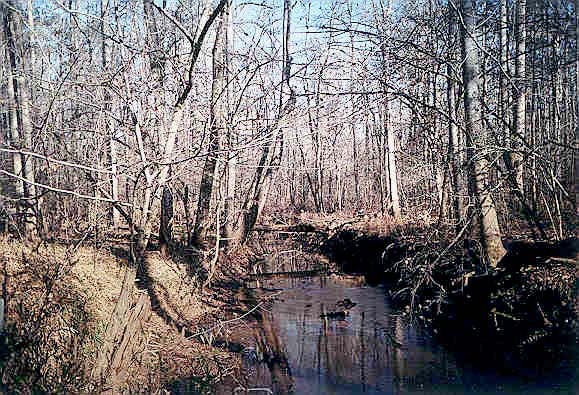
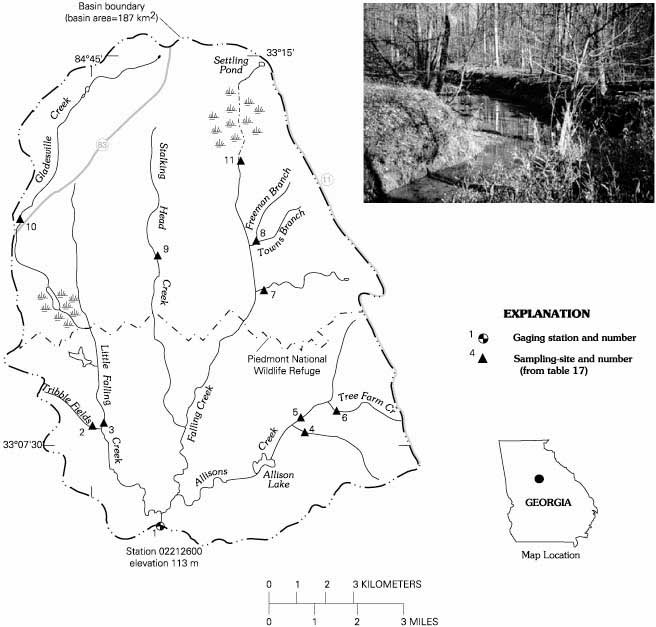
The Falling Creek HBN Basin is in the southern part of the Piedmont physiographic province in central Georgia (Figure 8.Map of the study area in the Falling Creek Basin and photograph of a typical tributary stream). The basin drains 187 km² of rolling terrain that ranges in elevation from 113 to 244 m. The USGS gaging station is 8 km east of the town of Juliette, Ga., at latitude 33°05'59'' and longitude 83°43'25''. Falling Creek is a south-flowing tributary of the Ocmulgee River with a channel length of about 18 km upstream from the gage and an average stream gradient of 3.8 m/km. The main channel is perennial, and average daily discharge ranges from 0.31 m³/s in September to 4.2 m³/s in February. Average annual runoff was 30 cm from 1965 through 1995 (U.S. Geological Survey, Water Resources Data, Georgia), of which almost 60 percent occurs during the 20 to 30 storm events each year (Rose, 1996). Climate of the area is temperate with warm, humid summers and mild winters (Payne, 1976). Precipitation averages 122 cm annually and is fairly evenly distributed throughout the year except for the fall months that are slightly drier (Plummer, 1983). Average daily air temperatures range from 7.3°C in January to 26.6°C in July. Freezing occurs on slightly more than one-half the days between December and February, although snowfall is rare (Payne, 1976).
 |
The basin lies in the Southern Mixed Forest ecoregion (Bailey and others, 1994) and is covered by second-growth pine and mixed pine-hardwood forest types. Pine forests, which naturally reforested previously farmed or logged areas, are composed of loblolly pine with an understory of dogwood and redbud. Hardwood forest types are concentrated along the creek bottoms and in small, sheltered, upland valleys. The lowland hardwood species are predominantly sweetgum, water oak, and willow oak, and the upland hardwood stands are dominated by white oak, post oak, red oak, and hickory. Most soils in the basin are classified as Ultisols and are mapped in the Davidson series (Payne, 1976), which includes well- drained soils that have formed in residual material weathered from mafic crystalline rocks. A typical soil profile has a dark reddish-brown surface layer of loam (18 to 30 cm) that is underlain by dark-red clay subsoil that extends to a depth of almost 2 m. Soils are moderately to strongly acidic (pH 5.1 to 6.0) and have a low organic-matter content (Payne, 1976). Soil mineralogy is dominated by detrital plagioclase, potassium feldspar, pyroxene, biotite, hornblende, and quartz and pedogenic kaolinite with minor amounts of vermiculite (Rose, 1994). Soils are underlain by a layer of saprolite as much as 30 m thick that is the primary source of base flow to the stream (Rose, 1996).
Bedrock in the basin consists of interlayered felsic and mafic gneiss of Precambrian age. The felsic gneiss accounts for about one-third of the bedrock and consists of oligoclase, microcline, and quartz with accessory biotite, muscovite, garnet, sphene, magnetite, zircon, apatite, and epidote (Matthews, 1967). The primary minerals of the mafic gneiss include hornblende, andesine, and quartz with accessory epidote, magnetite, and apatite. The mafic gneiss weathers to an orange-red saprolite with a boxwork structure. Ultramafic rocks also are present in the basin including a large body of gabbro (12 km by 1.5 km) mapped along the northern basin divide roughly parallel to State Highway 83 (Vincent and others, 1990). The gabbro consists primarily of plagioclase, clinopyroxene, orthopyroxene, and olivine.
The Falling Creek Basin drains parts of Jasper and Jones Counties in central Georgia. Sixty percent of the basin is in the boundaries of the Oconee National Forest and 40 percent is in the boundaries of the Piedmont National Wildlife Refuge (PNWR). The PNWR is part of the National Wildlife Refuge System administered by the U.S. Fish and Wildlife Service, and the refuge headquarters is located just inside the southern basin boundary. About one-half the land in the National Forest boundary is owned by private individuals or logging companies. Most areas of the basin are accessible by the 50 km of Forest Service and county roads that traverse the area. The PNWR is open year-round for general public use, although some roads in the refuge may be closed during hunting season or in bad weather.
Public land in the basin was purchased by the Federal Government in the mid-1930's after almost 100 years of cotton farming had left severely eroded lands and nutrient-depleted soils. The PNWR was established in 1939 to develop techniques for reclaiming depleted areas and to restore suitable habitat for native animals (Riley and Riley, 1979). Current (1997) land cover in the basin is more than 95 percent forest and the dominant land use is for timber harvest, wildlife habitat, and recreation. Management policies of the PNWR are designed primarily to provide habitat for the endangered red-cockaded woodpecker. Pine forests in the refuge are managed on an 80-year rotation in stands of 4 to 12 ha, and hardwood stands are left to develop naturally (Ronnie Shell, Piedmont National Wildlife Refuge, oral commun., 1994). The refuge also manipulates water levels in natural wetlands, beaver ponds, and manmade ponds to improve food sources for birds. Pine forests in the Oconee National Forest are harvested on a 60-year rotation in a checkerboard pattern by clearcutting 12-ha parcels or thinning slightly larger areas (John Moore, Forest Service, oral commun., 1994). Some logged areas are left to revegetate naturally, whereas others are reseeded. Logging on private land has increased significantly during the past decade with clearcutting being the primary method of removal (John Moore, oral commun., 1994). Logging on private land has increased significantly during the past decade with clearcutting being the primary method of removal (John Moore, oral commun., 1994).
 |
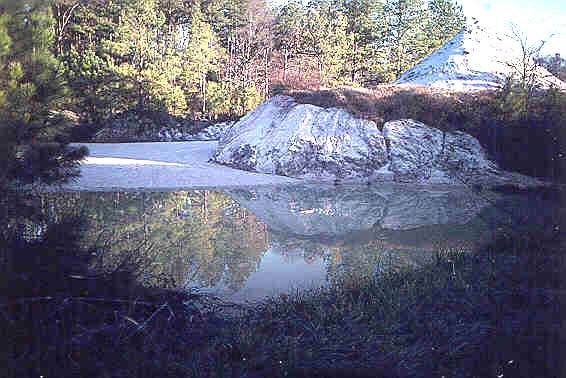
Other manmade features in the basin include several gravel pits and feldspar mines that were operated until the early 1980's and have since been revegetated or turned into ponds. A feldspar-processing plant, located just outside the northeast basin boundary, has discharged industrial wastewater into a settling pond at the head of Falling Creek for more than 30 years. The ore processing involves the use of hydrofluoric and sulfuric acids that generate acidic wastewater (Georgia Department of Natural Resources, 1985). The wastewater is treated with a caustic rinse to raise the pH then pumped into the settling pond. Discharge from the settling pond has been identified as a point source of both suspended sediment and chemical contamination to Falling Creek (Georgia Department of Natural Resources, 1985). A sample collected from the outlet of the settling pond in 1985 had a pH of 7.1 and fluoride and sulfate concentrations of 13.8 mg/L (730 meq/L) and 50 mg/L (1,040 meq/L), respectively (Georgia Department of Natural Resources, 1985). The impact of the industrial wastewater on the chemistry of Falling Creek is the reason this station was removed from the HBN in 1994.
The chemical data set analyzed for this report includes 187 water-quality samples that were collected from October 1967 through June 1994 when the site was removed from the HBN. Water-quality samples were collected as frequently as monthly from 1968 through 1982 and quarterly from 1983 through 1994. Although not documented, water-quality samples in the early part of the record probably were analyzed at one of the three USGS laboratories (Raleigh, N.C.; Ocala, Fla.; Tuscaloosa, Ala.) that provided analytical services in the Southeastern Region (Durum, 1978). After establishment of the Central Laboratory System, samples were analyzed at the Central Laboratory in Atlanta, Ga., from 1973 through 1985 and at the NWQL in Arvada, Colo., from 1986 through 1994. Daily discharge records for Falling Creek (station 02212600) are available beginning in July 1964. Continuous records of water temperature at the gage were published from August 1965 through September 1979.
Calculated ion balances for 175 samples with complete major ion analyses are shown in figure 9. Ion balances ranged from -27 to +12 percent, and more than 85 percent of the samples had calculated values within the ±5 percent range, indicating that the analyses were of high quality. The mean charge balance of all samples was 0.2 percent, indicating that unmeasured constituents, such as organic anions, do not contribute significantly to the ion balance of stream water at this site.
Time-series plots of the major dissolved constituents were inspected for evidence of method-related effects (Figures 9a and 9b. Temporal variation of discharge, field pH, major ion concentrations, and ion balance at Falling Creek, Georgia). For example, several higher than average sulfate concentrations were reported during the late 1980's. This pattern coincides with the use of a turbidimetric titration for sulfate analyses at the NWQL between March 1986 and December 1989 (Fishman and others, 1994). In 1989, the NWQL determined that sulfate concentrations can be over-estimated by this technique and changed the method to ion chromatography in 1990 (Office of Water Quality Technical Memorandum No. 90.04, Turbidimetric Sulfate Method, issued December 21, 1989, at URL http://water.usgs.gov/admin/memo/). Sulfate and chloride both show a pattern of slightly smaller concentrations during the early 1970's. The fact that both silica and fluoride are missing for these same analyses may be an indication of a change in analytical laboratory during this period of record. The time-series plot of field pH shows an abrupt downward shift in pH around 1974 and many uncharacteristically low pH values during the next 6 years (fig. 9). Although not documented, these low values may have been caused by a change in the pH electrode used by field personnel. Some instrument-electrode systems are known to give erroneous readings when measuring pH in low-conductivity waters, and the electrode commonly is the critical component (Office of Water Quality Technical Memorandum No. 81.08, Electrodes for pH Measurement in Low-Conductivity Waters, issued February 10, 1981, at URL http://water.usgs.gov/admin/memo/).
Table 14 gives median concentrations and ranges of major constituents in stream water collected at the gage and VWM concentrations in wet-only deposition measured at the Georgia Station NADP station about 65 km west of the basin. Wet- precipitation chemistry at the NADP station is dilute and slightly acidic with a VWM pH of 4.6. During 17 years of record, the dominant cations in precipitation were hydrogen, which contributed 50 percent of the total cation charge, and ammonium and sodium, which contributed 19 and 15 percent, respectively. Sulfate was the dominant anion, accounting for 62 percent of the total anions, whereas nitrate and chloride accounted for 23 and 15 percent, respectively. These data indicate that solutes in precipitation in the basin are primarily a mixture of strong acids derived from anthropogenic emissions of sulfur and nitrogen compounds, which cause acid rain.
[Concentrations in units of microequivalents per liter, discharge in cubic meters per second, specific conductance in microsiemens per centimeter at 25 degrees Celsius, and silica in micromoles per liter; n, number of stream samples; VWM, volume-weighted mean; inst., instantaneous; spec. cond., specific conductance; <, less than; --, not measured]
| Parameter | Stream Water | Precipitation VMAa | |||||
| Minimum | First quartile | Median | Third quartile | Maximum | n | ||
| Discharge, inst. | 0.01 | 0.21 | 0.54 | 1.2 | 30 | 183 | -- |
| Spec. cond., field | 44 | 100 | 120 | 140 | 180 | 186 | -- |
| pH, field | 5.6 | 7.1 | 7.4 | 7.6 | 8.9 | 165 | 4.6b |
| Calcium | 180 | 410 | 500 | 600 | 700 | 187 | 4.0 |
| Magnesium | 110 | 340 | 420 | 470 | 630 | 187 | 2.2 |
| Sodium | 100 | 270 | 330 | 400 | 740 | 187 | 7.3 |
| Potassium | 18 | 27 | 33 | 43 | 72 | 185 | 1.2 |
| Ammonium | <.7 | <.7 | 1.4 | 2.9 | 17 | 69 | 9.4 |
| Alkalinity, laboratory | 300 | 780 | 1,040 | 1,260 | 1,600 | 157 | -- |
| Sulfate | <21 | 45 | 81 | 130 | 440 | 188 | 32 |
| Chloride | 42 | 79 | 90 | 110 | 170 | 187 | 7.6 |
| Nitrite plus nitrate | <.7 | 2.1 | 5.0 | 7.1 | 44 | 151 | 12c |
| Fluoride | <5.3 | 21 | 32 | 47 | 100 | 170 | -- |
| Silica | 150 | 280 | 320 | 350 | 430 | 170 | -- |
a Data are volume-weighted mean concentrations for 1978—94.
b Laboratory pH.
c Nitrate only.
Stream water in Falling Creek is moderately concentrated and well buffered; specific conductances ranged from 44 to 180 µS/cm and alkalinities generally were between 780 and 1,260 meq/L. The major cations in stream water were calcium, magnesium, and sodium, and the major anion was bicarbonate. The relatively high concentrations of dissolved calcium, magnesium, sodium, and alkalinity in stream water result from the weathering of mafic minerals in the underlying bedrock and saprolite. Rose (1994) noted that solute flux related to rock weathering from Falling Creek is much greater than other more felsic locations in the region because of the predominance of amphiboles in the mafic gneiss. The median chloride concentration in stream water was 90 meq/L, which is about 12 times larger than the VWM concentrations of 7.6 meq/L in precipitation. On the basis of the difference between average annual runoff and precipitation, evapotranspiration can account for no more than a fourfold increase in the chloride concentration of precipitation, indicating that some stream-water chloride must be derived from sources other than wet deposition. The most obvious basin source of chloride is industrial wastewater discharged from the settling pond. The median concentration of sulfate in stream water was 81 meq/L compared to 32 meq/L in precipitation. The stream-water concentration is somewhat smaller than would be expected considering the combined effects of evapotranspiration, dry deposition of sulfate, and discharge from the settling pond, indicating that a substantial amount of atmospherically deposited sulfate is retained in the basin. The primary mechanism probably is sulfate adsorption on soils that is generally attributed to the abundance of pedogenic iron and aluminum oxides in the highly weathered soils of the Southeast (Shanley, 1992). The median concentration of fluoride in stream water was 32 meq/L, which is significantly larger than the concentrations reported at most other HBN stations. Given the low fluoride content of both precipitation (Hem, 1989) and common metamorphic minerals (Deer and others, 1966), these concentrations of fluoride in stream water are almost certainly related to wastewater discharge from the tailings pond.
 |
The solute composition of stream water was further evaluated by analyzing correlations between solutes and stream discharge (table 15). Most dissolved constituents had strong inverse correlations with discharge, particularly calcium (rho = -0.845), magnesium (rho = -0.828), sodium (rho = -0.726), and alkalinity (rho = -0.861). Strong correlations between weathering products and flow are consistent with a hydrologic system where weathering-enriched base flow is diluted by waters from shallow or surficial sources during periods of increased discharge. Although fluoride is not a weathering product, it also had a strong inverse correlation with discharge (rho = -0.668). This relation may indicate that discharge from the settling pond has contaminated the local ground-water system as well as the stream. Among the ions, the highest degree of correlation was found between calcium, magnesium, and alkalinity (0.911 < r < 0.953). These strong positive correlations most likely reflect the weathering of amphibole minerals in the mafic gneiss. Significant correlations also were found between chloride and the monovalent cations, sodium (rho = 0.684) and potassium (rho = 0.633), and sulfate and the divalent cations, calcium (rho = -0.594) and magnesium (rho = -0.574). The positive correlations between chloride and the monovalents probably are the result of industrial wastewater input because these constituents do not occur together in common metamorphic minerals. In contrast, the inverse correlations between sulfate and the divalent cations probably are related to hydrologic processes. The implication is that sulfate is primarily transported to the stream during high- discharge periods when streamflow is dominated by discharge from the unsaturated zone that apparently is enriched in sulfate and depleted in base cations relative to ground water (Shanley, 1992).
[Q, discharge; Ca, calcium; Mg, magnesium; Na, sodium; K, potassium; Alk, alkalinity; SO4, sulfate; Cl, chloride; F, fluoride; Si, silica]
| Q | pH | Ca | Mg | Na | K | Alk | SO4 | Cl | F | |
| pH | -0.618 | |||||||||
| Ca | -.845 | 0.652 | ||||||||
| Mg | -.828 | .623 | 0.919 | |||||||
| Na | -.726 | .543 | .596 | 0.582 | ||||||
| K | -.631 | .504 | .542 | .520 | 0.779 | |||||
| Alk | -.861 | .648 | .952 | .912 | .634 | 0.559 | ||||
| SO4 | .345 | -.290 | -.594 | -.574 | .005 | .105 | -0.569 | |||
| Cl | -.277 | .232 | .104 | .117 | .684 | .633 | .165 | 0.438 | ||
| F | -.668 | .643 | .663 | .691 | .764 | .795 | .661 | -.115 | 0.528 | |
| Si | -.687 | .456 | .666 | .665 | .435 | .265 | .592 | -.499 | .022 | 0.426 |
Results of the seasonal Kendall test for trends in discharge and major dissolved constituents are shown in table 16. Because many of the chemical analyses in the early part of the record are incomplete, trends were calculated only for the period 1974 through 1994. Statistically significant upward trends were observed in the unadjusted concentrations of pH, sodium, potassium, chloride, alkalinity, and fluoride at the 0.01 confidence level. Discharge had a significant downward trend of -0.2 m³/s per year at the 0.01 confidence level. The upward trends in potassium and alkalinity were not statistically significant for the flow-adjusted concentrations, indicating that unadjusted trends in these constituents probably were driven by the downward trend in stream discharge. In contrast, the upward trends in pH, sodium, chloride, and fluoride were significant for both the unadjusted and flow-adjusted concentrations, and the trend in sulfate became significant only after the discharge variation had been removed. Increases in stream-water fluoride, sulfate, chloride, and sodium concentrations occurred primarily between 1974 and 1984 (fig. 9) and are almost certainly related to the settling pond based on the chemical composition of discharge from the pond reported by the Georgia Department of Natural Resources (1985). The upward trends in concentration may indicate that chemical loadings from the plant have increased during that time, or alternatively, that there has been a progressive contamination of the ground-water system. The cause of the upward trend in field pH is less clear. Although the trend appears to be consistent with the other chemical changes in stream water, many of the low pH measurements between 1974 and 1980 also can be explained by analytical bias.
[Trends in units of microequivalents per liter per year, except discharge in cubic meters per second per year, pH in standard units per year, and silica in micromoles per liter per year; <, less than; --, not calculated]
| Parameter | Unadjusted | Flow adjusted | ||
| Trend | p-value | Trend | p-value | |
| Discharge | -0.02 | 0.003 | -- | -- |
| pH, field | .03 | .000 | 0.04 | 0.000 |
| Calcium | 2.5 | .046 | 1.0 | .454 |
| Magnesium | 1.5 | .177 | -.6 | .269 |
| Sodium | 8.7 | .000 | 4.1 | .000 |
| Potassium | .5 | .004 | .3 | .122 |
| Alkalinity, laboratory | 17.5 | .001 | -2.5 | .407 |
| Sulfate | 1.2 | .103 | 2.1 | .007 |
| Chloride | 1.8 | .000 | 1.3 | .000 |
| Nitrite plus nitrate | (a) | -- | -- | -- |
| Fluoride | 1.4 | .000 | 1.1 | .000 |
| Silica | 1.0 | .080 | <.1 | .999 |
aInsufficient data to calculate trend.
Results of the surface-water synoptic sampling of December 8 through 10, 1990, are presented in table 17; locations of sampling sites are shown in figure 8. Discharge at the gage was 0.28 m³/s compared to the median monthly discharge of 0.91 m³/s for December (Lawrence, 1987), indicating that the basin was sampled during low-flow conditions for that time of year. Because of the hydrologic conditions, solute concentrations measured at the gage (site 1) during the synoptic sampling were generally outside the first-quartile to third-quartile range measured at the gage during the entire period of record (table 14). Tributary streams sampled during the synoptic sampling had smaller concentrations than those measured at the gage (site 1) with the exception of the headwaters of Falling Creek (site 11). All samples had ion balances close to zero (range -1.6 to 2.8 percent), indicating that organic anions did not contribute significantly to the ionic content of stream water during the sampling period.
[Site locations shown in fig. 8; Q, discharge in cubic meters per second; SC, specific conductance in microsiemens per centimeter at 25 degrees Celsius; pH in standard units; Ca, calcium; Mg, magnesium; Na, sodium; K, potassium; Alk, alkalinity; SO4, sulfate; Cl, chloride; NO3, nitrate; F, fluoride; concentrations in microequivalents; Si, silica in micromoles per liter; <, less than; --, not measured]
| Site | Station number | Q | SC | pH | Ca | Mg | Na | K | Alk | SO4 | Cl | NO3 | F | Si | Criteriaa | Remarks |
| 1 | 02212600 | 0.28 | 7.56 | 140 | 500 | 400 | 480 | 59 | 840 | 310 | 140 | <7.0 | 63 | 350 | -- | -- |
| 2 | 330754083444500 | .008 | 6.93 | 100 | 420 | 320 | 260 | 26 | 630 | 250 | 130 | <7.0 | <5.0 | 450 | BG | Mafic gneiss |
| 3 | 330755083444200 | .020 | 6.81 | 150 | 550 | 470 | 320 | 22 | 340 | 900 | 170 | <7.0 | <5.0 | 330 | BG, MT | Gabbro |
| 4 | 330739083394500 | .008 | 7.26 | 110 | 400 | 320 | 330 | 46 | 870 | 54 | 120 | <7.0 | <5.0 | 430 | BG | Felsic gneiss |
| 5 | 330757083401400 | -- | 7.13 | 77 | 290 | 220 | 230 | 28 | 550 | 100 | 99 | -- | <5.0 | 330 | BG | Mixed lithology |
| 6 | 330807083391800 | .008 | 6.99 | 75 | 230 | 180 | 270 | 41 | 360 | 200 | 120 | -- | <5.0 | 380 | BG | Felsic gneiss |
| 7 | 331032083410900 | .022 | 7.52 | 100 | 400 | 330 | 280 | 38 | 860 | 56 | 100 | <7.0 | <5.0 | 470 | BG | Felsic gneiss |
| 8 | 331126083411600 | -- | 6.72 | 85 | 280 | 240 | 250 | 33 | 580 | 100 | 120 | -- | <5.0 | 320 | BG | Mafic gneiss |
| 9 | 331112083432700 | .017 | 7.43 | 140 | 550 | 500 | 300 | 36 | 1,140 | 100 | 140 | <7.0 | <5.0 | 420 | BG, MT | Gabbro |
| 10 | 331139083464200 | .014 | 7.04 | 90 | 310 | 220 | 240 | 33 | 390 | 270 | 160 | -- | <5.0 | 250 | BG | Mafic gneiss |
| 11 | 331303083413200 | -- | 7.00 | 290 | 1,150 | 630 | 1,000 | 100 | 940 | 1,270 | 260 | <7.0 | 411 | 330 | LU | Settling pond |
a Criteria used in selection of sampling sites: BG = bedrock geology, MT = major tributary, LU = land use.
The chemistry of tributary streams sampled during the synoptic sampling supports the hypothesis that the settling pond at the headwaters of Falling Creek is a point source of chemical contamination at the gage. This is clearly demonstrated by comparing dissolved fluoride concentrations among the sampling sites. At site 11, just 3 km downstream from the settling pond, the fluoride concentration was 410 meq/L compared to less than reporting- level concentrations at the other nine tributaries (sites 2-10). The fluoride concentration of 63 meq/L at the gage was much smaller than at site 11, but still was elevated compared to background sites in the basin. Other constituents appeared to be affected by the industrial wastewater inputs as well. For example, sodium at site 11 was four times larger and calcium was three times larger than the average concentrations of sodium and calcium at the nine background tributaries (sites 2-10). With the exception of site 3, the average sulfate concentration in the background tributaries was nine times smaller than the sulfate concentration in the headwaters of Falling Creek (site 11). Although not every tributary was sampled during the synoptic sampling, it seems reasonable to conclude that the discharge of industrial wastewater in the headwaters of Falling Creek has a substantial effect on the chemistry of Falling Creek at the gage.
 |
In addition to assessing the effects of the settling pond on stream chemistry, sampling sites also were selected to assess geologic controls on spatial variability in surface-water chemistry (table 17). Variability in the composition of the background tributaries does not appear to be strongly related to the distribution of felsic and maficgneiss as mapped by Ferguson (1978). For example, the alkalinity of streams that drain predominantly felsic gneiss (sites 4, 6, and 7) ranged from 360 to 870 meq/L and was similar to the range of 390 to 630 meq/L in streams that drain predominantly mafic gneiss (sites 2, 8, and 10). The other major weathering products-calcium, magnesium, sodium, and silica also showed no substantial difference in concentration between streams that drain the two types of gneiss. In contrast, the two tributary streams that drain ultramafic rocks (sites 3 and 9) had the highest concentrations of calcium and magnesium, and site 9 had the highest alkalinity among the background sites. Although data are available for only two sites, this pattern may reflect the higher weathering rates of pyroxene and olivine minerals in the gabbro compared to amphibole and feldspar minerals in the gneiss. The sulfate concentration of 900 meq/L at site 3 was somewhat unexpected and reveals another substantial internal source of sulfate in the basin. The high sulfate concentration at this site is balanced by a lower alkalinity rather than larger concentrations of cations, which is consistent with the consumption of stream-water alkalinity by sulfuric acid produced by the oxidation of pyrite. Numerous sulfide deposits have been mapped in the area, including one deposit in the subbasin of Little Falling Creek (Ferguson, 1978).
Bailey, R.G., Avers, P.E., King, T., and McNab, W.H., eds., 1994, Ecoregions and subregions of the United States with supplementary table of map unit descriptions: Washington, D.C., U.S. Department of Agriculture Forest Service, scale 1:7,500,000 (also at URL http://www.fs.fed.us/land/ecosysmgmt/ecoreg1_home.html).
Deer, W.A., Howie, R.A., and Zussman, J., 1966, An introduction to the rock-forming minerals: London, England, Longman Group Limited, 528 p.
Durum, W.H., 1978, Historical profile of quality of water laboratories and activities, 1879-1973: U.S. Geological Survey Open-File Report 78-432, 235 p.
Ferguson, R.B., 1978, Athens 1° × 2° NTMS area, Georgia and South Carolina: National Uranium Resource Evaluation Program, E.I. du Pont de Nemours and Company, Savannah River Laboratory, 168 p.
Fishman, M.J., Raese, J.W., Gerlitz, C.N., and Husband, R.A., 1994, U.S. Geological Survey approved inorganic and organic methods for the analysis of water and fluvial sediment, 1954–94: U.S. Geological Survey Open-File Report 94-351, 55 p.
Georgia Department of Natural Resources, 1985, Water quality investigation of Falling Creek, Jasper and Jones Counties, Georgia, Ocmulgee River Basin: Atlanta, Georgia Department of Natural Resources, Environmental Protection Division, 26 p.
Hem, John D., 1989, Study and interpretation of the chemical characteristics of natural water: U.S. Geological Survey Water-Supply Paper 2254, 263 p.
Lawrence, C.L., 1987, Streamflow characteristics at hydrologic bench-mark stations: U.S. Geological Survey Circular 941, 123 p.
Matthews, Vincent, 1967, Geology and petrology of the pegmatite district in southwestern Jasper County, Georgia: Athens, University of Georgia, Master's thesis, 68 p.
Payne, H.H., 1976, Soil survey of Baldwin, Jones, and Putnam Counties, Georgia: U.S. Department of Agriculture Soil Conservation Service, 73 p.
Plummer, G.L., 1983, Georgia rainfall precipitation patterns at 23 places, 1734-1982: Athens, Georgia Academy of Sciences, 119 p.
Rose, Seth, 1994, Major ion variation and efflux related to discharge in a mafic Piedmont province watershed: Hydrological Processes, v. 8, p. 481-496.
Rose, Seth, 1996, Temporal environmental isotopic variation within the Falling Creek (Georgia) watershed- Implications for contributions to streamflow: Journal of Hydrology, v. 174, p. 243-261.
Riley, Laura, and Riley, William, 1979, Guide to the National Wildlife Refuges: Garden City, N.Y., Anchor Press/Doubleday, p. 136-137.
Shanley, J.B., 1992, Sulfate retention and release in soils at Panola Mountain, Georgia: Soil Science, v. 154, no. 6, p. 499-508.
U.S. Geological Survey, published annually, Water resources data, Georgia, Atlanta: U.S. Geological Survey Water Data Report.
Vincent, H.R., McConnell, K.I., and Perley, P.C., 1990, Geology of selected mafic and ultramafic rocks of Georgia-A review: Georgia Geological Survey Information Circular 82, 59 p.
a. U.S. Geological Survey topographic maps:
b. Geologic maps:
c. Soil surveys:
d. Other maps:
Table B-1. NWIS site identification numbers and site names for water-quality sampling sites.
| Site | Identification Number | Site Name |
| 1 | 02212600 | FALLING CREEK NR JULIETTE GEORGIA |
| 2 | 330754083444500 | TRIBBLE FIELDS CR |
| 3 | 330755083444200 | LITTLE FALLING CR |
| 4 | 330739083394500 | ROUND OAK CR |
| 5 | 330757083401400 | ALLISONS CR |
| 6 | 330807083391800 | TREE FARM CR |
| 7 | 331032083410900 | HILLSBORO CR |
| 8 | 331126083411600 | TOWN/FREEMAN CR |
| 9 | 331112083432700 | STALKING HEAD CR |
| 10 | 331139083464200 | GLADESVILLE CR |
| 11 | 331303083413200 | FALLING CREEK BELOW SWAMP |
| Back to 1173-A Contents |
This page maintained by Nichole Bisceglia.
Last updated July 17, 2000.