
Hydrologic Benchmark Network Stations in the Eastern U.S. 1963-95 (USGS Circular 1173-A)
| Abstract and Map Index | List of all HBN Stations | Introduction to Circular | Analytical Methods |
Wild River at Gilead, Maine (Station 01054200)
To download a printer friendly PDF version of this information click here.
This report details one of the approximately 50 stations in the Hydrologic Benchmark Network (HBN) described in the four-volume U.S. Geological Survey Circular 1173. The suggested citation for the information on this page is:
|
All of the tables and figures are numbered as they appear in each circular. Use the navigation bar above to view the abstract, introduction and methods for the entire circular, as well as a map and list of all of the HBN sites. Use the table of contents below to view the information on this particular station.
|
|
| 1. Site Characteristics and Land Use |
| 2. Historical Water Quality Data and Time-Series Trends |
| 3. Synoptic Water Quality Data |
| 4. References and Appendices |
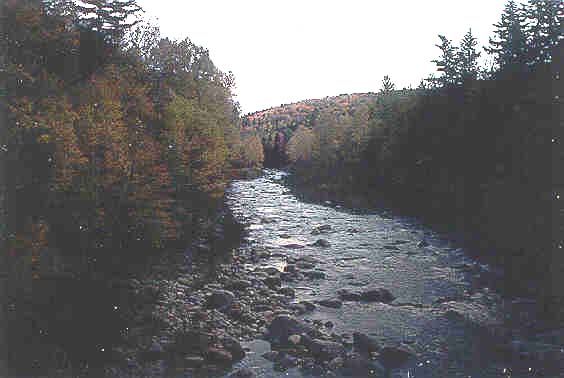
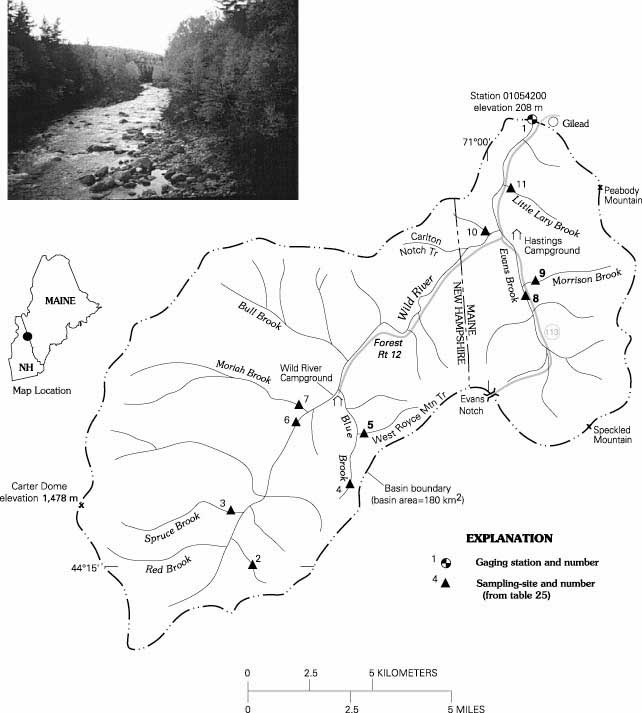
The Wild River HBN Basin is in the New England physiographic province, in the northeast section of the White Mountains along the Maine and New Hampshire boundary (Figure 12. Map of the study area in the Wild River Basin and photograph of the stream channel near the Wild River Campground). The basin drains 180 km² of steep, mountainous terrain that ranges in elevation from 208 m at the gage to 1,478 m at the summit of Carter Dome. The USGS gaging station is 0.6 km west of the town of Gilead, Maine, at latitude 44°23'27'' and longitude 70°58'47''. The Wild River is a northeast-flowing tributary of the Androscoggin River and has a channel length of about 24 km. Stream gradients range from 10 m/km in the lower reaches of the main channel to as much as 60 m/km in the steep headwater tributaries. The main channel is perennial, and mean monthly discharge ranges from 1.53 m³/s during low-flow conditions in September to 14.7 m³/s in April, when snowmelt combines with spring rains. Average annual runoff from the basin was 89 cm from 1964 through 1995 (U.S. Geological Survey, Water Resources Data, Maine). Climate of the area is classified as humid continental with short, cool summers and long, cold winters. Average daily air temperatures range from -9.0°C in January to 19.0°C in July (Likens and others, 1977). Precipitation averages 119 cm annually, based on a USGS precipitation gage in the basin, and is fairly evenly distributed during the year (Kahl and others, 1991). A seasonal snowpack, which ranges from 150 to 200 cm in depth, develops each winter.
 |
The basin lies in the Adirondack-New England Mixed Forest ecoregion, which is in the transition zone between the boreal spruce-fir forest to the north and the deciduous forest to the south (Bailey and others, 1994). The forest is currently composed of 35 percent hardwoods, 15 percent conifers, and 50 percent mixed forest, which is largely a result of historic logging activities and recent forest management practices (U.S. Department of Agriculture, 1986). The major hardwood species are sugar maple, beech, yellow birch, paper birch, and aspen; conifers are predominantly hemlock, red spruce, and balsam fir. About 5 percent of the basin is covered by bare rock areas on the summits and in steep upland areas. Vegetation in these areas consists of heath, moss, lichen, and stunted spruce and birch. Soils in the basin are mostly well-drained Spodosols that have developed in Pleistocene till and outwash deposits and have textures that range from rocky to sandy loams (Williams and others, 1948). In general, soils are acidic (soil pH 3.3 to 4.6), have low exchangeable bases, and have low sulfate-adsorption capacities (Kahl and others, 1991).
Bedrock in the basin consists of a sequence of complexly deformed and metamorphosed sandstones, siltstones, and shales of Paleozoic age (Hatch and Moench, 1984). The metamorphosed sediments are mapped as a set of northeast-trending folds that are parallel to the drainage pattern and include the Devonian Littleton Formation and the Silurian Madrid, Smalls Falls, Perry Mountain, and Rangeley Formations (Hatch and Moench, 1984). The major rock types are coarse-grained gneisses, mica schists, and impure quartzites that are composed primarily of quartz, plagioclase, biotite, and garnet. Less common rock types include a calc-silicate granofels in the Madrid Formation and a sulfide-bearing schist in the Smalls Falls Formation. The Kinsman Formation, a Devonian quartz monzonite, is mapped along the southern divide of the basin. Pleistocene glacial materials in the basin were deposited by an active ice sheet that persisted in the area until about 14,000 years ago (Thompson and Fowler, 1989).
The Wild River Basin drains parts of Oxford County in Maine and Coos County in New Hampshire. Ninety-seven percent of the basin lies in
 |
Logging has been important in the land-use history of the Wild River Basin (Wight, 1971). Between 1890 and 1903, a logging railroad was operated along the river as far upstream as Red Brook and along the Bull Brook and Moriah Brook tributaries. During this period, several logging camps and mills were operated in the basin, and more than 300 people lived in the town of Hastings, which was near the current site of the Hastings Campground. Following a large fire in 1903 that destroyed several thousand hectares of timber in the headwater areas of the basin, the Hastings Lumber Company sold its land to the Federal Government, and by 1912 Hastings had become a ghost town. Between 1933 and 1936, the Civilian Conservation Corps constructed State Highway 113 between Gilead and Evans Notch and converted several old railroad grades into hiking trails.
Since 1935, the basin has been administered by the White Mountains National Forest, which manages it primarily for timber, recreation, and wildlife. Logging during the last 35 years has resulted in the thinning or harvesting of about 3,600 ha of forest land in the basin, with cuts that ranged in size from 0.5 to 785 ha (Wayne Millem, written commun., 1994). Since 1980, timber harvesting has been restricted to areas downstream from the Wild River Campground and in the Evans Brook subdrainage. Mining in the White Mountain region has been of minor importance, and no mines are currently in operation. The only known activity in the basin includes three gem-collecting sites near the southern basin divide and a small feldspar quarry near Peabody Mountain that was active from 1938 to 1940 (Gazdik and others, 1988). The Forest Service maintains two campgrounds and five back-country shelters in the basin. Several private cabins are situated along State Highway 113 just upstream from the gage. The Wild River Basin once served as a Forest Service barometer basin, and meteorological data were collected from 1966 to 1972 at a weather station near the Wild River Campground (Richard McKenna, Forest Service, oral commun., 1993).
The data set analyzed for this report includes 162 water-quality samples that were collected from September 1964 through June 1995. Sampling frequency progressively increased from 2 samples per year in 1964 to a maximum of 12 samples per year in 1969. Sampling frequency was reduced to bimonthly from 1971 through 1982 and quarterly from 1983 through 1995. Samples were analyzed at a USGS laboratory in Albany, N.Y., from 1964 through 1977, the USGS Central Laboratory in Atlanta, Ga., from 1978 through 1985, and at the NWQL in Arvada, Colo., from 1986 through 1995. Daily discharge records for the Wild River (station 01054200) are available beginning in July 1964. Daily precipitation amount was measured in the basin from 1990 through 1995 (Wild River Precipitation at Beans Purchase, N.H., station 441852071033101). Records of daily water temperature at the gage are available for July 1964 to September 1983 and November 1992 to September 1993.
Calculated ion balances for 154 samples with complete major ion analyses are shown in Figures 13a and 13b. Temporal variation of discharge, field pH, major ion concentrations, and ion balance at Wild River, Maine. Ion balances ranged from -41 to +31 percent, and less than 55 percent of the samples had values within the ±10 percent range. This large range of ion balances is not unexpected considering the difficulties in making precise analytical measurements at the low solute concentrations typical of this station. The average ion balance for all samples was -6.7, and almost 80 percent of the samples had negative ion balances, indicating that the samples had an excess of anions over cations. Natural waters commonly have an excess of cations in solution because of the presence of unmeasured organic anions. An anion excess is more difficult to explain than a cation excess and may indicate a bias in one of the analytical measurements. The alkalinity determination probably is the largest single source of error in a major ion analysis (Fishman and Friedman, 1989) and in dilute waters is often overestimated by analytical methods commonly used before 1975 (Kramer and Tessier, 1982). Laboratory alkalinity in HBN samples was determined by a fixed endpoint titration to pH 4.5. For waters with alkalinities below 100 meq/L, however, the endpoint pH is closer to 5.0, and titration to pH 4.5 may overestimate alkalinity by as much as 25 meq/L (Barnes, 1964). Because the average alkalinity and anion excess for the Wild River station were 98 meq/L and 25 meq/L, respectively, a bias in the laboratory alkalinity appears to be a reasonable explanation for the negative bias in the calculated ion balances.
 |
Time-series plots of the major dissolved constituents were inspected for evidence of method-related effects (fig. 13). Several patterns are evident at the Wild River station. For example, elevated concentrations of calcium and alkalinity were measured in many samples that were collected from 1974 through 1977. A more detailed analysis of the data revealed that the elevated calcium and alkalinity concentrations were not usually reported in the same samples, indicating that they were not related to real changes in stream chemistry. The only documented analytical or procedural change during this period was the introduction of a polypropylene churn splitter for compositing and splitting samples that was required for use at all HBN stations beginning in water year 1977 (Office of Water Quality Technical Memorandum No. 76.24-T, Sample Splitter for Water-Sediment Samples, issued August 16, 1976, at URL http://water.usgs.gov/admin/memo/). Although problems with previous sample splitters were not documented by the OWQ, the fact that the anomalous pattern disappeared around the beginning of 1977 indicates that previous splitters or compositing devices may have been a potential source of contamination. Figure 13 also shows a period of elevated sulfate concentrations during the late 1980's. This pattern coincides with the use of a turbidimetric titration method for the analysis of sulfate at the NWQL between March 1986 and December 1989 (Fishman and others, 1994). In 1989, the NWQL determined that sulfate concentrations can be overestimated by this technique and changed the method to ion chromatography in 1990 (Office of Water Quality Technical Memorandum No. 90.04, Turbidimetric Sulfate Method, issued December 21, 1989, at URL http://water.usgs.gov/admin/memo/). The bias was most pronounced in dilute waters, although it was not consistent among samples and appeared to be influenced by factors such as color and turbidity (Schertz and others, 1994).
Median concentrations and ranges of major dissolved constituents in stream water collected at the HBN gaging station and VWM concentrations in wet-only precipitation measured at the Greenville NADP station are presented in table 22. Precipitation chemistry at the NADP station, which is about 30 km south of the basin, is dilute and acidic with a VWM pH of 4.6 for 15 years of record. The dominant cations in precipitation were hydrogen and ammonium, which contributed 57 and 15 percent of the total cation charge, respectively. The dominant anions were sulfate, which accounted for 61 percent of the total anions, and nitrate, which accounted for 30 percent. The low pH and predominance of strong acid anions indicates that precipitation at the NADP station probably is affected by anthropogenic emissions of sulfur and nitrogen compounds, which cause acid rain (Likens and others, 1977).
[Concentrations in units of microequivalents per liter, discharge in cubic meters per second, specific conductance in microsiemens per centimeter at 25 degrees Celsius, pH in standard units, and silica in micromoles per liter; n, number of stream samples; VWM, volume-weighted mean; inst., instantaneous; spec. cond., specific conductance; --, not reported]
| Parameter | Stream Water | Precipitation VMAa | |||||
| Minimum | First quartile | Median | Third quartile | Maximum | n | ||
| Discharge, inst. | 0.25 | 1.1 | 2.7 | 6.5 | 240 | 163 | -- |
| Spec. cond., field | 15 | 20 | 22 | 25 | 36 | 162 | -- |
| pH, field | 5.2 | 6.3 | 6.4 | 6.7 | 7.3 | 162 | 4.6b |
| Calcium | 25 | 70 | 75 | 95 | 285 | 162 | 3.0 |
| Magnesium | 8.0 | 33 | 41 | 46 | 91 | 163 | 1.4 |
| Sodium | 17 | 43 | 52 | 61 | 130 | 162 | 3.8 |
| Potassium | <2.0 | 8.0 | 10 | 13 | 23 | 163 | .4 |
| Ammonium | <.7 | .7 | .7 | 2.7 | 14 | 75 | 6.7 |
| Alkalinity, laboratory | 20 | 66 | 98 | 120 | 340 | 155 | -- |
| Sulfate | 21 | 83 | 99 | 120 | 170 | 162 | 26 |
| Chloride | <3.0 | 14 | 21 | 29 | 120 | 160 | 3.9 |
| Nitrite plus nitrate | <.7 | 3.6 | 7.1 | 7.1 | 16 | 101 | 13c |
| Silica | 2.0 | 84 | 110 | 120 | 140 | 162 | -- |
a Values are volume-weighted mean concentrations for 1980—94.
b Laboratory pH.
c Nitrate only.
Stream water in the Wild River is dilute and weakly buffered; alkalinities were generally below 120 meq/L, and total ionic constituents ranged from 220 to 770 meq/L. The major cations in stream water were calcium and sodium, and the major anions were alkalinity and sulfate. The low concentrations of weathering-derived constituents, particularly alkalinity, reflect the slow weathering rates of silicate minerals in the bedrock. High rates of acidic deposition probably also contribute to the low alkalinities measured at this station. The median chloride concentration in stream water was 21 meq/L, which was 5.4 times larger than the VWM concentration of 3.9 meq/L in precipitation. On the basis of the difference between annual precipitation and runoff, evapotranspiration can account for no more than a twofold increase in the concentration of precipitation, indicating that a small amount of stream-water chloride
 |
The solute composition of stream water was further evaluated by analyzing correlations between solutes and stream discharge (table 23). Most weathering-derived constituents, particularly silica, had negative correlations with discharge. These results are consistent with a hydrologic system where weathering-enriched base flow is diluted by waters from shallow or surficial sources during periods of increased discharge. Among the ions, the strongest correlations were found between sodium and silic (r = 0.710) and calcium and magnesium (rho = 0.745), which indicates common mineralogic sources of these solutes. The most likely source of sodium and silica is plagioclase weathering, whereas calcium and magnesium probably are released by the weathering of hornblende and trace amounts of calcite (Stauffer and Wittchen, 1991). Chloride and sulfate were poorly correlated with other dissolved constituents with the exception of a weak positive correlation between sulfate and magnesium (rho = 0.535). This lack of correlation supports the idea that both chloride and sulfate are derived primarily from atmospheric sources. The weak correlation between sulfate and magnesium may be an indication that some stream-water cations are derived from leaching of the soil exchange complex by acidic precipitation (Johnson and Ruess, 1984).
[Q, discharge; Ca, calcium; Mg, magnesium; Na, sodium; K, potassium; Alk, alkalinity; SO4, sulfate; Cl, chloride; Si, silica]
| Q | pH | Ca | Mg | Na | K | Alk | SO4 | Cl | |
| pH | -0.646 | ||||||||
| Ca | -.512 | 0.435 | |||||||
| Mg | -.503 | .444 | 0.745 | ||||||
| Na | -.664 | .517 | .681 | 0.515 | |||||
| K | -.168 | .238 | .393 | .296 | 0.316 | ||||
| Alk | -.453 | .467 | .413 | .293 | .539 | 0.209 | |||
| SO4 | -.182 | .270 | .314 | .535 | .258 | .220 | -0.044 | ||
| Cl | .015 | -.038 | .227 | .165 | .193 | .004 | -.013 | 0.293 | |
| Si | -.826 | .635 | .599 | .513 | .710 | .275 | .572 | .201 | -0.017 |
The results of the seasonal Kendall test for trends in discharge and major dissolved constituents are shown in table 24. Statistically significant downward trends in calcium and sulfate concentrations and an upward trend in flow-adjusted silica concentrations were detected at the 0.01 confidence level. The trend in the flow-adjusted calcium concentrations was not calculated because the flow model was not statistically significant at the 0.1 confidence level. Trends in the sulfate data were similar for unadjusted and flow-adjusted concentrations, indicating that the trend was not driven by variations in stream discharge. The LOWESS curve in figure 13 shows that the decrease in sulfate concentrations was relatively constant since the late 1960's aside from the period of analytical bias in the late 1980's. Most of the decrease in calcium concentrations occurred after 1974, although the pattern probably is influenced somewhat by analytical bias in the early part of the record. A decline in stream-water sulfate in the Wild River may be linked to declining sulfur dioxide emissions in the Northeastern United States since 1970 (Husar and others, 1991) and is consistent with declines reported at other sites in the region. Smith and Alexander (1983) noted small declines in stream sulfate at a number of HBN stations in the Northeast, including the Wild River. Concentrations of sulfate in stream water at the Hubbard Brook Experimental Forest in New Hampshire have decreased at a rate of 2 (meq/L)/yr from 1964 to 1985 (Driscoll and others, 1989). The decline in stream-water sulfate at Hubbard Brook was balanced by a decrease in base cations rather than an increase in stream-water pH, indicating that declines in stream-water concentrations of these constituents are linked to long-term decreases in the atmospheric deposition of both sulfate and base cations (Driscoll and others, 1989). The downward trend in calcium concentrations in the Wild River also may be related to declines in atmospheric deposition, although no long-term precipitation records are available to confirm such a relationship.
[Trends in units of microequivalents per liter per year, except discharge in cubic meters per second per year, pH in standard units per year, and silica in micromoles per liter per year; <, less than; --, not calculated]
| Parameter | Unadjusted | Flow adjusted | ||
| Trend | p-value | Trend | p-value | |
| Discharge | 0.02 | 0.120 | -- | -- |
| pH, field | <.01 | .700 | < 0.01 | 0.313 |
| Calcium | -1.0 | .000 | (a) | -- |
| Magnesium | -.1 | .042 | -.1 | .109 |
| Sodium | -.2 | .012 | -.2 | .032 |
| Potassium | <.1 | .999 | <.1 | .483 |
| Alkalinity, laboratory | <.1 | .249 | <.1 | .984 |
| Sulfate | -.8 | .000 | (a) | -- |
| Chloride | <.1 | .155 | -.2 | .020 |
| Nitrite plus nitrate | (b) | -- | -- | -- |
| Silica | .2 | .206 | .4 | .001 |
aFlow model not significant at a = 0.10.
bInsufficient data to calculate trend.
The source of the upward trend in silica concentrations could not be determined. Because the trend was only detected in the flow-adjusted data, it probably is related to an environmental change in the basin rather than a change in analytical method (Hirsch and others, 1982). The most obvious environmental changes that have occurred during the period of record include a decrease in logging activity in the basin and a regional decline in acidic deposition. Both of these environmental changes, however, are more likely to have caused a decrease in stream-water silica than an increase, indicating that less obvious environmental factors may have contributed to the upward trend in silica.
Results of the surface-water synoptic sampling of October 7 and 8, 1991, are presented in table 25; locations of sampling sites are shown in figure 12. The basin was sampled during stormflow conditions following a 10-cm storm event on October 6. The daily mean discharge at the gage on October 7 and 8, 1991, was 33.7 m³/s and 11.2 m³/s, respectively, although the instantaneous discharge at the gage had fallen to 3.4 m³/s at the time of sampling. Because of the storm event, solute concentrations at the gage (site 1) were below the first quartile concentrations that were measured at the gage during the entire period of record (table 22), and the alkalinity was close to the lowest concentration on record. The chemistry of the tributary streams also was extremely dilute and did not vary markedly among the sampling sites. The dominant cation was calcium, which ranged from 36 to 85 meq/L, and the dominant anion was sulfate, which ranged from 58 to 110 meq/L. All sites had extremely low alkalinities (less than 35 meq/L), and two of the tributaries (sites 4 and 5) had pH values below 5.0. Nitrate concentrations in all tributaries were less than the detection limit of 0.7 meq/L, and chloride concentrations ranged from 8.5 to 14 meq/L. These results, particularly the low stream-water alkalinities, indicate that the tributary streams were strongly affected by the recent storm, and the data probably are not indicative of processes that control stream chemistry in the basin under base-flow conditions. A large component of stormflow would tend to mask spatial variations in stream chemistry that reflect basin characteristics, such as geology.
[Site locations shown in fig. 12; Q, discharge in cubic meters per second; SC, specific conductance in microsiemens per centimeter at 25 degrees Celsius; pH in standard units; Ca, calcium; Mg, magnesium; Na, sodium; K, potassium; Alk, alkalinity; SO4, sulfate; Cl, chloride; NO3, nitrate; concentrations in microequivalents; Si, silica in micromoles per liter; <, less than; --, not measured]
| Site | Station number | Q | SC | pH | Ca | Mg | Na | K | Alk | SO4 | Cl | NO3 | Si | Criteriaa | Remarks |
| 1 | 01054200 | 3.40 | 17 | 5.8 | 60 | 26 | 35 | 9.0 | 15 | 85 | 12 | <0.7 | 73 |
|
Logging downstream from site 6 |
| 2 | 441459071060200 | -- | 13 | 5.3 | 36 | 12 | 30 | 4.1 | <1.0 | 63 | 8.7 | <.7 | 63 | BG | Monzonite |
| 3 | 441607071062300 | -- | 12 | 5.6 | 37 | 19 | 22 | 6.1 | 5.1 | 58 | 8.7 | <.7 | 53 | BG | Aluminous schist, granofels |
| 4 | 441647071033500 | -- | 19 | 4.8 | 41 | 17 | 35 | 4.9 | <1.0 | 69 | 9.6 | <.7 | 78 | BG | Quartzite, mica schist |
| 5 | 441751071032600 | -- | 22 | 4.7 | 44 | 19 | 35 | 3.6 | <1.0 | 87 | 10 | <.7 | 75 | BG | Calc-silicate granofels |
| 6 | 441758071043900 | -- | 15 | 5.5 | 48 | 24 | 26 | 7.4 | 6.6 | 67 | 9.0 | <.7 | 60 | MT, LU | Roadless area, no logging |
| 7 | 441806071045100 | -- | 15 | 5.9 | 48 | 33 | 30 | 6.9 | 21 | 73 | 8.5 | <.7 | 67 | BG | Mixed lithology |
| 8 | 442035070585100 | 1.43 | 18 | 6.0 | 80 | 35 | 39 | 6.9 | 20 | 90 | 12 | <.7 | 78 | MT, LU | Highway, logging in subbasin |
| 9 | 442037070584700 | .36 | 19 | 6.0 | 70 | 32 | 39 | 6.6 | 11 | 100 | 13 | <.7 | 80 | BG | Aluminous schist, granofels |
| 10 | 442115070594100 | .05 | 19 | 5.9 | 75 | 30 | 48 | 9.0 | 25 | 90 | 14 | <.7 | 93 | BG | Sulfidic schist |
| 11 | 442213070592900 | .24 | 22 | 6.4 | 85 | 40 | 57 | 9.5 | 34 | 110 | 14 | <.7 | 105 | BG | Sulfidic schist |
a Criteria used in selection of sampling sites: BG = bedrock geology, MT = major tributary, LU = land use.
Bailey, R.G., Avers, P.E., King, T., and McNab, W.H., eds., 1994, Ecoregions and subregions of the United States with supplementary table of map unit descriptions: Washington, D.C., U.S. Department of Agriculture Forest Service, scale 1:7,500,000 (also at URL http://www.fs.fed.us/land/ecosysmgmt/ecoreg1_home.html).
Barnes, Ivan, 1964, Field measurement of alkalinity and pH: U.S. Geological Survey Water-Supply Paper 1535-H, 17 p.
Driscoll, C.T., Likens, G.E., Hedin, L.O., Eaton, J.S., and Bormann, F.H., 1989, Changes in the chemistry of surface waters: Environmental Science and Technology, v. 23, p. 137-143.
Fishman, M.J., and Friedman, L.C., eds. 1989, Methods for determination of inorganic substances in water and fluvial sediments: U.S. Geological Survey Techniques of Water-Resources Investigations, book 5, chap. A1, 545 p.
Gazdik, G.C., Harris, R.A., Welsh, R.A., Jr., and Girol, V.P., 1988, Mines, prospects, and mineral sites, wilderness and RARE II areas, White Mountain National Forest, New Hampshire: U.S. Geological Survey Miscellaneous Field Studies MF–1594–E, scale 1:250,000.
Hatch, N.L., Jr., and Moench, R.H., 1984, Bedrock geologic map of the wildernesses and roadless areas of the White Mountain National Forest, Coos, Carroll, and Grafton Counties, New Hampshire: U.S. Geological Survey Miscellaneous Field Studies MF-1594-A, scale 1:250,000.
Hirsch, R.M., Slack, J.R., and Smith, R.A., 1982, Techniques of trend analysis for monthly water-quality data: Water Resources Research, v. 18, no. 1, p. 107-121.
Husar, R.B., Sullivan, T.J., and Charles, D.F., 1991, Historical trends in atmospheric sulfur deposition and methods for assessing long-term trends in surface water chemistry, in Charles, D.F., ed., Acidic deposition and aquatic ecosystems—Regional case studies: New York, Springer-Verlag, p. 48-92.
Johnson, D.W., and Ruess, J.O., 1984, Soil mediated effects of atmospherically deposited sulphur and nitrogen: Philosophical Transactions of the Royal Society of London, ser. B, v. 305, p. 383-392.
Kahl, J.S., Norton, S.A., Cronan, C.S., Fernandez, I.J., Bacon, L.C., and Haines, T.A., 1991, Maine, in Charles, D.F., Acidic deposition and aquatic ecosystems-Regional case studies: New York, Springer-Verlag, p. 203-235.
Kramer, James, and Tessier, Andre, 1982, Acidification of aquatic systems-A critique of chemical approaches: Environmental Science and Technology, v. 16, no. 11, p. 606A-615A.
Likens, G.E., Bormann, F.H., Pierce, R.S., Eaton, J.S., and Johnson, N.M., 1977, Biogeochemistry of a forested ecosystem: New York, Springer-Verlag, 146 p.
Peters, N.E., 1991, Chloride cycling in two forested lake watersheds in the west-central Adirondack Mountains, New York, U.S.A.: Water, Air, and Soil Pollution, v. 59, p. 201-215.
Schertz, T.L., Wells, F.C., and Ohe, D.J., 1994, Sources of trends in water-quality data for selected streams in Texas, 1975-89 water years: U.S. Geological Survey Water-Resources Investigation 94-4213, 49 p.
Smith, R.A., and Alexander, R.B., 1983, Evidence for acid-precipitation-induced trends in stream chemistry at hydrologic benchmark stations: U.S. Geological Survey Circular 910, 12 p.
Stauffer, R.E., and Wittchen, B.D., 1991, Effects of silicate weathering on water chemistry in forested, upland, felsic terrane of the USA: Geochimica et Cosmochimica Acta, v. 55, p. 3253-3271.
Thompson, W.B., and Fowler, B.K., 1989, Deglaciation of the upper Androscoggin River valley and northeastern White Mountains, Maine and New Hampshire: Maine Geological Survey, v. 6, p. 71–88.
U.S. Department of Agricuture, 1986, Final environmental impact statement, land and resource management plan, White Mountain National Forest: Forest Service, Eastern Region, New Hampshire, 759 p.
U.S. Geological Survey, published annually, Water resources data, Maine, Augusta: U.S. Geological Survey Water Data Report.
Wight, D.B., 1971, The Wild River Wilderness: Littleton, N.H., Courier Printing Co., Inc., 158 p.
Williams, B.H., Coates, W.H, and Scripture, P.N., 1948, Soil survey of Coos County, New Hampshire: U.S. Department of Agriculture Soil Conservation Service, Series 1937, no. 5, 99 p.
a. U.S. Geological Survey topographic maps:
b. Geologic Maps:
c. Soil surveys:
d. Other maps:
Table B-1. NWIS site identification numbers and site names for water-quality sampling sites.
| Site | Identification Number | Site Name |
| 1 | 01054200 | WILD RIVER AT GILEAD, MAINE |
| 2 | 441459071060200 | UNNAMED TRIBUTARY TO WILD R. NR NORTH BALDFACE, ME |
| 3 | 441607071062300 | SPRUCE BROOK NEAR GILEAD, MAINE |
| 4 | 441647071033500 | BLUE BROOK AT BLUE BROOK SHELTER, MAINE |
| 5 | 441751071032600 | UNNAMED TRIBUTARY TO BLUE BROOK NR GILEAD, MAINE |
| 6 | 441758071043900 | WILD RIVER AT WILD RIVER CAMPGROUND, MAINE |
| 7 | 441806071045100 | MORIAH BROOK NEAR GILEAD, MAINE |
| 8 | 442035070585100 | EVANS BROOK AB MORRISON BROOK NR GILEAD, MAINE |
| 9 | 442037070584700 | MORRISON BROOK NR GILEAD, MAINE |
| 10 | 442115070594100 | UNNAMED TRIBUTARY TO WILD RIVER NR HASTINGS, MAINE |
| 11 | 442213070592900 | LITTLE LARY BROOK NR GILEAD, MAINE |
| Back to 1173-A Contents |
This page maintained by Nichole Bisceglia.
Last updated July 31, 2000.