
Hydrologic Benchmark Network Stations in the Eastern U.S. 1963-95 (USGS Circular 1173-A)
| Abstract and Map Index | List of all HBN Stations | Introduction to Circular | Analytical Methods |
Cypress Creek near Janice, Mississippi (Station 02479155)
To download a printer friendly PDF version of this information click here.
This report details one of the approximately 50 stations in the Hydrologic Benchmark Network (HBN) described in the four-volume U.S. Geological Survey Circular 1173. The suggested citation for the information on this page is:
|
All of the tables and figures are numbered as they appear in each circular. Use the navigation bar above to view the abstract, introduction and methods for the entire circular, as well as a map and list of all of the HBN sites. Use the table of contents below to view the information on this particular station.
|
|
| 1. Site Characteristics and Land Use |
| 2. Historical Water Quality Data and Time-Series Trends |
| 3. Synoptic Water Quality Data |
| 4. References and Appendices |
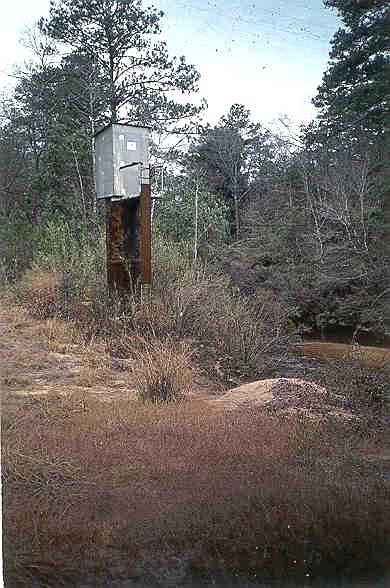
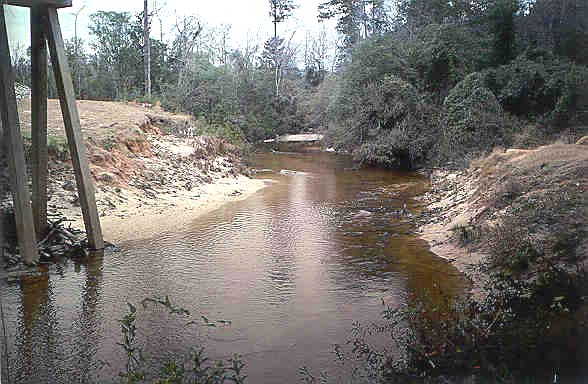
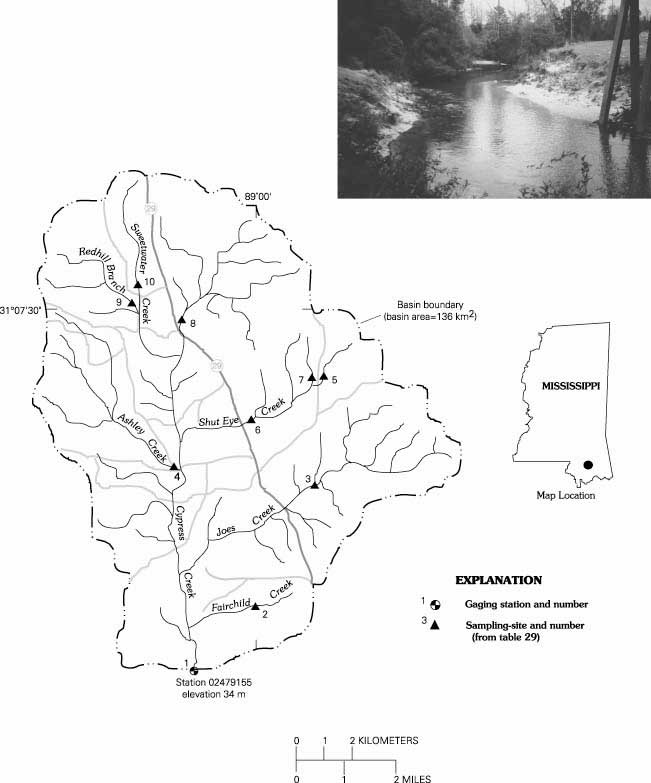
The Cypress Creek HBN Basin is in the Southern Pine Hills section of the Coastal Plain physiographic province in southeastern Mississippi (Figure 14. Map of the study area in Cypress Creek and photograph of the stream channel at the gage). The topography of the area is rolling to hilly with rounded ridges and broad, mature drainages (U.S. Department of Agriculture, 1994). Cypress Creek drains 136 km² of forested terrain that ranges in elevation from 34 m at the gage to 98 m along the northeast basin divide. The basin also contains some swamps along slower moving sections of the creek. The USGS gaging station is 2 km east of Janice, Miss., at latitude 31°01'30'' and longitude 89°01'00''. Cypress Creek is a south-flowing tributary of the Leaf River with a channel length of about 20 km upstream from the gage and an average stream gradient of 2.0 m/km. The main channel is perennial, and mean monthly discharge ranges from 1.08 m³/s in August to 5.38 m³/s in February and March. Average annual runoff from the basin was 70 cm from 1972 through 1995 (U.S. Geological Survey, Water Resources Data, Mississippi). Climate of the area is influenced by weather systems in the Gulf of Mexico and is characterized by persistent humidity and mild temperatures (U.S. Department of Agriculture, 1994). Average monthly air temperatures range from 9.1°C in January to 27.4°C in July, and the frost-free season averages 259 days (U.S. Department of Agriculture, 1994). Precipitation averages 152 cm annually; October is the driest month (7.6 cm) and March is the wettest (16.2 cm).
 |
The basin lies in the Outer Coastal Plain Mixed Forest ecoregion (Bailey and others, 1994) and the dominant forest type is longleaf-slash pine. Drier sites in the basin are dominated by longleaf pine with variable amounts of turkey oak, bluejack oak, and blackjack oak (U.S. Department of Agriculture, 1985). Depending on soil moisture, understory species may include grasses, Jessamine shrubs, wax myrtle, blackberry, and prickly-pear cactus. Slash pine, the dominant species type on moist sites, grows in pure stands or stands mixed with longleaf pine, loblolly pine, and hardwoods. Wet sites along drainages are dominated by sweet bay-swamp tupelo- red maple forest communities. Most soils in the basin are classified as Ultisols (Paleudults) and are mapped in the McLaurin-Prentiss-Freestone and McLaurin- Luch-Troup soil associations (U.S. Department of Agriculture, 1994). They are found on ridges and side slopes and are generally well drained with textures that range from loamy sand to fine, sandy loam. The dominant soil minerals are quartz, kaolinite, and montmorillonite.
Bedrock in the basin includes gently dipping, nonmarine sediments of the Tertiary Hattiesburg and Citronelle Formations (Gandl and Spiers, 1980). The Hattiesburg Formation consists of greenish-gray, silty and sandy clays with interbedded sands, and the Citronelle Formation is orange-red to tan silty sand, with occasional layers of gravel and clay (Brandwein and White, 1983). Both units are composed primarily of quartz and clay and are not easily distinguished except that the heavy mineral suite of the Hattiesburg Formation contains epidote, garnet, and hornblende, which are absent in the Citronelle Formation (Brandwein and White, 1983). The Hattiesburg Formation is one of the principal aquifers used for domestic water supplies in the area (Morse, 1944). The headwaters area of Cypress Creek is underlain by the Cypress Creek Salt Dome, one of 50 such domes in the Mississippi salt-dome basin (Spiers and Gandl, 1980). In the late 1970's and early 1980's, the U.S. Department of Energy investigated the suitability of salt domes in Mississippi, including the Cypress Creek Salt Dome, as sites for nuclear waste disposal (Spiers and Gandl, 1980). A swampy area about 2.5 km² in extent occupies a topographic low in the headwaters of Cypress Creek directly above the salt dome. Although the dome is 460 m below the surface, this swampy area may have formed in a depression caused by dissolution of salt at depth and subsequent collapse of the overlying sediments (Spiers and Gandl, 1980).
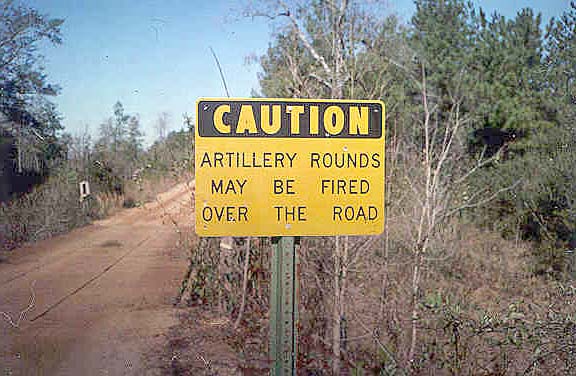
The Cypress Creek Basin drains parts of Perry County in southeastern Mississippi and is entirely in the boundaries of the De Soto National Forest. Most land in the northern one-half of the basin is in the Camp Shelby Special Use area that is used as a military practice area by the U.S. Army National Guard. About 15 percent of land in the National Forest boundary is owned by private individuals and logging companies. More than 60 km of forest and county roads provide vehicle access to most areas of the basin. State Highway 29 bisects the basin from north to south. Public access is allowed in the Camp Shelby Special Use area except when military exercises are being conducted. Historically, land in the Cypress Creek Basin was owned by timber companies who removed most of the native longleaf pine forests in the early 1900's. Many logged areas were subsequently sold to the Federal Government, and the De Soto National Forest was established in the mid-1930's. Currently, the basin is covered by second- and third-growth pine and hardwood stands which the De Soto National Forest manages on an even-aged basis with 80-year rotations for pines and a 100-year rotation for hardwoods. The primary cutting methods used are clearcutting and seedtree and shelterwood removals of which about one-half are done by hand and one-half by mechanical means (U.S. Department of Agriculture, 1985). The forest management plan also includes provisions for improving wildlife habitat, especially for the endangered red-cockaded woodpecker and the threatened gopher tortoise (Tony Rivers, Forest Service, oral commun., 1996). A special-use permit to Camp Shelby has allowed the U.S. Department of the Army and Mississippi National Guard to use the upper one-half of the basin for military training including tank maneuvers and artillery practice since 1959. A detailed description of the Camp Shelby Training Facilities and their impacts on National Forest lands can be found in an Environmental Impact Statement prepared by the Forest Service (U.S. Department of Agriculture, 1994).
The HBN data set analyzed for this report includes 153 water-quality samples that were collected from December 1966 through May 1995. Sampling frequency ranged from semiannual to monthly from 1967 through 1974. Sampling frequency was bimonthly from 1975 through 1982 and quarterly from 1985 through 1995. Although not documented, water-quality samples in the early part of the record probably were analyzed at one of three USGS laboratories (Raleigh, N.C.; Ocala, Fla.; Tuscaloosa, Ala.) that provided analytical services for the Southeastern Region (Durum, 1978). After establishment of the Central Laboratory System, samples were analyzed at the Central Laboratory in Atlanta, Ga., from 1973 through 1985 and at the NWQL in Arvada, Colo., from 1986 through 1995. Daily discharge records for Cypress Creek (station 02479155) are available beginning in October 1966.
 |
Calculated ion balances for 149 samples with complete major ion analyses are shown in Figures 15a and 15b. Temporal variation of discharge, field pH, major ion concentrations, and ion balance at Cypress Creek, Mississippi. Ion balances ranged from -37 to +45 percent, and 45 percent of the samples had calculated values outside the ±10 percent range. This wide range of values is not unexpected considering the difficulties in making precise analytical measurements at the low solute concentrations typical of this station. The mean charge balance was -4.7 percent, and almost 60 percent of samples had negative ion balances, indicating that the samples had a slight excess of measured anions over cations. The anion excess at this site was somewhat difficult to explain, particularly considering that organic anions may be an important component of stream water based on the tealike color of stream water. As mentioned previously, the apparent anion excess may be because of an overestimation of laboratory alkalinity by the fixed endpoint titration to pH 4.5 (Office of Water Quality Technical Memorandum No. 80.27, New Parameter Codes for pH, Alkalinity, Specific Conductance, and Carbonate/ Bicarbonate, issued September 19, 1980, at URL http://water.usgs.gov/admin/memo/). For waters with alkalinities below 100 meq/L, however, the endpoint pH is closer to 5.0, and titration to pH 4.5 may overestimate alkalinity by as much as 25 meq/L (Barnes, 1964). Because the average alkalinity and anion excesses for this station were 60 meq/L and 27 meq/L, respectively, a bias in the laboratory alkalinity appears to be a reasonable explanation for the negative ion balances.
Time-series plots of the major dissolved constituents were inspected for evidence of method-related effects (fig. 15). Several notable patterns were found at the Cypress Creek station, particularly for calcium, sulfate, nitrite plus nitrate, and field pH. For example, several uncharacteristically high calcium concentrations were reported between 1974 and 1976, a pattern that has been observed at other stations in the HBN (for example, Wild River, Maine, and Scape Ore Swamp, S.C.). Because samples from these three sites were analyzed at different laboratories, it seems plausible that the high concentrations may be related to a common sampling or processing procedure. The only documented analytical or procedural change during this period was the introduction of a polypropylene churn splitter for compositing and splitting samples that was required for use at all HBN stations beginning in water year 1977 (Office of Water Quality Technical Memorandum No. 76.24-T, Sample Splitter for Water-Sediment Samples, issued August 16, 1976, at URL http://water.usgs.gov/admin/memo/). Although problems with previous sample splitters were not documented by the OWQ, the fact that the anomalous pattern disappeared around the beginning of 1977 indicates that previous splitters or compositing devices may have been a potential source of contamination. The elevated sulfate concentrations reported between 1985 and 1989 occurred during the period when sulfate was analyzed by a turbidimetric titration method. It has been documented that sulfate concentrations can be overestimated by this technique, particularly in dilute or colored waters (Office of Water Quality Technical Memorandum No. 90.04, Turbidimetric Sulfate Method, issued December 21, 1989, at URL http://water.usgs.gov/admin/memo/). The cause of several zero sulfate concentrations reported in the early part of the record could not be identified. The pattern in nitrite plus nitrate concentrations clearly reflects several changes in the detection limit cutoffs during the period of record. The time-series plot of field pH shows two definite shifts, one upward in the early 1970's and another downward in the early 1980's. Changes in field protocols during the early part of the record are not well documented; however, the shift in the early 1980's coincides with the release of guidelines from the OWQ for obtaining accurate field pH measurements in low-conductivity waters (Office of Water Quality Technical Memorandum No. 81.08, Electrodes for pH Measurement in Low-Conductivity Waters, issued February 10, 1981, at URL http://water.usgs.gov/admin/memo/). Although these protocols were not required for pH determination at HBN stations, it is likely that many USGS offices may have changed the procedures and equipment they used shortly after this memorandum was issued.
Median concentrations and ranges of major constituents in stream water collected at the HBN gaging station and VWM concentrations in wet only precipitation measured at the NADP Southeast Research Station in Louisiana about 80 km southwest of the basin are presented in table 26. Precipitation chemistry at the NADP station is dilute and slightly acidic, with a VWM pH of 4.8 during the 12 years of record. The dominant cations in precipitation were hydrogen, sodium, and ammonium, which contributed 34, 26, and 24 percent of the cation charge, respectively. Sulfate, the dominant anion, contributed 47 percent of the anion charge, and chloride and nitrate accounted for 29 and 24 percent, respectively. These results indicate that precipitation at the HBN station probably is affected by both anthropogenic emissions of sulfur and nitrogen compounds, which cause acid rain, and by salts derived from marine aerosols (Likens and others, 1977).
[Concentrations in units of microequivalents per liter, discharge in cubic meters per second, specific conductance in microsiemens per centimeter at 25 degrees Celsius, pH in standard units, and silica in micromoles per liter; n, number of stream samples; VWM, volume-weighted mean; inst., instantaneous; spec. cond., specific conductance; <, less than; --, not reported]
| Parameter | Stream Water | Precipitation VMAa | |||||
| Minimum | First quartile | Median | Third quartile | Maximum | n | ||
| Discharge, inst. | 0.14 | 0.78 | 0.93 | 2.3 | 110 | 149 | -- |
| Spec. cond., field | 14 | 20 | 22 | 25 | 47 | 151 | -- |
| pH, field | 4.2 | 5.4 | 5.7 | 6.1 | 7.8 | 150 | 4.8b |
| Calcium | 5.0 | 35 | 43 | 55 | 160 | 150 | 4.5 |
| Magnesium | <8.0 | 24 | 32 | 40 | 80 | 150 | 3.1 |
| Sodium | 26 | 83 | 87 | 100 | 180 | 149 | 12 |
| Potassium | 2.6 | 10 | 10 | 15 | 79 | 150 | .7 |
| Ammonium | <14 | 19 | 26 | 36 | 110 | 62 | 11 |
| Alkalinity, laboratory | <20 | 40 | 60 | 80 | 220 | 151 | -- |
| Sulfate | <20 | 20 | 44 | 67 | 420 | 152 | 23 |
| Chloride | 34 | 82 | 90 | 100 | 250 | 153 | 14 |
| Nitrite plus nitrate | <.7 | 2.3 | 3.6 | 5.4 | 28 | 66 | 12c |
| Silica | 40 | 150 | 160 | 180 | 820 | 151 | -- |
a Data are volume-weighted mean concentrations for 01/83 through 12/94.
b Laboratory pH.
c Nitrate only.
Stream water in Cypress Creek is dilute and weakly buffered; specific conductances ranged from 14 to 47 mS/cm and alkalinities generally were between 40 and 80 meq/L. The dominant cations in stream water were sodium and calcium, and the dominant anions were chloride and
 |
The solute composition of stream water was further evaluated by analyzing correlations between solutes and stream discharge (table 27). Most dissolved constituents were poorly correlated with discharge with the exception of weak inverse correlations with alkalinity (r = -0.555) and pH (r = -0.632). Correlations among the solutes also were weak with the exception of a positive correlation between calcium and magnesium (r = 0.728). The lack of correlations between most constituents and flow probably is related to the narrow range of solute concentrations measured at this station. The quartz-rich sediments underlying the basin are relatively unreactive and produce dilute soil and ground waters that are not significantly different in composition from that of the incoming precipitation. The result is that the chemical composition of stream water remains relatively constant over a wide range of hydrologic conditions.
[Q, discharge; Ca, calcium; Mg, magnesium; Na, sodium; K, potassium; Alk, alkalinity; SO4, sulfate; Cl, chloride; Si, silica]
| Q | pH | Ca | Mg | Na | K | Alk | SO4 | Cl | |
| pH | -0.632 | ||||||||
| Ca | .406 | -0.322 | |||||||
| Mg | .129 | -.152 | 0.728 | ||||||
| Na | -.494 | .169 | .103 | 0.253 | |||||
| K | -.105 | .159 | .353 | .382 | 0.242 | ||||
| Alk | -.555 | .565 | -.548 | -.342 | .109 | 0.018 | |||
| SO4 | .232 | -.385 | .315 | .197 | .046 | .224 | -0.366 | ||
| Cl | -.036 | -.115 | .088 | .206 | .335 | -.002 | -.163 | 0.100 | |
| Si | -.522 | .271 | .011 | .234 | .600 | .191 | .106 | .015 | 0.339 |
Results of the seasonal Kendall test for trends in discharge and major dissolved constituents are shown in table 28. Statistically significant upward trends were detected for magnesium and nitrite plus nitrate concentrations and a downward trend in calcium was detected at the 0.01 confidence level. The trend in magnesium was similar for unadjusted and flow-adjusted concentrations, indicating that the trend was not driven by variations in stream discharge. The trend in flow-adjusted calcium concentrations could not be calculated because the flow model was not
 |
[Trends in units of microequivalents per liter per year, except discharge in cubic meters per second per year, pH in standard units per year, and silica in micromoles per liter per year; <, less than; --, not calculated]
| Parameter |
|
Flow adjusted | ||
| Trend | p-value | Trend | p-value | |
| Discharge | 0.01 | 0.057 | -- | -- |
| pH, field | -.01 | .105 | -0.01 | 0.210 |
| Calcium | -.6 | .000 | (a) | -- |
| Magnesium | .4 | .005 | .4 | .010 |
| Sodium | <.1 | .768 | .1 | .335 |
| Potassium | <.1 | .421 | <.1 | .235 |
| Alkalinity, laboratory | <.1 | .203 | -.4 | .233 |
| Sulfate | .9 | .033 | .6 | .222 |
| Chloride | .1 | .403 | .1 | .564 |
| Nitrite plus nitrate | 0.4b | .000 | -- | -- |
| Silica | <.1 | .111 | <-.1 | .475 |
a Flow model not significant at a = 0.10.
b Trend calculated using a test for censored data.
Results of the surface-water synoptic sampling conducted on January 17-18, 1991, are given in table 29; locations of sampling sites are shown in figure 15. Discharge at the gage was 1.02 m³/s compared to the median daily discharge of 2.83 m³/s for the month of January (Lawrence, 1987), indicating that the basin was sampled under low base-flow conditions for that time of year. Solute concentrations measured at the gage (site 1) during the synoptic were similar to the median values at the gage over the entire period of record except for sulfate, which was higher, and alkalinity, which was lower (table 26). Tributary streams were similar in chemical composition to stream water at the gage, and sodium and chloride were the dominant ions. All samples were slightly acidic, with pH values ranging from 4.35 to 5.38. Organic acids probably are the main source of acidity in these waters, although some acidity may be derived from strong acid inputs from precipitation. The presence of organic acids in surface waters is supported by the observation that all samples had positive ion balances (range 0.6 to 14 percent).
[Site locations shown in fig. 14; Q, discharge in cubic meters per second; SC, specific conductance in microsiemens per centimeter at 25 degrees Celsius; pH in standard units; Ca, calcium; Mg, magnesium; Na, sodium; K, potassium; Alk, alkalinity; SO4, sulfate; Cl, chloride; NO3, nitrate; concentrations in microequivalents; Si, silica in micromoles per liter; <, less than; --, not measured]
| Site | Station number | Q | SC | pH | Ca | Mg | Na | K | Alk | SO4 | Cl | NO3 | Si | Criteriaa | Remarks |
| 1 | 02479155 | 1.02 | 28 | 5.00 | 43 | 51 | 96 | 9.2 | <10 | 75 | 99 | 3.6 | 170 |
|
|
| 2 | 310223089000700 | .28 | 22 | 5.38 | 43 | 50 | 74 | 10 | <10 | 58 | 79 | 9.3 | 120 | LU | Rural residences |
| 3 | 310415088590100 | .22 | 28 | 4.88 | 44 | 52 | 83 | 9.0 | <10 | 85 | 100 | 1.4 | 160 | LU | Forested subbasin |
| 4 | 310501089011200 | .14 | 26 | 4.98 | 39 | 46 | 83 | 9.7 | <10 | 73 | 93 | <.7 | 180 | LU | Forested subbasin |
| 5 | 310620088582000 | .042 | 28 | 4.85 | 38 | 50 | 83 | 9.2 | <10 | 83 | 100 | <.7 | 170 | LU | Forested subbasin |
| 6 | 310542088595200 | -- | 26 | 4.83 | 33 | 47 | 87 | 11 | <10 | 65 | 96 | 1.4 | 180 | LU | Drains bombing range area |
| 7 | 310621088582100 | .011 | 26 | 4.92 | 37 | 50 | 96 | 7.4 | <10 | 90 | 93 | <.7 | 200 | LU | Drains bombing range area |
| 8 | 310711089005400 | .31 | 43 | 4.35 | 48 | 64 | 140 | 12 | <10 | 110 | 130 | <.7 | 160 | LU | Drains bombing range area |
| 9 | 310743089015000 | .18 | 23 | 4.90 | 27 | 34 | 78 | 4.9 | <10 | 54 | 85 | .7 | 180 | LU | Drains tank maneuver area |
| 10 | 310801089014500 | .071 | 21 | 4.86 | 26 | 32 | 83 | 4.4 | <10 | 46 | 82 | <.7 | 150 | LU | Drains tank maneuver area |
aCriterion used in selection of sampling sites: LU = land use
The results presented in table 29 indicate there was relatively little spatial variability in surface waters sampled during the synoptic. This uniformity in stream chemistry reflects the unreactive nature of the underlying quartz-rich sediments, which do not significantly alter the composition of the incoming precipitation. Site 8 was the one location that had noticeably higher solute concentrations than the other sites, particularly for sodium, chloride, and sulfate. For example, sodium was 140 meq/L at site 8 compared to the range of 74 to 96 meq/L at the other tributary sites. Sulfate was 110 meq/L at site 8 compared to the range of 46 to 90 meq/L at the other tributary sites. Site 8 is immediately downstream from a small wetland area that is believed to have formed from the collapse of sediments overlying the Cypress Creek Salt Dome. These chemical results may indicate that stream water at this site is partly affected by ground water associated with the salt dome (Spiers and Gandl, 1980). Several sites also were sampled to determine the effects of the Special Use Area on surface-water chemistry. Surface waters sampled downstream from military training areas (sites 6-10) were not significantly different in composition from streams draining unaffected subbasins (sites 3-5) except for site 8, which might be influenced by the salt dome. These results indicate that under low-flow conditions, the effect of the military operations on surface-water chemistry appears to be minimal. This finding, however, might be different during periods of high runoff when these areas may disproportionately contribute sediment and dissolved solutes to some streams within the basin.
Bailey, R.G., Avers, P.E., King, T., and McNab, W.H., eds., 1994, Ecoregions and subregions of the United States with supplementary table of map unit descriptions: Washington, D.C., U.S. Department of Agriculture Forest Service, scale 1:7,500,000 (also at URL http://www.fs.fed.us/land/ecosysmgmt/ ecoreg1_home.html).
Barnes, Ivan, 1964, Field measurement of alkalinity and pH: U.S. Geological Survey Water-Supply Paper 1535-H, 17 p.
Brandwein, S.S., and White, R.M., 1983, Surface geologic reconnaissance of Cypress Creek Dome, Perry County, Mississippi: Office of Nuclear Waste Isolation, Battelle Project Management Division, Technical Report ONWI-297, 6 p.
Cosby, B.J., Ryan, P.F., Webb, J.R., Hornberger, G.M., and Galloway, J.N., 1991, Mountains of western Virginia, in Charles, D.F., ed., Acidic deposition and aquatic ecosystems-Regional case studies: New York, Springer- Verlag, p. 297-318.
Durum, W.H., 1978, Historical profile of quality of water laboratories and activities, 1879-1973: U.S. Geological Survey Open-File Report 78-432, 235 p.
Gandl, L.A., and Spiers, C.A., 1980, Results of water quality sampling near Richton, Cypress Creek, and Lampton salt domes, Mississippi: U.S. Geological Survey Open-File Report 80-442, 18 p.
Lawrence, C.L., 1987, Streamflow characteristics at hydrologic bench-mark stations: U.S. Geological Survey Circular 941, 123 p.
Likens, G.E., Bormann, F.H., Pierce, R.S., Eaton, J.S., and Johnson, N.M., 1977, Biogeochemistry of a forested ecosystem: New York, Springer-Verlag, 146 p.
Morse, William C., 1944, Geology and ground-water resources of the Camp Shelby area: Mississippi State Geological Survey Bulletin 58, 72 p.
Spiers, C.A., and Gandl, L.A., 1980, A preliminary report of the geohydrology of the Mississippi salt-dome basin: U.S. Geological Survey Open-File Report 80-595, 45 p.
U.S. Department of Agriculture, 1985, Final environmental impact statement, national forests in Mississippi, land and resource management plan: Forest Service, Southern Region, Mississippi.
U.S. Department of Agriculture, 1994, Final environmental impact statement for military training use of National Forest lands at Camp Shelby, Mississippi: Forest Service, Southern Region, Mississippi.
U.S. Geological Survey, published annually, Water resources data, Mississippi, Pearl: U.S. Geological Survey Water Data Report.
a. U.S. Geological Survey topographic maps:
b. Geologic Maps:
c. Soil surveys:
d. Other maps:
Table B-1. NWIS site identification numbers and site names for water-quality sampling sites.
| Site | Identification Number | Site Name |
| 1 | 02479155 | CYPRESS CR NR JANICE, MISSISSIPPI |
| 2 | 310223089000700 | FAIRCHILD CR NR JANICE, MISSISSIPPI |
| 3 | 310415088590100 | JOES CR NR OAK GROVE, MISSISSIPPI |
| 4 | 310501089011200 | ASHLEY CR NR JANICE, MISSISSIPPI |
| 5 | 310620088582000 | SHUTEYE CR NR BOMBING RANGE NR OAK GROVE, MS |
| 6 | 310542088595200 | SHUTEYE CR AT HWY 29 NR OAK GROVE, MISSISSIPPI |
| 7 | 310621088582100 | BOMBING RANGE TRIB NR OAK GROVE, MISSISSIPPI |
| 8 | 310711089005400 | UPPER CYPRESS CR AT HWY 29 NR NEW AUGUSTA, MS |
| 9 | 310743089015000 | REDHILL BR NR NEW AUGUSTA, MISSISSIPPI |
| 10 | 310801089014500 | SWEETWATER CR NR NEW AUGUSTA, MISSISSIPPI |
| Back to 1173-A Contents |
This page maintained by Nichole Bisceglia.
Last updated July 31, 2000.