
Hydrologic Benchmark Network Stations in the Eastern U.S. 1963-95 (USGS Circular 1173-A)
| Abstract and Map Index | List of all HBN Stations | Introduction to Circular | Analytical Methods |
McDonalds Branch in Lebanon State Forest, New Jersey (Station 01466500)
To download a printer friendly PDF version of this information click here.
This report details one of the approximately 50 stations in the Hydrologic Benchmark Network (HBN) described in the four-volume U.S. Geological Survey Circular 1173. The suggested citation for the information on this page is:
|
All of the tables and figures are numbered as they appear in each circular. Use the navigation bar above to view the abstract, introduction and methods for the entire circular, as well as a map and list of all of the HBN sites. Use the table of contents below to view the information on this particular station.
|
|
| 1. Site Characteristics and Land Use |
| 2. Historical Water Quality Data and Time-Series Trends |
| 3. Synoptic Water Quality Data |
| 4. References and Appendices |
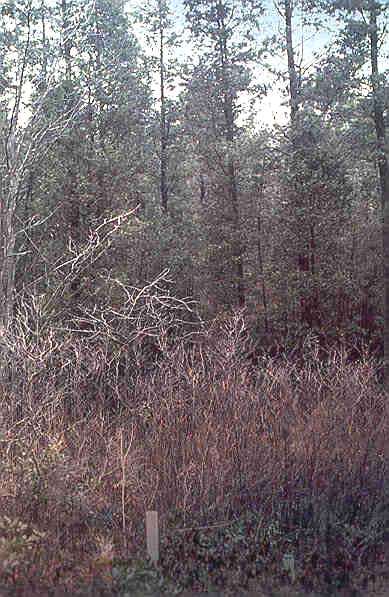 |
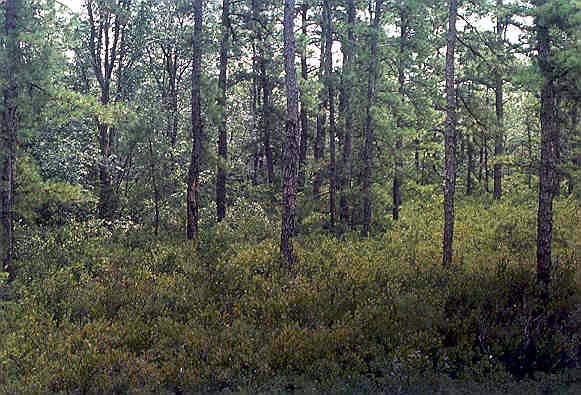
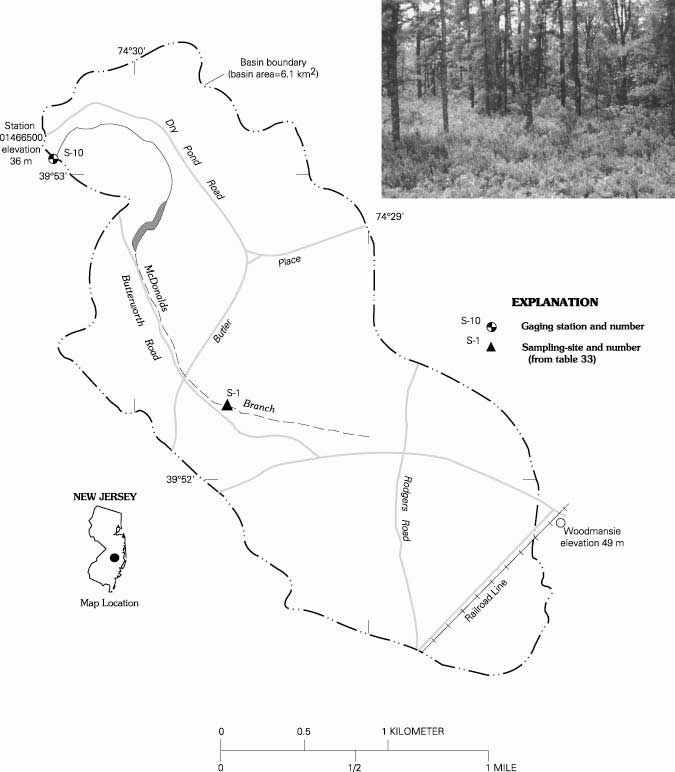
The McDonalds Branch HBN Basin is in the New Jersey Pinelands region, an area encompassing 4,450 km² of gently undulating terrain in the Coastal Plain physiographic province in the southeastern part of New Jersey (Forman, 1979). The basin drains 6.1 km² of forested terrain that ranges in elevation from 36 m to 64 m. The HBN gage is in Lebanon State Forest, 11 km southeast of the town of Browns Mill at latitude 39°53'05'' and longitude 74°30'20'' (Figure 16. Map of the study area in McDonalds Branch Basin and photograph of a typical wooded area in the basin). McDonalds Branch is a first-order stream that eventually flows into the Rancocas Creek tributary of the Delaware River. The 4-km stream channel drains a hardwood swamp in the upper part of the basin and a cedar swamp near the gage. The basin also includes several upland swamp areas that are perched on clay layers in the underlying sediments and are separated from the main stream channel (Johnsson and Barringer, 1993). Streamflow is dominated by ground-water discharge and is fairly constant during the year, with mean monthly discharge ranging from 0.045 m³/s in September to 0.083 m³/s in April. Average annual runoff was 32 cm from 1954 to 1995 (U.S. Geological Survey, Water Resources Data, New Jersey). Average annual precipitation at a nearby weather station was 116 cm between 1951 and 1980 (Johnsson and Barringer, 1993). Estimates of evapotranspiration for the basin range from 45 to 59 percent of annual precipitation, and losses to the regional ground-water system account for 8 to 13 cm annually (Johnsson and Barringer, 1993).
Detailed descriptions of vegetation, soils, and geology in the basin are given in Lord and others (1990). The basin lies in the Eastern Broadleaf Forest (Oceanic) ecoregion (Bailey and others, 1994), and vegetation can be separated into upland and lowland floristic complexes that are determined largely by the position of the water table relative to the ground surface (McCormick, 1955). In the upland complex, which occupies 85 percent of the basin, the ground-water table is generally 60 cm below the ground surface. Vegetation is dominated by mixed pine and oak forests with an understory of scrub oak, black huckleberry, and lowbush blueberry. The remaining 15 percent of the basin is covered by lowland communities that grow in areas where the water table is at or near the ground surface during part of the year. Vegetation in these areas includes transitional pitch-pine forests and cedar swamp, hardwood swamp, and shrubby wetland communities. The distribution of soil types in the basin is determined largely by landscape position (Markley, 1979; Lord and others, 1990). Soils in the upland regions are well-drained Quartzipsamments and Hapludults, and the lowland soils are poorly drained Haploquods, mucks, and peats. In general, soils are sandy, acidic (pH 3.6 to 5.0), and have low cation-exchange capacities (less than 0.5 to 10.5 meq/100 g of soil) (Lord and others, 1990). The sand-silt fraction of soils is dominated by quartz with minor amounts of feldspar and muscovite. The dominant clay mineral is kaolinite, but soils also contain varying amounts of illite, vermiculite, gibbsite, and smectite.
The geology of the Pinelands region consists of a sequence of unconsolidated marine and near-shore sediments of Cretaceous and Tertiary age. The dominant sediment underlying the McDonalds Branch Basin is the Tertiary Cohansey Sand, which is believed to be of deltaic origin (Johnsson and Barringer, 1993). The Cohansey Sand consists of poorly sorted, limonitic quartz sand interbedded with irregularly shaped clay lenses. The sand also contains minor amounts of feldspar, muscovite, ilmenite, chert, and ironstone pebbles. Quaternary alluvial and eolian deposits are present along stream drainages and other undrained depressions in the basin (Lord and others, 1990). Although the Pinelands were unglaciated, continental ice sheets came within 30 km of the region, and tundra and arctic climates probably existed during the late Pleistocene (Rhodehamel, 1979).
The McDonalds Branch Basin is in the east part of Burlington County and is entirely in the boundaries of the Lebanon State Forest. The basin also is in the area referred to as the New Jersey Pinelands, which was designated as a National Reserve in 1978. Land use in the Pinelands is regulated by the Pinelands Commission, which was established by the State legislature in 1979 to balance protection and development interests within the region (Good and Good, 1984). The basin is accessible by way of several public roads that are maintained by the Lebanon State Forest. The Butterworth Road, the only paved road in the basin, enters the basin near the gage and traverses the entire length of the basin roughly parallel to the main drainage. Several gravel roads cross the basin perpendicular to the main drainage. Deicing salts are not used on roads in winter, but Butterworth Road is occasionally plowed.
A detailed description of the history of land use and fire in the McDonalds Branch Basin is in McCormick (1955), from which the following summary of events was taken. The upland forests of the basin were cut at least twice to support the local bog-iron industry in the mid-1800's, and most cedar stands in the basin were cut between 1865 and 1890. At least eight wildfires burned portions of the basin between 1850 and the early 1900's, and the entire basin was burned by a large fire in 1922. Land in the basin was purchased from the Federal Government sometime between 1912 and 1930 and eventually designated as State Forest. During the 1930's, the Civilian Conservation Corps built roads, undertook various forest-stand improvement measures, and planted native and exotic tree species and experimental wildlife food patches in the basin. Between 1930 and 1955, more than one-half of the basin was treated by prescribed burning techniques.
 |
Land use in the basin since the establishment of the HBN station has been limited to recreation (hunting, mountain biking, dog sledding) and prescribed burning. Prescribed burning is used by the State Forest to protect property and maintain forest diversity. Burning in the Lebanon State Forest occurs annually in blocks that range from 20 to 200 ha in size, and portions of the basin are burned at least once every 3 years (Christian Bethman, Lebanon State Forest, oral commun., 1994). The only logging activity is in the southeast corner of the basin near an abandoned railroad line. The McDonalds Branch Basin also has been the site of numerous scientific investigations during the past 40 years and is arguably the most intensively studied area in the Pinelands region (R.A. Zampella, Pinelands Commission, written commun., 1994). The USGS conducted an intensive study in the basin from 1984 to 1988 to improve understanding of hydrogeochemical processes and the effects of acidic deposition on surface-water quality (Lord and others, 1990; Johnsson and Barringer, 1993). Other notable studies in McDonalds Branch include hydrologic studies by Rhodehamel (1970); biogeochemical investigations by Johnson (1979), Swanson and Johnson (1980), Turner and others (1985), Madsen and others (1986), Ryan and Gschwend (1990), and Zampella (1994); and vegetation studies by Wang (1984) and McCormick (1955). A compendium of New Jersey Pinelands literature has been compiled by Gemmell and others (1989).
The data set analyzed for this report includes 247 water-quality samples that were collected from June 1963 through September 1995. Sampling frequency ranged from semiannually to monthly from 1963 through 1975 and bimonthly from 1976 through 1995. As many as 12 additional samples were collected each year during a USGS acidic deposition study in the basin from 1984 through 1989 (Lord and others, 1990). Samples in the early part of the record were analyzed at a USGS laboratory in Philadelphia, Pa., from 1963 through 1967 and a laboratory in Harrisburg, Pa., from 1967 through 1972. After establishment of the Central Laboratory System, samples were analyzed in Atlanta, Ga., from 1973 through 1985 and at the NWQL in Arvada, Colo., from 1986 through 1995. Daily discharge records for McDonalds Branch (station 01545600) are available beginning in October 1953. Daily water temperature and specific conductance were measured at the gage from 1961 through 1992 and 1969 through 1992, respectively. Daily measurements of dissolved oxygen and pH were made with a minimonitor from 1985 through 1992.
Calculated ion balances for 240 samples with complete major ion analyses are shown in Figures 17a and 17b. Temporal variation of discharge, field pH, major ion concentrations, and ion balance at McDonalds Branch, New Jersey. Ion balance ranged from -40 to +40 percent, and only 60 percent of samples had values within the ±10 percent range. This large range of values is not unexpected considering the difficulty in making precise analytical measurements at the low solute concentrations typical of this station. The average charge balance for all samples was 1.4 percent, which agrees with the data of Johnsson and Barringer (1993), who reported a charge balance of 3 percent in monthly samples that were collected at the gage from 1984 through 1988.
 |
Time-series plots were inspected for evidence of method-related effects (fig. 17). Calcium, magnesium, and sodium all had a similar pattern of high data scatter in the first one-half of the record and low scatter in the later one-half of the record. For example, the standard deviation of calcium concentrations was 32 meq/L for the period 1963-83 compared to 12 meq/L for the period 1983-95. This pattern is coincident with a change in the HBN operational protocols documented in OWQ Technical Memorandum No. 82.18 (Office of Water Quality Technical Memorandum No. 82.18, National Water-Quality Networks, issued September 28, 1982, at URL http:// water.usgs.gov/admin/memo/). Beginning in water year 1983, the analytical method for major cations and trace inorganic constituents was changed from AA spectroscopy to ICP spectroscopy. Based on this information, it seems plausible that the temporal patterns in these cations reflect a difference in the precision of these two analytical methods rather than a real change in stream-water chemistry. A similar pattern was observed in the sulfate concentrations, which showed a noticeable reduction in data scatter beginning in 1990. This pattern is coincident with a change in the analytical method to ion chromatography in 1990. At least three different methods were used to analyze sulfate prior to 1990. The turbidimetric technique, used at the NWQL between March 1986 and December 1989, was known to overestimate sulfate concentrations in dilute waters, and the effect was commonly most pronounced in colored waters (Office of Water Quality Technical Memorandum No. 90.04, Turbidimetric Sulfate Method, issued December 21, 1989, at URL http://water.usgs.gov/admin/memo/). A positive bias also was noted by Johnsson and Barringer (1993), who observed that sulfate concentrations in samples analyzed by this technique were more likely to be overestimated in samples with high concentrations of DOC. Assuming the ion chromatographic determinations are unbiased, these results indicate that the analytical methods used prior to 1982 may have introduced a positive bias as well.
Median concentrations and ranges of major constituents in stream water collected at the HBN gaging station and VWM concentrations in wet precipitation collected in the basin from 1985 to 1987 (Johnsson and Barringer, 1993) are listed in table 30. Precipitation chemistry in the basin was dilute and acidic with a VWM pH of 4.3 for 3 years of record. The dominant cations in precipitation were hydrogen, sodium, and ammonium, which contributed 53, 20, and 15 percent, respectively, of the total cation charge. Sulfate was the dominant anion, accounting for 48 percent of the anion charge, and chloride and nitrate each accounted for 26 percent. The results indicate that precipitation at McDonalds Branch probably is a mixture of both strong acids derived from anthropogenic emissions of sulfur and nitrogen compounds and salt derived from marine aerosols.
[Concentrations in units of microequivalents per liter, discharge in cubic meters per second, specific conductance in microsiemens per centimeter at 25 degrees Celsius, aluminum, iron, and silica in micromoles per liter, and dissolved organic carbon in milligrams per liter; n, number of stream samples; VWM, volume-weighted mean; inst., instantaneous; spec. cond., specific conductance at 25 degrees Celsius; <, less than: --, not reported]
| Parameter | Stream Water | Precipitation VMAa | |||||
| Minimum | First quartile | Median | Third quartile | Maximum | n | ||
| Discharge, inst. | 0.02 | 0.04 | 0.05 | 0.07 | 3.4 | 235 | -- |
| Spec. cond., field | 20 | 34 | 45 | 60 | 120 | 242 | -- |
| pH, field | 3.2 | 4.0 | 4.2 | 4.4 | 6.0 | 242 | 4.3 |
| Calcium | 10 | 20 | 30 | 45 | 170 | 245 | 5.0 |
| Magnesium | 8.0 | 25 | 33 | 42 | 120 | 244 | 4.8 |
| Sodium | 48 | 70 | 78 | 87 | 150 | 242 | 19 |
| Potassium | <2.0 | 5.1 | 5.1 | 10 | 46 | 238 | 1.3 |
| Aluminum, dissolved | <.4 | 3.0 | 5.9 | 8.9 | 22 | 153 | -- |
| Iron, dissolved | .8 | 2.0 | 3.0 | 4.7 | 30 | 176 | -- |
| Sulfate | 6.0 | 73 | 120 | 170 | 420 | 246 | 46 |
| Chloride | 56 | 90 | 99 | 110 | 230 | 244 | 25 |
| Nitrite plus nitrate | <.7 | <3.6 | <7.1 | <7.1 | 13 | 200 | 26b |
| Silica | 23 | 51 | 62 | 70 | 110 | 238 | -- |
| Dissolved organic carbon | .5 | 2.9 | 5.6 | 8.0 | 20 | 139 | -- |
a Values are volume-weighted mean concentrations for 01/85—03/86 and 12/86—11/87 (Lord and others, 1990).
b Nitrate only.
Stream water in McDonalds Branch is very dilute and acidic. The median pH of stream water was 4.2, which was slightly lower than the pH of precipitation. The major cations in stream water were sodium and hydrogen, and the major anions were sulfate and chloride. Low concentrations of weathering-derived constituents, particularly calcium, magnesium, and alkalinity, reflect the lack of carbonates and other weatherable minerals in the quartz-rich soils and sediments. The relatively high stream-water concentrations of sodium and chloride relative to precipitation probably are because of dry deposition of marine-derived aerosols because inputs from road salt and bedrock weathering are negligible. The high sulfate concentrations and low pH values suggest that stream acidity is at least partially derived from strong acids in precipitation. Stream waters also may be naturally acidic because of the presence of organic acids. Johnsson and Barringer (1993) reported dissolved organic carbon (DOC) concentrations between 3.8 and 12 mg/L in McDonalds Branch. The relatively high concentrations of dissolved aluminum and iron in stream water probably also are related to the high concentrations of DOC.
The solute composition of stream water was further evaluated by analyzing correlations between solutes and stream discharge (table 31). Discharge was strongly correlated with silica (rho = -0.741) and positively correlated with aluminum (rho = 0.672), iron (rho = 0.502), and DOC (rho = 0.762). Among the ions, the strongest correlations were found between aluminum and DOC (rho = 0.820) and iron and DOC (rho = 0.716). Johnsson and others (1993) found similar relationships and suggested that variations in stream chemistry were controlled largely by hydrology. During low flow, streamflow is primarily derived from ground-water discharge that is rich in dissolved silica because of weathering in the subsurface. With increasing flows, a larger percentage of streamflow is derived from shallow subsurface flow that is enriched in aluminum, iron, and DOC because of the interactions with wetland vegetation and soils.
[Q, discharge; Ca, calcium; Mg, magnesium; Na, sodium; K, potassium; Al, Aluminum; Fe, Iron; SO4, sulfate; Cl, chloride; Si, silica; DOC, dissolved organic carbon]
| Q | pH | Ca | Mg | Na | K | Al | Fe | Cl | SO4 | Si | |
| pH | -0.608 | ||||||||||
| Ca | .398 | -0.489 | |||||||||
| Mg | -.004 | -.301 | 0.739 | ||||||||
| Na | -.243 | -.173 | .495 | 0.734 | |||||||
| K | -.364 | .072 | .323 | .488 | 0.472 | ||||||
| Al | .672 | -.661 | .554 | .169 | .088 | -0.104 | |||||
| Fe | .502 | -.215 | .003 | -.389 | -.460 | -.413 | 0.492 | ||||
| Cl | -.035 | -.144 | .068 | .135 | .216 | .032 | .169 | 0.129 | |||
| SO4 | .317 | -.634 | .568 | .532 | .435 | .228 | .444 | -.242 | 0.118 | ||
| Si | -.741 | .499 | -.159 | .157 | .351 | .493 | -.481 | -.446 | .187 | -0.211 | |
| DOC | .762 | -.576 | .285 | -.118 | -.261 | -.355 | .820 | .716 | .103 | .189 | -0.620 |
Results of the seasonal Kendall test for trends in discharge and major dissolved constituents are shown in table 32. A statistically significant downward trend was detected in calcium concentrations at the 0.01 probability level, which was similar for the unadjusted and flow-adjusted concentrations. The LOWESS curve in figure 17 reveals that most of the decline in calcium concentrations occurred prior to 1983, and concentrations have remained relatively constant since then. The downward trend in calcium may be attributed to the change in analytical method discussed previously. Statistically significant trends were not detected when the trend test was applied separately to the periods before [-1.5 (meq/L)/yr, p = 0.101] and after [<0.1 (meq/L)/yr, p = 0.947] 1983, inferring that the trend is an analytical artifact. In contrast to this study, trends in stream-water pH at McDonalds Branch have been reported in earlier investigations. Johnson (1979) reported a downward trend in pH of 0.02 pH units per year (p = 0.05) from 1963 through 1978. Although Johnson (1979) attributed the trend to atmospheric deposition of strong acids, the increase in hydrogen ion was not balanced by a corresponding increase in stream-water sulfate or nitrate. Morgan (1984) conducted a followup study of pH trends at McDonalds Branch and found no significant long-term decline in pH at the site. However, Morgan (1984) did observe several short-term trends that were attributed to natural causes other than acidic deposition.
[Trends in units of microequivalents per liter per year, except discharge in cubic meters per second per year, pH in standard units per year, aluminum, iron, and silica in micromoles per liter per year; <, less than;--, not calculated]
| Parameter | Unadjusted | Flow adjusted | ||
| Trend | p-value | Trend | p-value | |
| Discharge | <-0.01 | 0.029 | -- | -- |
| pH, field | <.01 | .944 | <0.01 | 0.191 |
| Calcium | -1.3 | .000 | -1.1 | .000 |
| Magnesium | <.1 | .781 | (b) | -- |
| Sodium | <.1 | .831 | -.1 | .622 |
| Potassium | <.1 | .909 | (b) | -- |
| Aluminum, dissolved | -.1a | .469 | -.1a | .057 |
| Iron, dissolved | <.1 | .218 | <.1a | .042 |
| Sulfate | -1.1 | .101 | -.1 | .784 |
| Chloride | <.1 | .789 | (b) | -- |
| Silica | .2 | .045 | <-.1 | .750 |
a Trend calculated for 1982-95.
b Flow model not significant at a = 0.10.
 |
Synoptic samples were not collected in the McDonalds Branch Basin as part of this study because surface-water samples were collected at 10 sites in the basin during an intensive USGS acidic deposition study in the late 1980's (Johnsson and Barringer, 1993). Locations and results of chemical analyses of all 10 sites can be found in Lord and others (1990). Table 33 lists the chemistry data from two sites along the main channel; S-10, located in a cedar swamp at the gage, and S-1, an upstream site located in a hardwood swamp (fig. 16). In general, the concentrations of the major dissolved constituents calcium, sodium, magnesium, sulfate, chloride, and silica at the downstream site are similar to or slightly larger than concentrations at the upstream sampling site. In contrast, concentrations of DOC, aluminum, and iron were 4 to 10 times larger at the upstream site than at the downstream site. In addition, monthly samples from the upstream site had an average cation excess of 20 percent compared to only 3 percent at the gage (S-10). Johnsson and Barringer (1993) suggested that the chemical differences in waters collected at these two sites are due largely to differences in hydrology between the upper and lower areas of the basin. Stream water in the upland areas is derived primarily from a shallow, subsurface reservoir perched on layers of clay within the sand, whereas flow at the gage is derived from a deeper ground-water system that is recharged by precipitation in the upland areas of the basin.
[Site locations shown in fig. 16; mS/cm, microsiemens per centimeter at 25 degrees Celsius; meq/L, microequivalents per liter; mmol/L, micromoles per liter; mg/L, milligrams per liter]
| Parameter | Cedar swamp (S-10) | Hardwood swamp (S-1) |
| Number of samples | 12 | 12 |
| pH, field | 4.1 | 3.9 |
| Specific conductance (mS/cm) | 62 | 91 |
| Calcium (meq/L) | 31 | 24 |
| Magnesium (meq/L) | 40 | 22 |
| Sodium (meq/L) | 83 | 87 |
| Potassium (meq/L) | 7.7 | 3.3 |
| Aluminum (mmol/L) | 9.6 | 37 |
| Iron (mmol/L) | 3.0 | 30 |
| Sulfate (meq/L) | 250 | 200 |
| Chloride (meq/L) | 100 | 110 |
| Silica (mmol/L) | 60 | 63 |
| Dissolved organic carbon (mg/L) | 7.7 | 32 |
1Data from table 9 in Johnsson and Barringer (1993).
Bailey, R.G., Avers, P.E., King, T., and McNab, W.H., eds., 1994, Ecoregions and subregions of the United States with supplementary table of map unit descriptions: Washington, D.C., U.S. Department of Agriculture Forest Service, scale 1:7,500,000 (also at URL http://www.fs.fed.us/land/ecosysmgmt/ ecoreg1_home.html).
Forman, R.T., 1979, Pine Barrens-Ecosystem and landscape: New York, Academic Press, 601 p.
Gemmell, D.J., Good, N.F., and Good, R.E., 1989, Compendium of New Jersey Pine Barrens literature: New Brunswick, N.J., Rutgers University, Division of Pinelands Research, Center for Coastal and Environmental Studies, 221 p.
Good, R.E., and Good, N.F., 1984, The Pinelands National Reserve-An ecosystem approach to management: BioScience, v. 34, no. 3, p. 169-173.
Johnson, A.H., 1979, Acidification of headwater streams in the New Jersey Pine Barrens: Journal of Environmental Quality, v. 8, no. 3, p. 383-386.
Johnsson, P.A., and Barringer, J.L., 1993, Water quality and hydrogeochemical processes in McDonalds Branch basin, New Jersey Pinelands, 1984-1988: U.S. Geological Survey Water-Resources Investigations Report 91-4081, 111 p.
Lord, D.G., Barringer, J.L., Johnsson, P.A., Schuster, P.A., Walker, R.L., Fairchild, J.E., Sroka, B.N., and Jacobsen, Eric, 1990, Hydrogeochemical data from an acidic deposition study at McDonalds Branch basin in the New Jersey Pinelands, 1983-1986: U.S. Geological Survey Open-File Report 88-500, 124 p.
Madsen, E.L., Morgan, M.D., and Good, R.E., 1986, Simultaneous photoreduction and microbial oxidation of iron in a stream in New Jersey Pinelands: Limnology and Oceanography, v. 31, no. 4, p. 832-838.
Markley, M.L., 1979, Soil series of the Pine Barren, in Forman, R.T.T., Pine Barrens-Ecosystem and landscape: New York, Academic Press, p. 81-93.
McCormick, J.S., 1955, A vegetation inventory of two watersheds in the New Jersey Pine Barrens: New Brunswick, N.J., Rutgers University, Ph.D. dissertation, 125 p.
Morgan, M.D., 1984, Acidification of headwater streams in the New Jersey Pinelands-A re-evaluation: Limnology and Oceanography, v. 29, no. 6, p. 1259-1266.
Rhodehamel, E.C., 1979, Geology of the Pine Barrens of New Jersey, in Forman, R.T.T., Pine Barrens-Ecosystem and landscape: New York, Academic Press, p. 39-58.
Ryan, J.N., and Gschwend, P.M., 1990, Colloid mobilization in two Atlantic Coastal Plain aquifers: Water Resources Research, v. 26, no. 2, p. 307-322.
Swanson, K.A., and Johnson, A.H., 1980, Trace metal budgets for a forested watershed in the New Jersey Pine Barrens: Water Resources Research, v. 16, no. 2, p. 373-376.
Turner, R.S., Johnson, A.H., and Wang, D., 1985, Biogeochemistry of aluminum in McDonalds Branch watershed, New Jersey Pine Barrens: Journal of Environmental Quality, v. 14, no. 3, p. 314-323.
U.S. Geological Survey, published annually, Water resources data, New Jersey, Trenton: U.S. Geological Survey Water Data Report.
Wang, Deane, 1984, Fire and nutrient dynamics in a pine-oak forest ecosystem in the New Jersey Pine Barrens: New Haven, Conn., Yale University, Ph.D. dissertation, 217 p.
Zampella, R.A., 1994, Characterization of surface water quality along a watershed disturbance gradient: Water Resources Bulletin, v. 30, no. 4, p. 605-611.
a. U.S. Geological Survey topographic maps:
b. Geologic maps:
c. Soil surveys
d. Other maps:
Table B-1. NWIS site identification numbers and site names for water-quality sampling sites.
| Site | Identification Number | Site Name |
| S-10 | 01466500 | MCDONALDS BRANCH IN LEBANON STATE FOREST, NJ |
| S-1 | 395216074294000 | S-1 NEW JERSEY |
| Back to 1173-A Contents |
This page maintained by Nichole Bisceglia.
Last updated July 31, 2000.