
Hydrologic Benchmark Network Stations in the Eastern U.S. 1963-95 (USGS Circular 1173-A)
| Abstract and Map Index | List of all HBN Stations | Introduction to Circular | Analytical Methods |
Cataloochee Creek near Cataloochee, North Carolina (Station 03460000)
To download a printer friendly PDF version of this information click here.
This report details one of the approximately 50 stations in the Hydrologic Benchmark Network (HBN) described in the four-volume U.S. Geological Survey Circular 1173. The suggested citation for the information on this page is:
|
All of the tables and figures are numbered as they appear in each circular. Use the navigation bar above to view the abstract, introduction and methods for the entire circular, as well as a map and list of all of the HBN sites. Use the table of contents below to view the information on this particular station.
|
|
| 1. Site Characteristics and Land Use |
| 2. Historical Water Quality Data and Time-Series Trends |
| 3. Synoptic Water Quality Data |
| 4. References and Appendices |
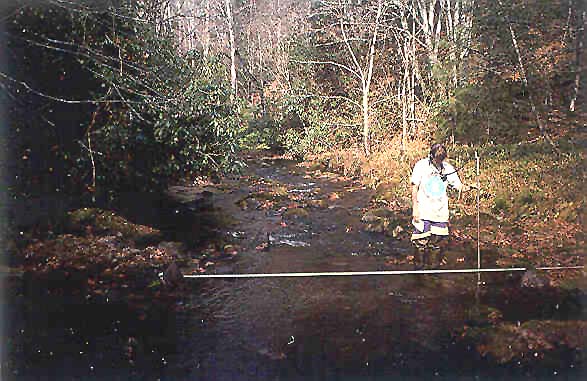
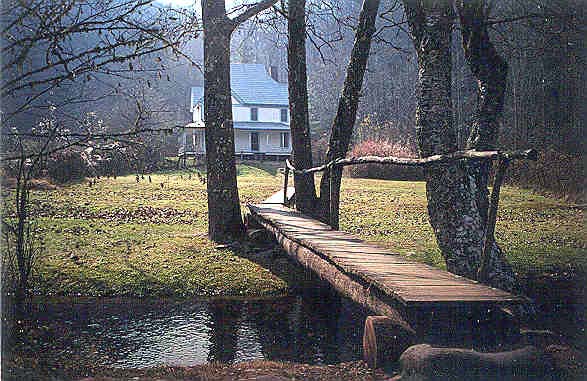
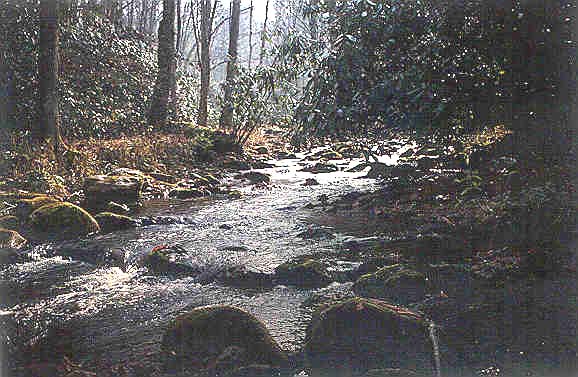
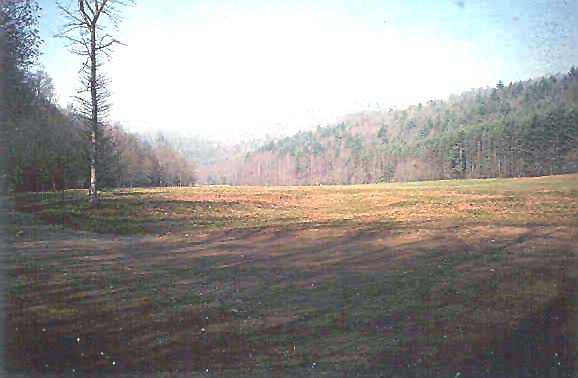
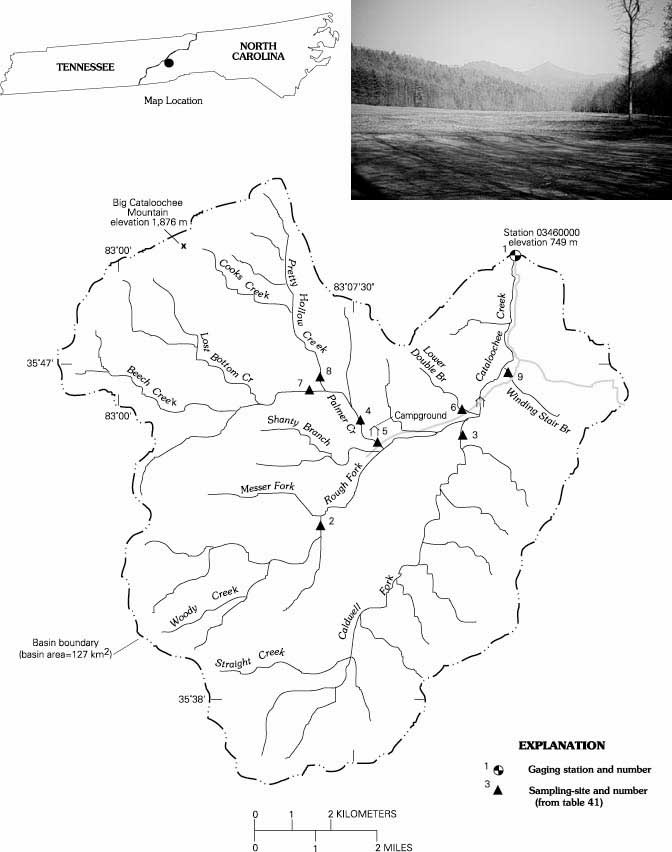
The Cataloochee Creek HBN Basin is in the eastern one-half of Great Smoky Mountains National Park (GSMNP) in the Blue Ridge physiographic province in western North Carolina (Figure 20. Map of the study area in the Cataloochee Creek Basin and photograph of a maintained opening along the valley floor). The basin drains 127 km² of steep, mountainous terrain that ranges in elevation from 749 m at the gage to 1,876 m
 |
Detailed descriptions of forest vegetation in GSMNP can be found in Arends (1981) and MacKenzie (1993). The basin lies in the Central Appalachian Broadleaf Forest ecoregion (Bailey and others, 1994) and is covered by hardwood-hemlock forest types at elevations below 1,450 m. The most common tree species are red maple, yellow poplar, black locust, white oak, black oak, sweet birch, and hemlock with lesser amounts of white pine, shortleaf pine, pitchpine, dogwood, and sumac. Rosebay rhododendron and mountain laurel are locally abundant as a dense understory. Although most hardwoods represent second-growth forests, Pyle (1985) has mapped large virgin hardwood stands in the Caldwell Fork and Woody Creek subdrainages. Above 1,450 m, vegetation is dominated by red spruce and Fraser fir forests that are locally interrupted by beech stands and open areas covered by mountain laurel and blueberries. Recently there has been widespread dieback of the Fraser fir owing to the attack of the wooly aphid (Eagar, 1984). Most soils in the basin are classified as Inseptisols and are described as fairly deep, well-drained soils developed in residuum weathered from the underlying bedrock (Feldman and others, 1991). Chemically, the soils are acidic (pH 4.1 to 5.8) and have a low organic content and low cation-exchange capacity (Daniels and others, 1987). Aluminum generally dominates the exchange complex, which is almost entirely derived from the organic matter. The mineralogy of the sand and silt fraction is dominated by quartz, mica, and feldspar, and the clay fraction is dominated by regularly interstratified mica/vermiculite, smectite, kaolinite, and gibbsite.
Bedrock in the eastern part of GSMNP consists of a thick mass of variably metamorphosed sedimentary rocks of late Precambrian age. At higher elevations, the Cataloochee Creek Basin is underlain primarily by the Thunderhead Sandstone, which consists of a thick-bedded feldspathic sandstone that forms extensive cliffs and numerous waterfalls. At lower elevations, the Roaring Fork Sandstone and Longarm Quartzite are the dominant bedrock units. The Roaring Fork Sandstone is described as a highly feldspathic sandstone interbedded with dark siltstones. The Longarm Quartzite consists of a clean, coarse-grained, feldspathic quartzite and arkose. All bedrock units in the basin are mineralogically similar and are composed primarily of detrital quartz, potassium feldspar, and plagioclase and metamorphic biotite, muscovite, and chlorite. Carbonate minerals are found only in trace amounts in most rocks with the exception of occasional carbonate layers in the Roaring Fork Sandstone. Pyrite is present in trace amounts in the Roaring Fork Sandstone but is absent in the Thunderhead Sandstone. Bedrock in many areas of the basin is covered by saprolite locally as much as 30 m thick. Complete descriptions of GSMNP geology can be found in King (1968) and Hadley and Goldsmith (1963).
The Cataloochee Creek Basin drains the western part of Haywood County, N.C., and is entirely in the boundaries of GSMNP. The basin is in the eastern one-half of GSMNP and is accessible by two low-speed gravel roads that enter the basin from the northeast. Road access in the basin is limited primarily to the valley floor. Foot and equestrian trails allow access to headwater areas of the basin. Several trailheads along the western basin divide are accessible from roads outside the basin boundary.
 |
Although most land in GSMNP is currently protected, substantial landscape disturbance owing to logging, farming, and fire occurred in the park prior to its establishment (Pyle, 1985; Lambert, 1957; Lambert, 1960). The Cataloochee Creek Basin was settled by Europeans in the 1830's, and disturbance was limited primarily to farming activities and selective logging along the valley floor. The early 1900's was the most intense period of human disturbance when large stands of timber were harvested by corporate logging companies. Although logging companies penetrated much of the park, forests in many areas of the Cataloochee Creek Basin were never cut and represent some of the largest remaining virgin timber stands in the Eastern United States (Pyle, 1985). Almost 700 residents lived in the Cataloochee Valley when GSMNP was established in 1934, but they were no longer allowed to farm or raise animals. The last residents left the valley by the early 1940's, and most of the structures were burned in order to return the valley to a wilderness state (Powers, 1974).
The current management objectives of GSMNP are to restore and preserve the natural environment and are described in detail in the parks general management plan (U.S. Department of the Interior, 1988). The Cataloochee Creek Basin is in a relatively isolated region and receives considerably less tourist traffic than other road-accessible areas of the park. The valley bottom is currently designated as a historic district, and several pioneer structures, rustic wooden fences, and large open meadows that are maintained to reproduce the early pioneer setting. Permits are occasionally granted to local farmers to harvest hay in the open meadows; however, grazing is not allowed (Wayne Williams, National Park Service, oral commun., 1996). The Cataloochee Creek Basin is most popular as a base camp for equestrian backcountry trips. A 35-site campground with a septic system and well is along the main channel just downstream from the confluence with Caldwell Fork, and a horse camp containing stables and a shelter is near the confluence with Palmer Creek. The park also maintains a ranger station, bunk house, and small maintenance building in the valley.
Owing to the wide diversity of natural resources in GSMNP, the park has become an important research area for studying environmental impacts on terrestrial and aquatic ecosystems (Nodvin and others, 1993). A complete bibliography of scientific research in the park has been compiled by Nodvin and others (1993) and is available in digital form at URL http://funnelweb.utcc.utk.edu/~nodvin/smoky.html. Air pollution is currently one of the biggest problems facing both natural resources and visitors in the park, and consequently, GSMNP has one of the most comprehensive air-quality-monitoring programs in the National Park system. The current monitoring system includes nine weather stations, three atmospheric deposition sites, and seven air- quality-monitoring stations (Jim Renfro, National Park Service, oral commun., 1996). The National Park Service also monitors the water quality of several streams in the park, including an intensively monitored site at the headwaters of Noland Creek, about 25 km west of the Cataloochee Creek Basin (Jim Renfro, oral commun., 1996).
The data set analyzed for this report includes 161 water-quality samples that were collected from October 1967 through August 1995. Sampling frequency ranged from monthly to bimonthly from 1968 through 1982 and quarterly from 1983 through 1995. Eleven samples were collected in 1963, before the site was added to the HBN. Although not documented, water-quality samples in the early part of the record probably were analyzed at a USGS laboratory in Raleigh, N.C., which was operated until 1973 (Durum, 1978). After the establishment of the USGS Central Laboratory System, samples were analyzed at the Atlanta laboratory from 1973 through 1985 and at the NWQL in Arvada, Colo., from 1986 though 1995. Daily discharge records for Cataloochee Creek (station 03460000) are available from October 1933 through September 1952 and after October 1962. Daily water temperature and specific conductance were measured at the gage from October 1962 through September 1986 and May 1974 through September 1986, respectively. Daily precipitation amount was measured at the gage from November 1990 through February 1996.
Calculated ion balances for 164 samples with complete major ion analyses are shown in Figures 21a and 21b. Temporal variation of discharge, field pH, major ion concentrations, and ion balance at Cataloochee Creek, North Carolina. Ion balances ranged from -30 to +34 percent, and about 55 percent of samples had values outside of the ±10 percent range. This large range of values reflects the difficulty in making precise analytical measurements at the low solute concentrations typical of this station. The average charge balance for all samples was -7.0, and 77 percent had negative ion balances, indicating an excess of measured anions over cations in solution. As mentioned previously, the apparent anion excess may be due to an overestimation of laboratory alkalinity by the fixed endpoint titration to pH 4.5 (Office of Water Quality Technical Memorandum No. 80.27, New Parameter Codes for pH, Alkalinity, Specific Conductance, and Carbonate/ Bicarbonate, issued September 19, 1980, at URL http://water.usgs.gov/admin/memo/). For waters with low alkalinities, the endpoint pH is closer to 5.0, and titration to pH 4.5 may overestimate alkalinity by as much as 25 meq/L (Barnes, 1964). Alkalinities also were measured by incremental titration in the field beginning in 1987. A comparison of the two alkalinity determinations shows that the fixed endpoint concentrations were, on average, 20 meq/L larger than the incremental titration concentrations, indicating that the alkalinity is a reasonable explanation for the negative ion balances.
 |
Time-series plots of the major dissolved constituents were inspected for evidence of method-related effects (fig. 21). Several notable patterns were found at the Cataloochee Creek gaging station. For example, uncharacteristically high calcium concentrations were evident during the period 1974 through 1976. The only documented analytical or procedural change during this period was the introduction of a polypropylene churn splitter for compositing and splitting samples that was required for use at all HBN stations beginning in water year 1977 (Office of Water Quality Technical Memorandum No. 76.24-T, Sample Splitter for Water-Sediment Samples, issued August 16, 1976, at URL http://water.usgs.gov/admin/memo/). Although problems with previous sample splitters were not documented by the Office of Water Quality (OWQ), the fact that the anomalous pattern disappeared around the beginning of 1977 indicates that previous splitters or compositing devices may have been a potential source of contamination. Figure 21 also reveals a period of elevated sulfate concentrations during the late 1980's. This pattern coincides with the use of a turbidimetric titration for sulfate analysis at the NWQL between March 1986 and December 1989 (Fishman and others, 1994). In 1989, the NWQL determined that sulfate concentrations can be over-estimated by this technique and changed the method to ion chromatography in 1990 (Office of Water Quality Technical Memorandum No. 90.04, Turbidimetric Sulfate Method, issued December 21, 1989, at URL http://water.usgs.gov/admin/memo/). The bias was most pronounced in dilute waters, although it was not consistent among samples and appeared to be affected by factors such as color and turbidity (Schertz and others, 1994).
The time-series plot of field pH reveals a sudden increase in pH at the beginning of 1975 followed by a steady decrease through the 1980’s and another sudden increase near the beginning of 1993. These patterns may, in part, be explained by changes in instrumentation used by field personnel. Some instrument-electrode systems are known to give erroneous readings, particularly when measuring pH in low-conductivity waters (Office of Water Quality Technical Memorandum No. 81.08, Electrodes for pH Measurement in Low-Conductivity Waters, issued February 10, 1981, at URL http://water.usgs.gov/admin/memo/). Unfortunately, changes in field methods were not well documented, which complicates verification of analytical bias, particularly in the earlier records. Beginning in 1981, laboratory pH is available for comparison. Poor agreement between the two pH measurements during this period of record indicates that the decline in pH in the late 1980's probably is because of analytical error in the field. The sudden increase in pH in 1993 is coincident with a change in the pH electrode type (refillable to gel-filled) used by the field personnel at this station (Gene Barker, U.S. Geological Survey, oral commun., 1996).
Median concentrations and ranges of major constituents in stream water collected at the HBN gaging station and VWM concentrations in wet-only deposition measured at the Elkmont NADP station about 35 km east of the basin are presented in table 38. Atmospheric deposition of sulfate, nitrate, and hydrogen in the Southern Blue Ridge is among the highest reported in the Eastern United States (Elwood and others, 1991). The VWM pH of wet precipitation measured at the Elkmont NADP station was 4.5 for 15 years of record. The dominant cations in precipitation were hydrogen, which contributed 63 percent of the total cation charge, and ammonium, which contributed 20 percent. The dominant anions were sulfate and nitrate, which accounted for 65 and 29 percent of the total anions, respectively.
[Concentrations in units of microequivalents per liter, discharge in cubic meters per second, specific conductance in microsiemens per centimeter at 25 degrees Celsius, pH in standard units, and silica in micromoles per liter; n, number of stream samples; VWM, volume-weighted mean; inst., instantaneous; spec. cond., specific conductance; <, less than; --, not reported]
| Parameter | Stream water | Precipitation VMAa | |||||
| Minimum | First quartile | Median | Third quartile | Maximum | n | ||
| Discharge, inst. | 0.62 | 1.4 | 2.1 | 3.7 | 46 | 159 | -- |
| Spec. cond., field | 10 | 14 | 15 | 16 | 25 | 161 | -- |
| pH, field | 5.1 | 6.1 | 6.4 | 6.9 | 8.0 | 159 | 4.5b |
| Calcium | 10 | 45 | 50 | 60 | 180 | 161 | 4.5 |
| Magnesium | 8.2 | 25 | 26 | 33 | 91 | 161 | 1.4 |
| Sodium | 17 | 44 | 48 | 52 | 87 | 161 | 2.7 |
| Potassium | 2.6 | 13 | 15 | 18 | 41 | 161 | .9 |
| Ammonium | <.7 | <.7 | <.7 | 2.1 | 11 | 101 | 10 |
| Alkalinity, laboratory | 20 | 100 | 110 | 140 | 220 | 161 | -- |
| Sulfate | 4.2 | 18 | 26 | 42 | 100 | 155 | 34 |
| Chloride | <2.8 | 14 | 17 | 23 | 56 | 155 | 3.1 |
| Nitrite plus nitrate | <7.1 | 9.3 | 11 | 14 | 26 | 111 | 15c |
| Silica | 17 | 115 | 125 | 140 | 170 | 161 | -- |
aValues are volume-weighted mean concentrations for 1980—94.
bLaboratory pH.
cNitrate only.
Stream water in Cataloochee Creek is dilute and weakly buffered: specific conductances ranged from 10 to 25 µS/cm and alkalinities generally were below 140 meq/L. The major cations in stream water were calcium and sodium, and alkalinity was the dominant anion. The low concentrations of the weathering-derived solutes, particularly alkalinity, reflect the slow-weathering sandstones and quartzites in the underlying bedrock. The median chloride concentration in stream water was 17 meq/L, which is about 5.5 times larger than the VWM concentrations of chloride in precipitation. Based on the difference between average annual runoff and precipitation, evapotranspiration can account for about a twofold increase
 |
The solute composition of stream water was further evaluated by analyzing correlations between solutes and stream discharge (table 39). Most weathering-derived constituents, particularly silica, had negative correlations with discharge. These correlations are consistent with a hydrologic system where weathering-enriched base flow is diluted by waters from shallow or surficial sources during periods of increased discharge. Among the ions, the strongest correlations were found between sodium and silica (r = 0.634) and calcium and alkalinity (rho = 0.539). These correlations suggest that weathering of carbonate cements and detrital feldspars in the sandstones and quartzites is an important process that controls the composition of surface waters. The atmospherically derived solutes sulfate, chloride, and nitrite plus nitrate were poorly correlated with the weathering-derived constituents except for a weak inverse correlation between nitrate and silica (rho = -0.525). This correlation may indicate that stream-water silica is controlled by weathering processes in the deeper ground-water system, whereas stream-water nitrogen is controlled by biological processes in the shallow soil environment.
[Q, discharge; Ca, calcium; Mg, magnesium; Na, sodium; K, potassium; Alk, alkalinity; SO4, sulfate; Cl, chloride; N, nitrite plus nitrate; Si, silica]
| Q | pH | Ca | Mg | Na | K | Alk | SO4 | Cl | N | |
| pH | -0.028 | |||||||||
| Ca | -.559 | -0.258 | ||||||||
| Mg | -.561 | .003 | 0.453 | |||||||
| Na | -.658 | -.018 | .510 | 0.328 | ||||||
| K | -.109 | -.239 | .470 | .109 | 0.160 | |||||
| Alk | -.636 | .105 | .539 | .444 | .518 | 0.203 | ||||
| SO4 | -.159 | -.333 | .299 | .245 | .332 | .370 | -0.001 | |||
| Cl | -.066 | -.142 | .152 | .133 | -.013 | .065 | -.096 | 0.153 | ||
| N | .402 | -.165 | -.190 | .052 | -.382 | .056 | -.313 | -.019 | -0.073 | |
| Si | -.712 | .079 | .454 | .264 | .634 | .155 | .627 | -.012 | -.106 | -0.525 |
Results of the seasonal Kendall test for trends in discharge and major dissolved constituents from 1967 through 1995 are presented in table 40. Statistically significant trends were detected in sulfate, chloride, and nitrite plus nitrate at the 0.01 confidence level. Results for the flow-adjusted concentrations were similar to the unadjusted concentrations, indicating that variations in discharge were not driving the observed trends in stream chemistry. The LOWESS curves in figure 21 show that most of the increase in sulfate concentrations occurred prior to 1990, although the pattern probably is influenced somewhat by analytical bias during the late 1980's. The nitrite plus nitrate record begins in 1974 and shows a pattern of gradually increasing concentrations between 1978 and 1995. The upward trend in stream-water sulfate may be linked to increases in atmospheric sulfate deposition in the Southeast since the 1960's (Husar and others, 1991) and is consistent with the observed increases in stream-water sulfate concentrations at the nearby Coweeta Hydrologic Laboratory in North Carolina (Swank and Waide, 1988). The Coweeta streams also had downward trends in alkalinity and base cations, whereas no trends were detected for these constituents in Cataloochee Creek. The upward trend in nitrite plus nitrate is consistent with the hypothesis that many high-elevation streams in GSMNP are reaching an advanced stage of nitrogen saturation owing to the cumulative effects of atmospheric nitrogen deposition (Flum and Nodvin, 1995). Although the increase in nitrite plus nitrate in Cataloochee Creek has been relatively small [0.2 (meq/L)/yr], with continued high rates of nitrogen deposition, the area of nitrogen saturation may begin to move downslope and have an increasing effect on nitrogen concentrations at the gage (Flum and Nodvin, 1995).
[Trends in units of microequivalents per liter per year, except discharge in cubic meters per second per year, pH in standard units per year, and silica in micromoles per liter per year; <, less than; --, not calculated]
| Parameter | Unadjusted | Flow adjusted | ||
| Trend | p-value | Trend | p-value | |
| Discharge | <0.01 | 0.726 | -- | -- |
| pH, field | .01 | .218 | 0.01 | 0.237 |
| Calcium | <.1 | .803 | <.1 | .859 |
| Magnesium | <.1 | .759 | <-.1 | .824 |
| Sodium | <.1 | .363 | .1 | .022 |
| Potassium | <.1 | .134 | <.1 | .174 |
| Alkalinity, laboratory | <.1 | .486 | -.1 | .637 |
| Sulfate | .6 | .002 | .7 | .002 |
| Chloride | -.2 | .009 | -.2 | .006 |
| Nitrite plus nitrate | .2a | .007 | .2 | .009 |
| Silica | -.1 | .422 | -.1 | .379 |
a Trend calculated for 1973-95.
Results of the surface-water synoptic sampling of October 31, 1991, are presented in table 41; locations of sampling sites are shown in figure 20. Discharge at the gage was 1.16 m³/s compared to the median daily discharge of 1.50 m³/s for October (Lawrence, 1987), indicating that the basin was sampled during base-flow conditions for that time of year. Solute concentrations measured at the gage (site 1) during the synoptic sampling were generally between the median and third-quartile concentrations reported for the gage during the entire period of record (table 38). All tributary streams were similar in composition to the gage, with calcium and sodium the dominant cations and alkalinity the dominant anion. Ion balances ranged from 1.7 to 14 percent, indicating that unmeasured organic anions may have been an important component of stream water during the sampling period.
[Site locations shown in fig. 20; Q, discharge in cubic meters per second; SC, specific conductance in microsiemens per centimeter at 25 degrees Celsius; pH in standard units; Ca, calcium; Mg, magnesium; Na, sodium; K, potassium; Alk, alkalinity; SO4, sulfate; Cl, chloride; NO3, nitrate; concentrations in microequivalents; Si, silica in micromoles per liter; <, less than; --, not measured]
| Site | Station number | Q | SC | pH | Ca | Mg | Na | K | Alk | SO4 | Cl | NO3 | Si | Criteriaa | Remarks |
| 1 | 03460000 | 1.16 | 17 | 6.95 | 55 | 26 | 65 | 17 | 110 | 21 | 12 | <0.7 | 140 | -- | -- |
| 2 | 353623083074400 | .12 | 18 | 6.83 | 60 | 32 | 65 | 15 | 93 | 27 | 14 | 17 | 130 | MT | Virgin hardwood forest |
| 3 | 353744083051900 | .45 | 16 | 6.93 | 48 | 25 | 61 | 16 | 97 | 21 | 14 | <.7 | 140 | MT | Virgin hardwood forest |
| 4 | 353746083070100 | .34 | 14 | 6.89 | 45 | 21 | 57 | 15 | 89 | 21 | 12 | <.7 | 120 | LU | Upstream from horse camp |
| 5 | 353752083051800 | .62 | 17 | 7.02 | 55 | 27 | 65 | 15 | 110 | 21 | 12 | <.7 | 130 | LU | Downstream from horse camp |
| 6 | 353802083050600 | .017 | 18 | 6.90 | 43 | 21 | 78 | 26 | 130 | 13 | 10 | <.7 | 210 | BG | Roaring Fork Sandstone |
| 7 | 353820083075100 | .23 | 13 | 6.82 | 40 | 21 | 52 | 14 | 76 | 19 | 14 | <.7 | 110 | BG | Thunderhead Sandstone |
| 8 | 353831083074400 | .091 | 13 | 6.72 | 39 | 20 | 52 | 14 | 64 | 19 | 13 | 9.0 | 100 | BG | Thunderhead Sandstone |
| 9 | 353844083043100 | .025 | 22 | 6.97 | 75 | 46 | 74 | 24 | 140 | 29 | 15 | <.7 | 180 | BG | Walden Creek Group |
a Criteria used in selection of sampling sites: BG = bedrock geology, MT = major tributary, LU = land use.
Most spatial variability in water chemistry in the basin was measured in the weathering-derived constituents, particularly alkalinity and silica. Since the basin is underlain by similar rock types, these spatial patterns may reflect local variations in the mineralogic composition of the different sedimentary units. For example, the somewhat elevated concentrations of calcium, magnesium, and alkalinity at site 9 probably reflects the presence of limestone and dolomite layers in the Walden Creek Group, which crops out in this subbasin. Spatial patterns in stream chemistry also may reflect basin characteristics other than geology. Silsbee and Larson (1982; 1983) analyzed stream chemistry throughout GSMNP and found substantial gradients in concentration with elevation with smaller concentrations of alkalinity, sodium, potassium, and silica at higher elevations. This pattern was attributed to higher flushing rates because of greater precipitation, and slower chemical weathering rates because of lower temperatures at higher elevations (Silsbee and Larson, 1982). Similar inverse relations with elevation were found for the same constituents in this study (r = -0.511 to -0.728), suggesting that elevation explains most of the spatial variation in weathering-derived constituents. By contrast, variability in the atmospherically derived components was relatively small. For example, chloride concentrations ranged from 12 to 15 meq/L and sulfate ranged from 13 to 29 meq/L. Nitrate concentrations were below the detection limit of 0.7meq/L at 9 of the 11 sites sampled. These nitrate concentrations were lower than the long-term median concentration at the gage (table 38), which may reflect the time of year the samples were collected. Silsbee and Larson (1982) observed that stream-water nitrate concentrations in GSMNP varied seasonally, with the highest concentrations in winter and spring and the lowest concentrations in autumn. The authors suggested that low autumn concentrations result from uptake of nitrogen by microorganisms during the initial stages of leaf fall.
Arends, Ernesto, 1981, Vegetation patterns a half century following the chestnut blight in the Great Smoky Mountains National Park: Knoxville, University of Tennessee, Master's thesis, 79 p.
Bailey, R.G., Avers, P.E., King, T., and McNab, W.H., eds., 1994, Ecoregions and subregions of the United States with supplementary table of map unit descriptions: Washington, D.C., U.S. Department of Agriculture Forest Service, scale 1:7,500,000 (also at URL http://www.fs.fed.us/land/ecosysmgmt/ ecoreg1_home.html).
Barnes, Ivan, 1964, Field measurement of alkalinity and pH: U.S. Geological Survey Water-Supply Paper 1535-H, 17 p.
Cosby, B.J., Ryan, P.F., Webb, J.R., Hornberger, G.M., and Galloway, J.N., 1991, Mountains of western Virginia, in Charles, D.F., ed., Acidic deposition and aquatic ecosystems-Regional case studies: New York, Springer- Verlag, p. 297-318.
Daniels, W.L., Zelazny, L.W., and Everett, C.J., 1987, Virgin hardwood forest soils of the Southern Appalachian Mountains-II, Weathering, mineralogy, and chemical properties: Soil Science Society of America, v. 51, p. 730-738.
Eagar, Christopher, 1984, Review of the biology and ecology of the balsam wooly aphid in Southern Appalachian spruce-fir forests: U.S. Department of the Interior, National Park Service, Southeast Regional Office, Research/ Resource Management Report SER-71, p. 36-50.
Elwood, J.W., Sale. M.J., and Kaufman, P.R., 1991, The Southern Blue Ridge Province, in Charles, D.F., ed., Acidic deposition and aquatic ecosystems-Regional case studies: New York, Springer-Verlag, p. 319-364.
Durum, W.H., 1978, Historical profile of quality of water laboratories and activities, 1879-1973: U.S. Geological Survey Open-File Report 78-432, 235 p.
Feldman, S.B., Zelazny, L.W., and Baker, J.C., 1991, High-elevation forest soils of the Southern Appalachians-II, Geomorphology, pedogenesis, and clay mineralogy: Soil Science Society of America, v. 55, p. 1782-1791.
Flum, T., and Nodvin, S.C., 1995, Factors affecting stream-water chemistry in the Great Smoky Mountains, USA: Water, Air, and Soil Pollution, v. 85, p. 1707-1712.
Hadley, J.B., and Goldsmith, R.M., 1963, Geology of the eastern Great Smoky Mountains, North Carolina and Tennessee: U.S. Geological Survey Professional Paper 349-B, 118 p.
Husar, R.B., Sullivan, T.J., and Charles, D.F., 1991, Historical trends in atmospheric sulfur deposition and methods for assessing long-term trends in surface water chemistry, in Charles, D.F., ed., Acidic deposition and aquatic ecosystems-Regional case studies: New York, Springer-Verlag, p. 48-92.
King, P.B., 1968, Geology of the Great Smoky Mountains National Park Tennessee and North Carolina: U.S. Geological Survey Professional Paper 587.
Lambert, R.S., 1957, The pioneer history of the Great Smoky Mountains National Park: Great Smoky Mountains National Park, report to the superintendent, 96 p.
Lambert, R.S., 1960, Logging in the Great Smoky Mountains: Great Smoky Mountains National Park, report to the superintendent, 65 p.
Lawrence, C.L., 1987, Streamflow characteristics at hydrologic bench-mark stations: U.S. Geological Survey Circular 941, 123 p.
MacKenzie, M.D., 1993, The vegetation of Great Smoky Mountains National Park-Past, present, and future: Knoxville, University of Tennessee, Ph.D. dissertation, 154 p.
Nodvin, S.C., Rigel, J.S., and Twigg, S.M., 1993, An indexed reference database of the Great Smoky Mountains, North Carolina and Tennessee: National Park Service, Southeastern Region, Technical Report NPS/SERGRSM/NRTR-93/08, NPS-D-413, p. 156.
Nodvin, S.C., Van Miegroet, H., Lindberg, S.E., Nicholas, N.S., and Johnson, D.W., 1995, Acidic deposition, ecosystem processes, and nitrogen saturation in a high elevation southern Appalachian watershed: Water, Air, and Soil Pollution, v. 85, p. 1647-1652.
Powers, E.D., 1974, Cataloochee-A sense of place: National Parks and Conservation Magazine, December, p. 10-14.
Pyle, Charlotte, 1985, Vegetation disturbance history of Great Smoky Mountains National Park-An analysis of archival maps and records: U.S. Department of the Interior, National Park Service, Southeast Region, Research/Resource Management Report SER-77, 69 p.
Shanks, R.E., 1954, Climates of the Great Smoky Mountains: Ecology, v. 35, p. 354-361.
Silsbee, D.G., and Larson, G.L., 1982, Water quality of streams in the Great Smoky Mountains National Park: Hydrobiologia, v. 89, p. 97-115.
Schertz, T.L., Wells, F.C., and Ohe, D.J., 1994, Sources of trends in water-quality data for selected streams in Texas, 1975-89 water years: U.S. Geological Survey Water-Resources Investigation 94-4213, 49 p.
Swank, W.T., and Waide, J.B., 1988, Characterization of baseline precipitation and stream chemistry and nutrient budgets for control watersheds, in Swank, W.T., and Crossley, D.A., eds., Forest hydrology and ecology at Coweeta: New York, Springer-Verlag, p. 57-79.
U.S. Department of the Interior, 1988, Final environmental impact statement for the general management plan, Great Smoky Mountain National Park, North Carolina-Tennessee: National Park Service, Denver Service Center.
U.S. Geological Survey, published annually, Water resources data, North Carolina, Raleigh: U.S. Geological Survey Water Data Report.
a. U.S. Geological Survey topographic maps:
b. Geologic maps:
c. Soil surveys
d. Other maps:
Table B-1. NWIS site identification numbers and site names for water-quality sampling sites.
| Site | Identification Number | Site Name |
| 1 | 03460000 | CATALOOCHEE CREEK NEAR CATALOOCHEE NC |
| 2 | 353623083074400 | ROUGH FORK |
| 3 | 353744083051900 | CALDWELL FORK NEAR NELLIE |
| 4 | 353746083070100 | PALMER CREEK AT NELLIE |
| 5 | 353752083051800 | PALMER CREEK AT CAMPGROUND NEAR NELLIE |
| 6 | 353802083050600 | LOWER DOUBLE BRANCH NEAR NELLIE |
| 7 | 353820083075100 | PALMER CREEK AB PRETTY HOLLOW NEAR NELLIE |
| 8 | 353831083074400 | PRETTY HOLLOW NEAR NELLIE |
| 9 | 353844083043100 | WINDING STAIR BRANCH NEAR NELLIE |
| Back to 1173-A Contents |
This page maintained by Nichole Bisceglia.
Last updated July 31, 2000.