
Hydrologic Benchmark Network Stations in the Eastern U.S. 1963-95 (USGS Circular 1173-A)
| Abstract and Map Index | List of all HBN Stations | Introduction to Circular | Analytical Methods |
Upper Three Runs near New Ellenton, South Carolina (Station 02197300)
To download a printer friendly PDF version of this information click here.
This report details one of the approximately 50 stations in the Hydrologic Benchmark Network (HBN) described in the four-volume U.S. Geological Survey Circular 1173. The suggested citation for the information on this page is:
|
All of the tables and figures are numbered as they appear in each circular. Use the navigation bar above to view the abstract, introduction and methods for the entire circular, as well as a map and list of all of the HBN sites. Use the table of contents below to view the information on this particular station.
|
|
| 1. Site Characteristics and Land Use |
| 2. Historical Water Quality Data and Time-Series Trends |
| 3. Synoptic Water Quality Data |
| 4. References and Appendices |
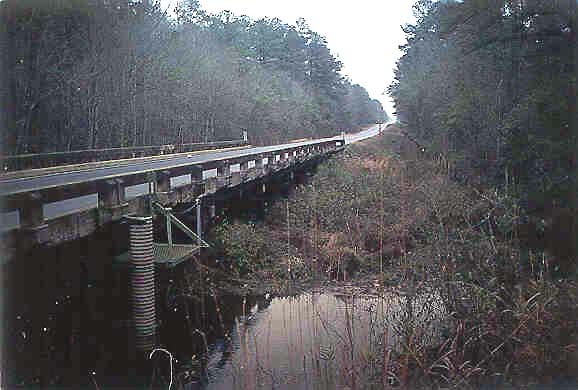
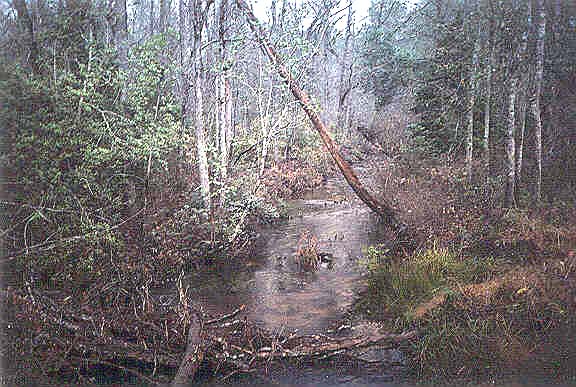
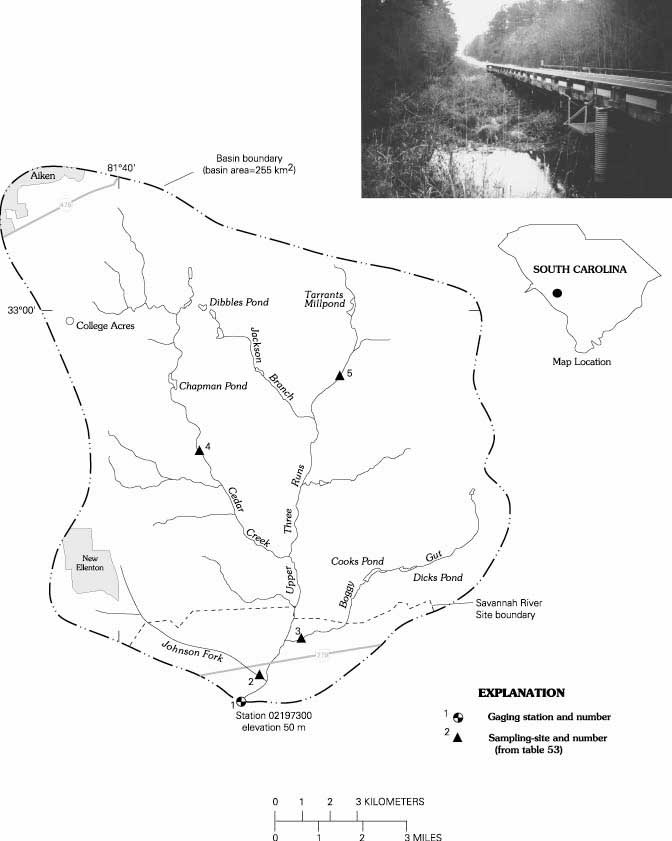
The Upper Three Runs HBN Basin is in the Aiken Plateau region of the Coastal Plain physiographic province in southern South Carolina (Figure 26. Map showing study area in the Upper Three Runs Basin and photograph of the stream channel at the gage). The 255-km² basin drains an area characterized by broad upland ridges separated by narrow, steep- sided stream valleys that range in elevation from 50 to 155 m. The USGS gaging station is 7.2 km southeast of New Ellenton, S.C., in the boundaries of the Savannah River Site (SRS) at latitude 33°22'14'' and longitude 81°37'43''. Upper Three Runs is a southwest-flowing tributary of the Savannah River with a channel length of about 18 km upstream from the gage and an average stream gradient of 3.9 m/km. Streamflow is strongly controlled by ground-water discharge, and mean monthly discharge varies over a narrow range from 2.74 in October to 3.25 m³/s in March. Average annual runoff from the basin was 36 cm from 1966 through 1994 (U.S. Geological Survey, Water Resources Data, South Carolina). Meteorological data have been collected at the SRS since the early 1960's (Hunter, 1990). Climate of the area is characterized by warm, humid summers and mild winters. Average daily temperatures range from 7.5°C in January to 27.1°C in July. Precipitation averages 120 cm annually and is generally largest in March and least in November (Hunter, 1990). At a nearby study area in the SRS, evapotranspiration returned 70 percent of incoming precipitation to the atmosphere (Dennehy and others, 1988).
 |
The basin lies along the margin of the Outer Coastal Plain Mixed Forest ecoregion (Bailey and others, 1994) and is covered by both hardwood and pine forest types. Hardwoods in upland areas are dominated by turkey oak, blackjack oak, and white oak; the lowland hardwood communities are dominated by bald cypress, sweet gum, water gum, yellow poplar, and laurel. Most of the pine forests are plantations that were planted in previously farmed or logged areas. The major pine species are loblolly pine, longleaf pine, and slash pine. A detailed description of the forest community types in the SRS can be found in Jones and others (1981). Most soils in the basin are classified as Ultisols and are mapped in the Blanton-Lakeland soil association (Rogers, 1990). These soils are developed in sandy and loamy marine sediments and are found on broad ridgetops and side slopes of the plateau surface. Because of their high sand content, the soils are well drained, acidic (pH 3.5 to 4.5), and have low base saturation capacities (9 to 27 percent) (Ruhe and Matney, 1980). Soils along the flood plains are subject to frequent flooding during the wet season and are mapped in the Pickney Series (Rogers, 1990). These soils are poorly drained, acidic (pH 3.6 to 5.5), and have a high organic content. A typical soil profile contains a surface layer of black sand as much as 90 cm thick overlying a gray to brown sandy subsoil down to 150 cm (Rogers, 1990). The dominant minerals in both the upland and lowland soil types are quartz, feldspar, kaolinite, and interlayered chlorite-vermiculite (Ruhe and Matney, 1980).
 |
The basin is underlain by flat-lying sediments of the Cretaceous Tuscaloosa Formation and Tertiary Huber, Congaree, McBean, and Barnwell Formations (Siple, 1967; Prowell, 1994). The Tuscaloosa Formation, which crops out along the stream channels, consists of fluvial andestuarine sediments assumed to be derived from weathered crystalline rocks of the Piedmont. The sediments are described as light-colored, arkosic sands, composed primarily of quartz, feldspar, and muscovite, interlayered with lenses of light-colored clay and kaolin (Cooke, 1936). Tertiary sediments cover most of the upland areas of the basin. These sediments were deposited in an open-marine environment and are composed of poorly sorted quartz sand with beds of calcareous clay, sandy limestone, and marl (Prowell, 1994). The Tuscaloosa Formation forms the principal aquifer in the area and is recharged through the overlying rocks of Tertiary age in the upland areas around Aiken (Langley and Marter, 1973).
The Upper Three Runs Basin drains the southern part of Aiken County. Ninety percent of land in the basin is privately owned and 10 percent is in the boundaries of the SRS. The SRS is currently operated by the Westinghouse Corporation for the U.S. Department of Energy as a natural environmental research park that constitutes the largest protected natural area in the Eastern United States (Cohn, 1984). Several primary and secondary roads provide access to most areas in the basin. Access to the main channel is limited to bridge crossings because of swampy conditions along the flood plain. Security clearance is necessary to access the gage and areas of the basin in the SRS.
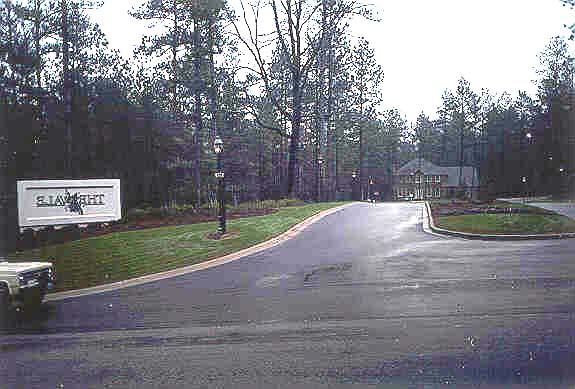
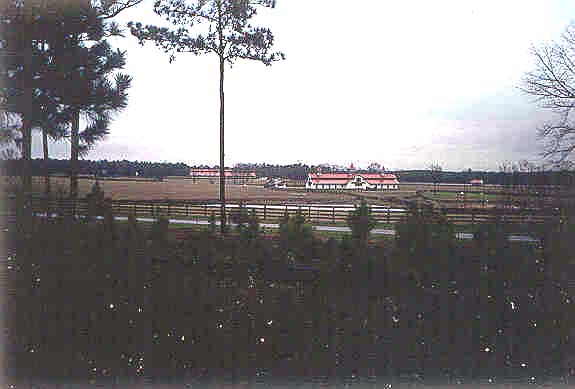
Current (1997) land use in the basin is 78 percent forest, 12 percent agriculture, and 10 percent residential (David Howe, Natural Resources Conservation Service, oral commun., 1996). Past disturbance and years of poor management have resulted in poor timber quality throughout the area (Jones and others, 1981). About two-thirds of the agricultural land is used for pasture and one-third is planted in corn and soybeans. Most of the residential communities are in and around the communities of New Ellenton (population 2,520) and Aiken (population 19,870), which is only partly in the basin. A substantial land-use change in the basin has been the recent growth in suburban residential communities. Although the basin is currently only 10 percent residential, this could increase to 30 percent during the next 5 years if the current rate of growth is sustained (David Howe, oral commun., 1996). Other manmade features in the basin include 3 sewage- treatment facilities, a fiberglass plant and waste pond, several large equestrian farms, and more than 20 livestock ponds. Residents in the basin use ground water from the Tuscaloosa Formation as their primary domestic water supply. The southernmost 10 percent of the basin is in the boundaries of the SRS and is protected from future development.
The HBN data set analyzed for this report includes 153 water-quality samples that were collected from November 1967 through September 1993, when the site was removed from the HBN. Sampling frequency ranged from bimonthly to monthly from 1968 through 1982 and quarterly from 1983 through 1993. Although not documented, water-quality samples in the early part of the record probably were analyzed at a USGS laboratory in Raleigh, N.C., which was operated until 1973 (Durum, 1978). After establishment of the USGS Central Laboratory System, samples were analyzed at the Central Laboratory in Atlanta, Ga., from 1973 through 1985 and at the NWQL in Arvada, Colo., from 1986 though 1993. Daily discharge records for Upper Three Runs (station 02197300) are available beginning in June 1966. The gage was situated along Highway 278 until September 1989, when it was moved 1.6 km downstream primarily for safety reasons (Frank Melendez, U.S. Geological Survey, oral commun., 1996). Water-quality samples continued to be collected at the old gage site until sampling was suspended in 1993. Daily precipitation amount was measured at the gage from April 1992 through February 1996.
 |
Calculated ion balances for 147 samples with complete major ion analyses are shown in Figures 27a and 27b. Temporal variation of discharge, field pH, major ion concentrations, and ion balance at Upper Three Runs, South Carolina. Ion balances ranged from -29 to +29 percent, and almost 50 percent of samples had values outside the ±10 percent range. This wide range of values reflects the difficulty in making precise analytical measurements at the low solute concentrations typical of this station. The average charge balance for all samples was -6.2 percent, and 70 percent had negative ion balances, indicating an excess of measured anions over cations in solution. Laboratory alkalinity was determined by a fixed-endpoint titration to pH 4.5. For waters with alkalinities below 100 meq/L, however, the endpoint pH is closer to 5.0, and titration to pH 4.5 may overestimate alkalinity by as much as 25 meq/L (Barnes, 1964). Alkalinity was determined by incremental titration in the field beginning in 1987. A comparison of the incremental alkalinity concentrations with the fixed-endpoint laboratory concentrations shows that the field alkalinities were, on average, 17 meq/L smaller than the laboratory alkalinities. This discrepancy is similar to the average anion excess of 18 meq/L, indicating that the laboratory alkalinity is a probable cause of the negative ion balances.
Time-series plots of the major dissolved constituents were inspected for evidence of analytical-related influences (fig. 27). For example, several uncharacteristically high calcium concentrations were noted from 1974 through 1976. Interestingly, a similar pattern of high calcium concentrations also was observed at the Wild River station in Maine during the same period of record. Because samples from these two sites were analyzed at different laboratories during this period, it seems likely that high calcium concentrations may be related to collection or processing procedures common to both stations. The only documented procedural change during this period was the introduction of a polypropylene churn splitter for compositing and splitting samples that was required for use at all HBN stations beginning in water year 1977 (Office of Water Quality Technical Memorandum No. 76.24-T, Sample Splitter for Water-Sediment Samples, issued August 16, 1976, at URL http://water.usgs.gov/admin/memo/). Although problems with previous sample splitters were not documented by the Office of Water Quality (OWQ), the fact that the anomalous pattern disappeared around the beginning of 1977 indicates that previous splitters or compositing devices may have been a potential source of contamination. Figure 27 also shows a period of elevated sulfate concentrations during the late 1980's. This pattern coincides with the use of a turbidimetric titration for sulfate analyses at the NWQL between March 1986 and December 1989 (Fishman and others, 1994). In 1989, the NWQL determined that sulfate concentrations could be overestimated by this technique and changed the method to ion chromatography in 1990 (Office of Water Quality Technical Memorandum No. 90.04, Turbidimetric Sulfate Method, issued December 21, 1989, at URL http://water.usgs.gov/admin/memo/). The time-series plots in figure 27 also reveal potential bias in the field pH measurements. Between 1983 and 1985, field pH values were 0.5 to 1 pH unit smaller than values typically reported for this station. Interestingly, a similar shift in field pH also was observed at the other South Carolina HBN station, Scape Ore Swamp, during the same period of record. As suggested for the Scape Ore Swamp Station, a probable cause of this shift was the gel-filled pH probe used by field personnel to make pH measurements at these two stations (John Barton, U.S. Geological Survey, oral commun., 1996). Some instrument-electrode systems are known to give erroneous readings when measuring pH in low-conductivity waters, and the electrode is commonly the critical component (Office of Water Quality Technical Memorandum No. 81.08, Electrodes for pH Measurement in Low-Conductivity Waters, issued February 10, 1981, at URL http://water.usgs.gov/admin/memo/).
Median concentrations and ranges of major constituents in stream water collected at the HBN gaging station and VWM concentrations in wet-only deposition measured at the Santee National Wildlife Refuge NADP station about 100 km east of the basin are presented in table 50. Precipitation chemistry at the NADP station was dilute and acidic and had a VWM pH of 4.6 during the 10 years of record. The dominant cations in precipitation were hydrogen, which contributed 45 percent of the total cation charge, and sodium, which contributed 18 percent. Sulfate accounted for 54 percent of the total anions, and nitrate and chloride each accounted for 23 percent. These results indicate that precipitation at the NADP station probably is a mixture both of anthropogenic emissions of sulfur and nitrogen compounds, which cause acid rain, and salt derived from marine aerosols.
Concentrations in units of microequivalents per liter, discharge in cubic meters per second, specific conductance in microsiemens per centimeter at 25 degrees Celsius, pH in standard units, and silica in micromoles per liter; n, number of stream samples; VWM, volume-weighted mean; inst., instantaneous; spec. cond., specific conductance; <, less than; --, not reported]
| Parameter | Stream Water | Precipitation VMAa | |||||
| Minimum | First quartile | Median | Third quartile | Maximum | n | ||
| Discharge, inst. | 1.8 | 2.6 | 3.4 | 4.0 | 6.5 | 151 | -- |
| Spec. cond., field | 10 | 13 | 14 | 15 | 22 | 152 | -- |
| pH, field | 4.5 | 5.5 | 5.7 | 5.9 | 7.3 | 152 | 4.6b |
| Calcium | 5.0 | 20 | 25 | 33 | 120 | 152 | 4.5 |
| Magnesium | <8.2 | 25 | 25 | 33 | 53 | 153 | 3.0 |
| Sodium | 8.7 | 52 | 61 | 70 | 150 | 153 | 10 |
| Potassium | <2.6 | 5.1 | 7.7 | 7.7 | 33 | 151 | 2.3 |
| Ammonium | <.7 | <.7 | 1.4 | 2.8 | 9.3 | 54 | 5.6 |
| Alkalinity, laboratory | <20 | 40 | 40 | 61 | 140 | 152 | -- |
| Sulfate | <4.2 | 16 | 21 | 36 | 110 | 147 | 29 |
| Chloride | 5.6 | 56 | 62 | 68 | 100 | 153 | 12 |
| Nitrite plus nitrate | <7.1 | 13 | 15 | 16 | 22 | 92 | 12c |
| Silica | 6.7 | 110 | 120 | 120 | 140 | 153 | -- |
a Values are volume-weighted mean concentrations for 1984-94.
b Laboratory pH.
c Nitrate only.
Stream water in Upper Three Runs is extremely dilute and weakly buffered; total ionic constituents ranged from 185 to 457 meq/L, and alkalinities were generally below 60 meq/L. The major ions in stream water were sodium and chloride, which accounted for almost one-half of
 |
The solute composition of stream water was further evaluated by analyzing correlations between solutes and stream discharge (table 51). Discharge was poorly correlated with all the major dissolved constituents. Solutes in stream water also were poorly correlated with each other. The lack of correlation among these parameters probably is related to both hydrologic and geochemical factors. The highly permeable soils and sediments on the hillslopes and upland surfaces allow precipitation to infiltrate quickly into the ground-water system. In turn, streamflow is supplied by ground-water discharge, which maintains a relatively constant flow rate and stream composition throughout the year. Additionally, the quartz-rich soils and sediments contain few weatherable minerals and, as a consequence, produce soil and ground waters that are not significantly different in composition from that of the incoming precipitation.
[Q, discharge; Ca, calcium; Mg, magnesium; Na, sodium; K, potassium; Alk, alkalinity; SO4, sulfate; Cl, chloride; Si, silica]
| Q | pH | Ca | Mg | Na | K | Alk | SO4 | Cl | |
| pH | -0.106 | ||||||||
| Ca | .026 | -0.201 | |||||||
| Mg | .227 | -.389 | 0.346 | ||||||
| Na | -.019 | -.025 | .054 | 0.138 | |||||
| K | -.344 | .037 | .152 | .026 | -0.167 | ||||
| Alk | .224 | .336 | -.108 | -.094 | -.032 | -0.359 | |||
| SO4 | -.221 | -.147 | .074 | .244 | .248 | .173 | -0.201 | ||
| Cl | -.210 | -.174 | .129 | -.044 | -.085 | .189 | -.310 | 0.088 | |
| Si | -.078 | -.069 | -.186 | .004 | .239 | .038 | -.165 | .161 | -0.042 |
Results of the seasonal Kendall test for trends in discharge and major dissolved constituents from 1968 through 1993 are shown in table 52. Statistically significant trends were observed for discharge and sodium concentrations at the 0.01 confidence level. The upward trend in sodium was similar for the unadjusted and flow-adjusted concentrations, indicating that the trend was not driven by the downward trend in stream discharge. The LOWESS curve in figure 27 shows that most of the sodium increase occurred in the late 1970's, and concentrations have remained fairly constant since then. The cause of the trend in sodium is not known. Although human activities might be a likely cause, most of the increase in residential development occurred since 1990 during which time sodium concentrations remained relatively constant. The relatively constant chloride concentrations provide additional evidence that land use was not the cause of the sodium trend because it is unlikely that human activities would affect sodium concentrations without affecting chloride concentrations as well. It is perhaps more likely that the increase in sodium was caused by an analytical-related factor, although there were no documented changes in the analytical procedure for sodium during this period of record.
[Trends in units of microequivalents per liter per year, except discharge in cubic meters per second per year, pH in standard units per year, and silica in micromoles per liter per year; <, less than; --, not reported]
| Parameter | Unadjusted | Flow adjusted | ||
| Trend | p-value | Trend | p-value | |
| Discharge | -0.05 | 0.000 | -- | -- |
| pH, field | .00 | .273 | (a) | -- |
| Calcium | <.1 | .860 | (a) | -- |
| Magnesium | <.1 | .298 | 0.2 | 0.069 |
| Sodium | .9 | .000 | .5 | .000 |
| Potassium | <.1 | .349 | (a) | -- |
| Chloride | -.2 | .021 | (a) | -- |
| Sulfate | .4 | .095 | (a) | -- |
| Nitrite plus nitrate | <.1b | .934 | -- | -- |
| Alkalinity, laboratory | <.1 | .065 | (a) | -- |
| Silica | -.2 | .048 | (a) | -- |
a Flow model not significant at a = 0.10.
b Trend calculated for 1974-93, using a trend test for censored data.
Results of the surface-water synoptic sampling of January 9, 1991, are shown in table 53; locations of sampling sites are shown in figure 26. Discharge at the gage was 2.46 m³/s compared to the median daily discharge of 3.12 m³/s for January (Lawrence, 1987), indicating that the basin was sampled during base-flow conditions for that time of year. Solute concentrations measured at the gage (site 1) were similar to the median concentrations reported at the gage during the entire period of record, with the exception of alkalinity (table 50). All tributary streams were similar in chemical composition to the gage; specific conductances were low, and sodium and chloride were the dominant ions. Measured alkalinities were below the reporting limit at three of the five sampling sites, and pH ranged from 4.42 to 6.04, indicating that most surface waters were slightly acidic. The source of most stream-water acidity probably was organic acids, although some may have been derived from strong acids in precipitation. Although DOC was not measured in this study, all samples had positive ion balances (range 1.7 to 14 percent), indicating that organic anions were an important component of stream water during the sampling period.
[Site locations shown in fig. 26; Q, discharge in cubic meters per second; SC, specific conductance in microsiemens per centimeter at 25 degrees Celsius; pH in standard units; Ca, calcium; Mg, magnesium; Na, sodium; K, potassium; Alk, alkalinity; SO4, sulfate; Cl, chloride; NO3, nitrate; concentrations in microequivalents; Si, silica in micromoles per liter; <, less than; --, not measured]
| Site | Station number | Q | SC | pH | Ca | Mg | Na | K | Alk | SO4 | Cl | NO3 | Si | Criteriaa | Remarks |
| 1 | 02197300 | 2.46 | 14 | 5.59 | 25 | 26 | 52 | 7.4 | <10 | 19 | 59 | 15 | 110 |
|
|
| 2 | 332304081370600 | .003 | 24 | 4.42 | 12 | 18 | 52 | 1.8 | <10 | 27 | 62 | <0.7 | 110 | LU | Small town in headwaters |
| 3 | 332330081361500 | .23 | 21 | 6.04 | 65 | 41 | 61 | 12 | 39 | 46 | 70 | 13 | 110 | LU, BG | Ponds, McBean Formation |
| 4 | 332629081380100 | .34 | 14 | 5.76 | 19 | 22 | 61 | 7.4 | 16 | 10 | 65 | 15 | 130 | LU | Residential development |
| 5 | 332838081351700 | .40 | 12 | 5.57 | 14 | 26 | 52 | 6.9 | <10 | 7.9 | 54 | 19 | 100 | LU | Primarily forested |
a Criteria used in selection of sampling sites: BG = bedrock geology, LU = land use.
In general, stream-water chemistry did not vary markedly among the sampling sites in the basin. For example, chloride ranged from 54 to 70 meq/L and sodium varied from 52 to 61 meq/L. In addition, sodium and chloride concentrations were not elevated at sites 2 and 4, which are downstream from large residential areas. This indicates that these two solutes are derived primarily from atmospheric sources and behave relatively conservatively in the basin. Slightly elevated concentrations of calcium, magnesium, and alkalinity were measured in Boggy Gut (site 3) compared to the other sites. These elevated concentrations may be because of the presence of limestone layers and calcareous sands in the Tertiary McBean Formation that crops out along the stream channel in the lower reach of this tributary (Prowell, 1994). Nitrate concentrations ranged from less than 0.7 to 19 meq/L and were not elevated in sub basins with residential development (sites 2 and 4) compared to the undeveloped subbasins (sites 3 and 5). Sulfate concentrations, which showed slightly more variability than chloride and nitrate, ranged from 7.9 meq/L near the headwaters of the main drainage (site 5) to 46 meq/L in Boggy Gut (site 3). As noted previously, sulfate is primarily derived from atmospheric sources but is strongly retained in the basin. One explanation for the variability in sulfate concentrations is that it reflects basin characteristics that control sulfate retention or example, variations in soil mineralogy or, perhaps, the distribution of wetlands in the basin.
Bailey, R.G., Avers, P.E., King, T., and McNab, W.H., eds., 1994, Ecoregions and subregions of the United States with supplementary table of map unit descriptions: Washington, D.C., U.S. Department of Agriculture Forest Service, scale 1:7,500,000 (also at URL http://www.fs.fed.us/land/ecosysmgmt/ ecoreg1_home.html).
Barnes, Ivan, 1964, Field measurement of alkalinity and pH: U.S. Geological Survey Water-Supply Paper 1535-H, 17 p.
Cohn, J.P., 1984, A national natural laboratory: Bioscience, v. 44, no. 11, p. 727-730.
Cooke, Wythe B., 1936, Geology of the Coastal Plain of South Carolina: U.S. Geological Survey Bulletin 867, 196 p., 2 maps, scale 1:500,000.
Dennehy, K.F., Prowell, D.C., and McMahon, P.B., 1988, Reconnaissance hydrogeologic investigation of the Defense Waste Processing Facility and vicinity, Savannah River Plant, South Carolina: U.S. Geological Survey Water-Resources Investigation 88-4221, 74 p.
Durum, W.H., 1978, Historical profile of quality of water laboratories and activities, 1879-1973: U.S. Geological Survey Open-File Report 78-432, 235 p.
Elwood, J.W., Sale. M.J., and Kaufman, P.R., 1991, The Southern Blue Ridge Province, in Charles, D.F., ed., Acidic deposition and aquatic ecosystems-Regional case studies: New York, Springer-Verlag, p. 319-364.
Fishman, M.J., Raese, J.W., Gerlitz, C.N., and Husband, R.A., 1994, U.S. Geological Survey approved inorganic and organic methods for the analysis of water and fluvial sediment, 1954-94: U.S. Geological Survey Open-File Report 94-351, 55 p.
Hunter, C.H., 1990, A climatological description of the Savannah River Site: Westinghouse Savannah River Company, Savannah River Site, DE-AC09-89SR18035.
Jones, S.M., Van Lear, D.H., and Cox, S.K., 1981, Major forest community types of the Savannah River Site-A field guide: U.S. Department of Energy Contract DE-AS09-77SR01026, 79 p.
Langley, T.M., and Marter, W.L., 1973, The Savannah River Plant Site: Prepared for E.I. Du Pont DeNemours & Company, Savannah River Laboratory, Aiken, S.C., report DP-1323, 175 p.
Lawrence, C.L., 1987, Streamflow characteristics at hydrologic bench-mark stations: U.S. Geological Survey Circular 941, 123 p.
Prowell, David D., 1994, Preliminary geologic map of the Savannah River Site, Aiken, Allendale, and Barnwell Counties, South Carolina: U.S. Geological Open-File Report 94-181, 14 p., 1 map, scale 1:48,000.
Rogers, Vergil A., 1990, Soil survey of Aiken County Area, South Carolina: U.S. Department of Agriculture Soil Conservation Service, 134 p., 76 soil maps, scale 1:20,000.
Ruhe, R.V., and Matney, E.A., 1980, Clay mineralogy of selected sediments and soils at the Savannah River Plant, Aiken, South Carolina: Bloomington, Indiana University, Water Resources Research Center, 48 p.
Siple, George E., 1967, Geology and ground water of the Savannah River Plant and vicinity, South Carolina: U.S. Geological Survey Water-Supply Paper 1841, 113 p.
U.S. Geological Survey, published annually, Water resources data, South Carolina, Columbia: U.S. Geological Survey Water Data Report.
a. U.S. Geological Survey topographic maps:
b. Geologic maps:
c. Soil surveys:
Table B-1. NWIS site identification numbers and site names for water-quality sampling sites.
| Site | Identification Number | Site Name |
| 1 | 02197300 | UPPER THREE RUNS NEAR NEW ELLENTON, SOUTH CAROLINA |
| 2 | 332304081370600 | JOHNSON FORK |
| 3 | 332330081361500 | BOGGY GUT |
| 4 | 332629081380100 | CEDAR CREEK |
| 5 | 332838081351700 | UPPER THREE RUNS BELOW MILLPOND |
| Back to 1173-A Contents |
This page maintained by Nichole Bisceglia.
Last updated July 31, 2000.