
Hydrologic Benchmark Network Stations in the Eastern U.S. 1963-95 (USGS Circular 1173-A)
Buffalo River near Flat Woods, Tennessee (Station 03604000)
To download a printer friendly PDF version of this information click here.
This report details one of the approximately 50 stations in the Hydrologic Benchmark Network (HBN) described in the four-volume U.S. Geological Survey Circular 1173. The suggested citation for the information on this page is:
|
Mast, M.A., and Turk, J.T., 1999, Environmental characteristics and water quality of Hydrologic Benchmark Network stations in the Eastern United States, 1963-95: U.S. Geological Survey Circular 1173-A, 158 p. |
All of the tables and figures are numbered as they appear in each circular. Use the navigation bar above to view the abstract, introduction and methods for the entire circular, as well as a map and list of all of the HBN sites. Use the table of contents below to view the information on this particular station.
Site Characteristics and Land Use
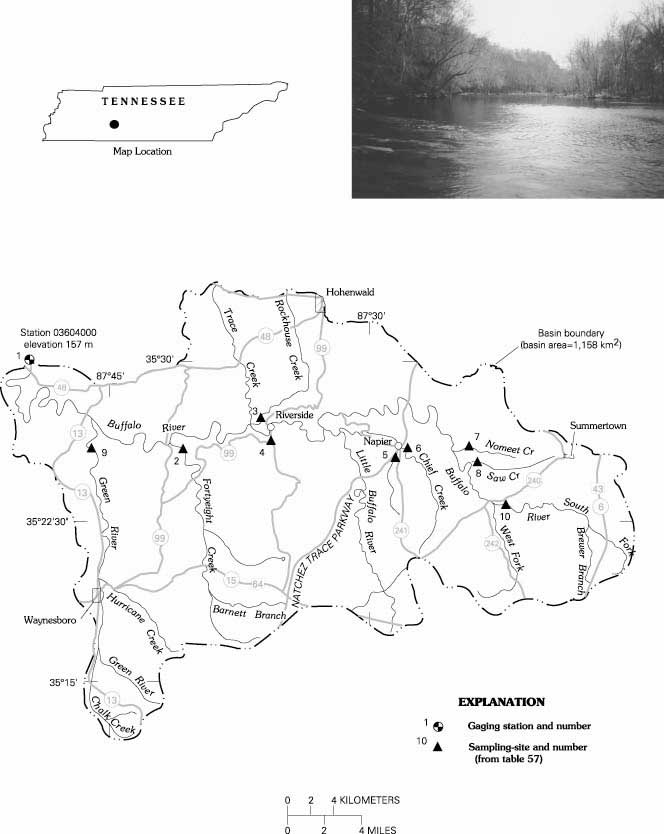
The Buffalo River HBN Basin is in the Western Highland Rim section of the Interior Low Plateaus physiographic province in central Tennessee (Figure 28. Map showing study area in the Buffalo River Basin and photograph of the river channel near the gage). The Highland Rim is a broad peneplain that has been highly
Buffalo River near the gage (12/90; A. Mast)
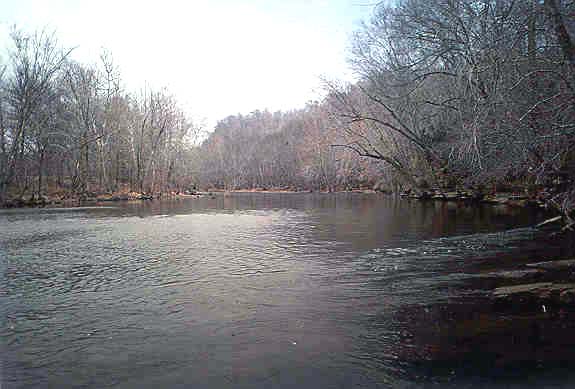 |
dissected by streams, resulting in a landscape of irregular flat-topped ridges separated by steep-sided slopes and flat-bottomed drainages (Smalley, 1981). The Buffalo River drains 1,158 km² of hilly terrain that ranges in elevation from 157 to 305 m. The USGS gaging station is 2.1 km north of Flat Woods, Tenn., at latitude 35°29'45'' and longitude 87°49'58''. The Buffalo River has a channel length of about 108 km upstream from the gage and is one of the longest free-flowing rivers remaining in Tennessee. Stream gradients in the main channel range from 0.6 to 0.9 m/km, and the flood plain reaches more than 1.5 km in width just upstream from the gage. Discharge is perennial, and mean monthly discharge ranges from 7.6 m³/s in September to 41.6 m³/s in March. Average annual runoff from the basin was 59 cm from 1920 to 1995 (U.S. Geological Survey, Water Resources Data, Tennessee). Climate of the area is characterized by long, moderately hot summers and short, mild winters (Smalley, 1991). Average daily air temperatures range from 3.3°C in January to 25°C in July. Winter temperatures often fall below freezing at night and soils typically freeze several times during the average winter season. Precipitation averages 127 cm annually and is greatest from December through March and least from August through October.
The basin lies along the southern margin of the Eastern Broadleaf Forest ecoregion, which is characterized by broadleaf deciduous forests (Bailey and others, 1994). Upland areas are covered by a mixture of oak and oak-hickory forest types, and the dominant species are white oak, southern red oak, and hickories with an understory of dogwood, sourwood, sassafras, persimmon, and huckleberry. Many previously logged or farmed areas have been replanted in a mixture of loblolly and shortleaf pines (Smalley, 1991). Vegetation along the broad alluvial valley is dominated by lowland hardwood forest communities. The dominant species are sweet gum, elm, black gum, red maple, sycamore, and white oak, and the common understory species include cane, honeysuckle, ferns, and mosses. Because little forest land in the basin is under timber management, past cutting practices have contributed to a gradual decline in the amount of high-quality timber in the basin (Smalley, 1991).
Most soils in the basin are highly leached Ultisols of the siliceous thermic families (Smalley, 1981; Francis and Loftus, 1977). Upland areas of the basin are typically covered by the Montview silt loam, a well-drained soil developed in loess, which tends to be relatively free of large chert fragments in the upper 50 cm (Overton, 1959). The ridges and hillslopes are covered by the Bodine chert silt loam, which is a well-drained soil that has developed in cherty limestone. These soils tend to be cherty throughout with chert fragments accounting for 35 to 80 percent of the soil. The Captina silt loams have developed in alluvium along the river bottoms and are moderately well-drained, fertile soils that contain 15 to 35 percent chert fragments (Overton, 1959). These soils are subject to flooding, and the water table is generally within 50 cm of the surface during wet periods of the year.
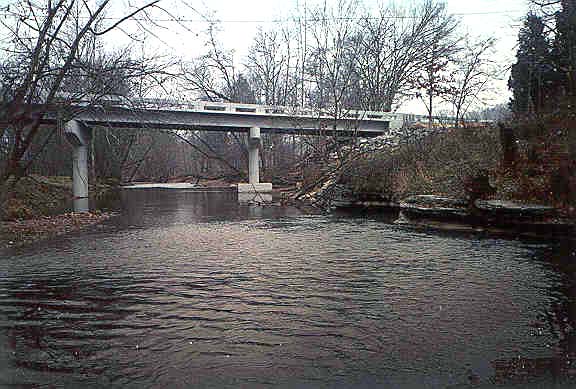
New bridge over Green River (12/90; A. Mast)
 |
Bedrock in the basin includes flat-lying marine sediments of Silurian and Mississippian age. The Silurian rocks, which primarily occupy the valley floor, are limestones that form vertical bluffs along the river and in places have flutings, cavities, and small caves near the water level. The Mississippian rocks are the most extensively outcropping units in the basin and include siliceous limestones, cherty siltstones, and shales of the Fort Payne and Warsaw Formations. These rocks are composed of 60 percent quartz and chalcedony, 37 percent calcite and dolomite, and the remainder pyrite and glauconite (Stearns and Wilson, 1971). Most upland slopes are underlain by a highly siliceous limestone or chert residuum that is formed in place by leaching and silica replacement of the Mississippian bedrock (Stearns and Wilson, 1971). This moderately to highly permeable layer of residuum or saprolith reaches to 30 m in depth and forms an excellent shallow aquifer that releases water from many springs into the Buffalo River and its tributaries. The saprolith also contains deposits of limonite that were extensively mined during the 19th century in areas near Napier and south of Riverside.
The Buffalo River Basin drains parts of Lawrence, Lewis, Wayne, and Perry Counties, and land ownership is predominantly private. Private individuals own most of the land along the river, and timber companies hold most of the land on the upper slopes and ridges. Less than 7 percent of the basin is publicly owned, including 70 km² in the Laurel Hill Wildlife Management area in the Little Buffalo River subbasin and 5 km² in the Lewis State Forest southwest of the town of Hohenwald. In 1968, the State of Tennessee established a scenic river system which eventually included a short headwater section of the Buffalo River in Lawrence County (Tennessee Department of Public Health, 1974). In 1974, the Buffalo River was recommended for inclusion in the National Wild and Scenic Rivers System (Heritage Conservation and Recreation Service, 1979); however, because of opposition by owners of riparian land, the Buffalo River never received official designation as Wild and Scenic. A 28-km segment of the Natchez Trace Parkway and National Scenic Trail runs through the basin from north to south and crosses the river at Napier. The parkway right-of-way, which ranges in width from 100 to 300 m, includes scenic, historic, and recreational features and is administered by the National Park Service. Hundreds of kilometers of primary and secondary roads provide access to most areas of the basin. Public access to the river is limited to seven bridge crossings on Tennessee Department of Transportation rights-of-way and at the Natchez Trace crossing. During most periods of the year, the river is navigable by small boat or canoe downstream from Henryville, Tenn.
Land use in the basin is about 74 percent forest, 10 percent pasture, 15 percent cropland, and less than 1 percent urban and residential. The western one-half of the basin has more relief and tends to be predominantly forested; the eastern one-half of the basin is more suitable for farming. Most agricultural activities are concentrated along the drainages. The most substantial land-use change in the basin during the past 15 years has been a decrease in the amount of cropland and an increase in clearcutting activity by both large timber companies and private landowners (Mike Tatum, Natural Resources Conservation Service, oral commun., 1996). The major use of the river and its tributaries is as a local water supply for domestic, commercial, and industrial purposes (Heritage Conservation and Recreation Service, 1979). The basin contains several small communities, including Waynesboro (population 2,100) in the Green River Basin and Hohenwald (population 3,920) at the head of Rockhouse Creek. The largest potential source of pollution to the river is discharge of domestic and industrial wastewater. Municipal wastewater-treatment plants at Waynesboro, Hohenwald, and Summertown School discharge treated wastewater into the headwaters of the Green River, Rockhouse Creek, and Saw Creek, respectively (Heritage Conservation and Recreation Service, 1979). In addition, there are several sources of untreated industrial wastewater from the community of Waynesboro, including industrial cooling waters, discharge from a car-washing operation, and runoff from a log saturation process (Tennessee Department of Public Health, 1974).
Historical Water-Quality Data and Time-Series Trends
The HBN data set analyzed for this report includes 166 water-quality samples that were collected from April 1963 through December 1995. Sampling frequency ranged from 8 to 12 samplings per year from 1967 through 1971. Sampling frequency was reduced to bimonthly from 1972 through 1982 and again to quarterly from 1983 through 1995. Although not documented, water-quality samples in the early part of the record probably were analyzed at one of three laboratories (Raleigh, N.C.; Ocala, Fla.; and Tuscaloosa, Ala.) that provided analytical services for the Southeastern Region (Durum, 1978). After establishment of the USGS Central Laboratory System, samples were analyzed at the Atlanta laboratory from 1973 through 1985 and at the NWQL in Arvada, Colo., from 1986 through 1995. Daily discharge records for the Buffalo River (station 03604000) are available beginning in May 1920. Records of daily water temperature at the gage are available for July 1963 through January 1978. Daily precipitation amount was measured at the gage from December 1994 through February 1996.
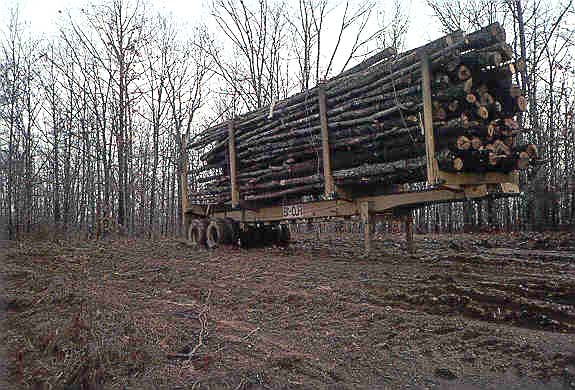
Logging truck in the area (12/90; A. Mast)
 |
Calculated ion balances for 163 samples with complete major ion analyses are shown in Figures 29a and 29b. Temporal variation of discharge, field pH, major ion concentrations, and ion balance at Buffalo River, Tennessee. Ion balances ranged from -7.1 to +9.0 percent, and more than 85 percent of samples had values within the ±5.0 percent range, indicating the analyses are of high quality. The mean charge balance of all samples was 0.1 percent, indicating that unmeasured constituents, such as organic anions, do not contribute significantly to the ion balance of stream water at this station. Time-series plots of the major dissolved constituents were inspected for evidence of method-related effects (fig. 29). For example, sulfate concentrations were slightly higher than average during the late 1980's. This pattern coincides with the use of a turbidimetric titration for sulfate analysis at the NWQL between March 1986 and December 1989 (Fishman and others, 1994). In 1989, the NWQL determined that sulfate concentrations can be overestimated by this technique and changed the method to ion chromatography in 1990 (Office of Water Quality Technical Memorandum No. 90.04, Turbidimetric Sulfate Method, issued December 21, 1989, at URL http://water.usgs.gov/admin/memo/). The bias was most pronounced in dilute waters, although it was not consistent among samples and appeared to be influenced by factors such as color and turbidity (Schertz and others, 1994). The time-series plot of calculated ion balances shows a period of higher than average values in the 1970's and slightly lower than average values in the 1980's. The shift to more negative values in the 1980's correlates with the period of high sulfate values noted previously. The high values in the 1970's could not be traced to a documented change in any one analytical method but are coincident with the period when samples were analyzed at the laboratory in Atlanta, Ga.
The median concentrations and ranges of major constituents in stream water collected at the gage and VWM concentrations in wet-only deposition measured at the Wilburn Chapel NADP station about 70 km southeast of the gage are presented in table 54. Precipitation chemistry at the NADP station is dilute and slightly acidic, with a VWM pH of 4.6 during the 14 years of record. The dominant cations in precipitation were hydrogen and ammonium, which contributed 55 and 24 percent of the total cation charge, respectively. Sulfate accounted for 62 percent of the total anions, and nitrate and chloride accounted for 28 and 10 percent, respectively. These results suggest that precipitation at the nearby NADP station may be affected by anthropogenic emissions of sulfur and nitrogen compounds, which cause acid rain (Likens and others, 1977).
Table 54. Minimum, first quartile, median, third quartile, and maximum values of physical properties and major ion concentrations measured in water-quality samples from Buffalo River, Tennessee, April 1963 through October 1995, and volume-weighted mean concentrations in precipitation collected at the Wilburn Chapel Station, Tennessee
[Concentrations in units of microequivalents per liter, discharge in cubic meters per second, specific conductance in microsiemens per centimeter at 25 degrees Celsius, pH in standard units, and silica in micromoles per liter; n, number of stream samples; VWM, volume-weighted mean; inst., instantaneous; spec. cond., specific conductance; <, less than; --, not reported]
|
Parameter
|
Stream Water
|
Precipitation VMAa
|
|
Minimum
|
First quartile
|
Median
|
Third quartile
|
Maximum
|
n
|
| Discharge, inst. |
4.3
|
8.2
|
12
|
21
|
110
|
163
|
--
|
| Spec. cond., field |
54
|
80
|
88
|
99
|
130
|
161
|
--
|
| pH, field |
6.5
|
7.1
|
7.3
|
7.6
|
8.5
|
164
|
4.6b
|
| Calcium |
400
|
600
|
650
|
750
|
1,050
|
165
|
3.5
|
| Magnesium |
82
|
130
|
150
|
160
|
250
|
165
|
1.2
|
| Sodium |
8.7
|
48
|
52
|
61
|
130
|
165
|
4.2
|
| Potassium |
2.6
|
15
|
21
|
23
|
180
|
165
|
.5
|
| Ammonium |
<.7
|
<.7
|
1.4
|
2.9
|
17
|
59
|
11
|
| Alkalinity, laboratory |
400
|
640
|
730
|
860
|
1,080
|
154
|
--
|
| Chloride |
5.6
|
42
|
51
|
62
|
100
|
165
|
4.8
|
| Sulfate |
42
|
656
|
79
|
100
|
270
|
165
|
29
|
| Nitrite plus nitrate |
<.7
|
7.9
|
14
|
27
|
54
|
101
|
13c
|
| Silica |
3.3
|
77
|
97
|
110
|
160
|
165
|
--
|
aValues are volume-weighted mean concentrations for 1990-94.
bLaboratory pH.
cNitrate only.
Stream water in the Buffalo River is moderately concentrated and well buffered; specific conductances ranged from 54 to 130 meq/L, and alkalinities generally were between 400 to 1,080 meq/L. The major cations in stream water were calcium and magnesium, and the dominant anion was alkalinity. The relatively high concentrations of solutes in stream water indicate that dissolution of carbonate minerals in the underlying bedrock and saprolith is the primary process that controls stream chemistry at this station. The median chloride concentration in stream water was 51 meq/L, which is
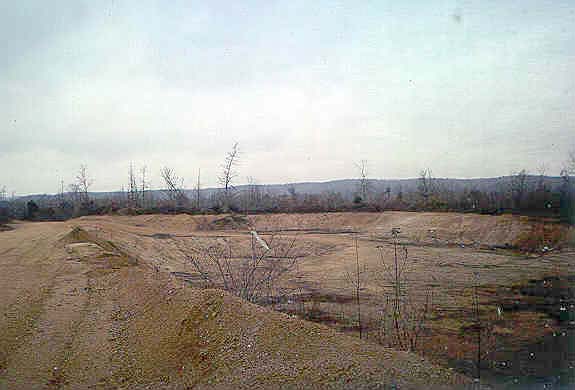
Quarry near Green River site (12/90; A. Mast)
 |
about 10 times larger than the VWM concentration of 4.8 meq/L in precipitation. Based on the difference between average annual runoff and precipitation, evapotranspiration can account for about a twofold increase in the chloride concentration of precipitation, indicating that some stream-water chloride must be derived from sources in the basin. The most likely internal source of chloride is discharge from several domestic and industrial wastewater- treatment facilities in the basin. The median concentration of sulfate in stream water was 79 meq/L compared to 29 meq/L in precipitation and is slightly larger than would be expected solely from the effects of evapotranspiration. Additional sources of stream-water sulfate may include dry deposition from the atmosphere and weathering of small amounts of pyrite in the bedrock and saprolith (Stearns and Wilson, 1971). Biomass appears to be an important sink for nitrogen species on the basis of smaller concentrations of both nitrate and ammonium in stream water compared to precipitation. These low concentrations of nitrate and ammonium also indicate that the wastewater-treatment facilities have a minimal effect on stream-water nitrogen concentrations at the gage.
The solute composition of stream water was further evaluated by analyzing correlations between solutes and stream discharge (table 55). Most major weathering-derived constituents calcium, magnesium, and alkalinity had negative correlations with discharge. These correlations are consistent with a hydrologic system where weathering-enriched base flow is diluted by waters from shallow or surficial sources during periods of increased discharge. The positive correlation between sulfate and discharge (rho = 0.453) may provide evidence that sulfate is derived primarily from atmospheric sources. The implication is that atmospherically deposited sulfate accumulates in the unsaturated zone during dry periods and is transported to the stream when the water table rises during high-flow periods of the year (Shanley, 1992). Among the ions, the strongest correlations were found between calcium, magnesium, and alkalinity. By contrast, silica was only weakly correlated with alkalinity (rho = 0.468) and magnesium (rho = 0.454). The positive correlations between calcium, magnesium, and alkalinity and weak correlations with silica are consistent with the weathering stoichiometry of carbonate minerals. The probability that wastewater from the treatment facilities is the source of some stream-water chloride is further supported by the positive correlation between sodium and chloride (rho = 0.501).
Table 55. Spearman rank correlation coefficients (rho values) showing the relation among discharge, pH, and major ion concentrations, Buffalo River, Tennessee, 1980 through 1995
[Q, discharge; Ca, calcium; Mg, magnesium; Na, sodium; K, potassium; Alk, alkalinity; SO4, sulfate; Cl, chloride; Si, silica]
|
|
Q
|
pH
|
Ca
|
Mg
|
Na
|
K
|
Alk
|
SO4
|
Cl
|
| pH |
0.153
|
|
|
|
|
|
|
|
|
| Ca |
-.868
|
-0.124
|
|
|
|
|
|
|
|
| Mg |
-.685
|
-.064
|
0.848
|
|
|
|
|
|
|
| Na |
.137
|
.205
|
-.080
|
0.127
|
|
|
|
|
|
| K |
.202
|
.037
|
.109
|
.242
|
0.410
|
|
|
|
|
| Alk |
-.818
|
-.104
|
.942
|
.840
|
-.084
|
0.143
|
|
|
|
| SO4 |
.453
|
.242
|
-.366
|
-.176
|
.295
|
.090
|
-0.432
|
|
|
| Cl |
.128
|
.201
|
-.026
|
.063
|
.501
|
.276
|
-.057
|
0.349
|
|
| Si |
-.272
|
-.099
|
.392
|
.454
|
.176
|
.341
|
.468
|
-.104
|
-0.059
|
Results of the seasonal Kendall test for trends in discharge and major dissolved constituents from 1966 through 1995 are shown in table 56. Statistically significant upward trends in sodium, chloride, and potassium were detected in the unadjusted concentrations at the 0.01 confidence level. Results for the flow-adjusted concentrations were similar to the unadjusted concentrations, indicating that trends were not driven by changes in stream discharge. The LOWESS curves in figure 29 show that trends in sodium and chloride concentrations were of similar magnitude and timing. For example, both constituents increased by about 15 meq/L between 1966 and 1985, then leveled off or decreased slightly between 1985 and 1995. Potassium concentrations appear to have increased steadily during the entire period of record. Because roads in the basin are not salted, the upward trends in sodium and chloride may reflect an increasing impact of domestic wastewater from septic systems and treatment facilities in the basin. Census data show that the population of Lewis, Lawrence, and Wayne Counties was relatively constant between 1950 and 1960, increased by almost 20 percent between 1970 and 1980, then stabilized again between 1980 and 1990 (data obtained from U.S. Census Bureau website at http://www.census.gov). Since the period of greatest growth coincides with the largest increase in stream-water chloride and sodium, population growth appears to be a likely cause of the upward trends in sodium and chloride concentrations at the gage. The increase in population also may be the cause of the upward trend in potassium, although activities such as fertilizer application and timber harvesting also may have contributed.
Table 56. Results of the seasonal Kendall test for trends in discharge and unadjusted and flow-adjusted pH and major ion concentrations, Buffalo River, Tennessee, December 1966 through October 1995
[Trends in units of microequivalents per liter per year, except discharge in cubic meters per second per year, pH in standard units per year, and silica in micromoles per liter per year; <, less than; --, not calculated]
|
Parameter
|
Unadjusted
|
Flow adjusted
|
|
Trend
|
p-value
|
Trend
|
p-value
|
| Discharge |
0.06
|
0.411
|
--
|
--
|
| pH, field |
.01
|
.110
|
0.01
|
0.155
|
| Calcium |
<.1
|
.933
|
.4
|
.611
|
| Magnesium |
<.1
|
.951
|
.1
|
.724
|
| Sodium |
.4
|
.001
|
(a)
|
--
|
| Potassium |
.2
|
.000
|
.2
|
.000
|
| Alkalinity, laboratory |
.9
|
.334
|
1.0
|
.123
|
| Sulfate |
<.1
|
.910
|
.1
|
.833
|
| Chloride |
.6
|
.000
|
(a)
|
--
|
| Nitrite plus nitrate |
.1b
|
.508
|
.1
|
.272
|
| Silica |
.4
|
.031
|
.4
|
.032
|
a Flow model not significant at a = 0.01.
b Trend calculated for 1974-95.
Synoptic Water-Quality Data
Results of the synoptic sampling event of December 1 and 2, 1990, are shown in table 57; locations of surface-water sampling sites are shown in figure 28. Discharge at the gage was 10.8 m³/s compared to the median daily discharge of 11.3 m³/s for December (Lawrence, 1987), indicating that the basin was sampled during base-flow conditions for that time of year. Solute concentrations measured at the gage (site 1) during the synoptic sampling were similar to the median concentrations reported for the gage during the entire period of record (table 54). The tributary streams were similar in composition to the gage, with calcium and magnesium the dominant cations and alkalinity the dominant anion. Ion balances ranged from 0.2 to 3.8 percent, suggesting that contribution from organic anions was small.
Table 57. Physical properties and major ion concentrations from surface-water sampling sites in the Buffalo River Basin, Tennessee, December 1-2, 1990
[Site locations shown in fig. 28; Q, discharge in cubic meters per second; SC, specific conductance in microsiemens per centimeter at 25 degrees Celsius; pH in standard units; Ca, calcium; Mg, magnesium; Na, sodium; K, potassium; Alk, alkalinity; SO4, sulfate; Cl, chloride; NO3, nitrate; concentrations in microequivalents; Si, silica in micromoles per liter; WWTP, wastewater-treatment plant; <, less than; --, not measured]
|
Site
|
Station number
|
Q
|
SC
|
pH
|
Ca
|
Mg
|
Na
|
K
|
Alk
|
SO4
|
Cl
|
NO3
|
Si
|
Criteriaa
|
Remarks
|
| 1 |
03604000 |
10.8
|
89
|
7.78
|
700
|
160
|
52
|
17
|
740
|
67
|
51
|
<0.7
|
87
|
--
|
--
|
| 2 |
352603087411500 |
1.10
|
95
|
7.74
|
750
|
150
|
43
|
14
|
820
|
81
|
45
|
<0.7
|
110
|
MT, LU |
Logging in subbasin |
| 3 |
352718087363100 |
.42
|
96
|
7.61
|
650
|
180
|
110
|
20
|
700
|
120
|
76
|
26
|
90
|
MT, LU |
Hohenwald WWTP |
| 4 |
353624087355500 |
.085
|
100
|
7.64
|
850
|
150
|
43
|
13
|
920
|
63
|
62
|
<.7
|
150
|
LU |
Historic mining district |
| 5 |
352620087283200 |
.034
|
63
|
7.43
|
450
|
140
|
39
|
12
|
500
|
52
|
34
|
5.7
|
94
|
LU |
Small subbasin, forested |
| 6 |
352620087283000 |
.28
|
50
|
7.63
|
370
|
99
|
35
|
16
|
420
|
33
|
31
|
4.9
|
110
|
LU |
Reservoir and large resort |
| 7 |
352620087243100 |
.023
|
36
|
6.98
|
220
|
91
|
35
|
9
|
250
|
44
|
31
|
5.0
|
120
|
LU |
Small subbasin, forested |
| 8 |
352601087231600 |
.27
|
120
|
7.68
|
950
|
210
|
48
|
14
|
1,100
|
23
|
17
|
14
|
110
|
LU |
Summertown WWTP |
| 9 |
352549087462500 |
1.02
|
93
|
7.75
|
650
|
170
|
87
|
22
|
700
|
100
|
82
|
13
|
95
|
MT, LU |
Waynesboro WWTP |
| 10 |
352355087195800 |
.27
|
130
|
7.74
|
1,150
|
220
|
52
|
18
|
1,280
|
71
|
39
|
21
|
110
|
MT, LU |
Agriculture |
aCriteria used in selection of sampling sites: MT = major tributary, LU = land use.
Fairly large spatial variations were measured in the concentrations of calcium, magnesium, and alkalinity among the sampled sites. For example, alkalinity ranged from a low of 250 meq/L at site 7 to 1,280 meq/L at site 10. Because limestone is common throughout the basin, these differences in stream chemistry may reflect variable contributions of carbonate-rich ground water from the bedrock aquifer and shallow, more dilute waters from the silica- rich saprolith that mantles the upland hillslopes. The remaining ions were lower in concentration and had less spatial variability than the carbonate weathering products. For example, sodium concentrations ranged from 35 to 109 meq/L, and chloride ranged from 17 to 76 meq/L. The highest concentrations of sodium and chloride were measured at site 3 and site 9. Nitrogen concentrations were low at all the sampling sites and ranged from less than 0.7 meq/L at the gage to 26 meq/L at site 3. Sulfate ranged from 23 to 120 meq/L and also was elevated at sites 3 and 9. The headwaters of Rockhouse Creek (site 3) and the Green River (site 9) each contain a small community and a wastewater-treatment facility, suggesting that concentrations of some dissolved constituents may be affected by human activities in these subbasins.
References Cited
Bailey, R.G., Avers, P.E., King, T., and McNab, W.H., eds., 1994, Ecoregions and subregions of the United States with supplementary table of map unit descriptions: Washington, D.C., U.S. Department of Agriculture Forest Service, scale 1:7,500,000 (also at URL http://www.fs.fed.us/land/ecosysmgmt/ ecoreg1_home.html).
Durum, W.H., 1978, Historical profile of quality of water laboratories and activities, 1879-1973: U.S. Geological Survey Open-File Report 78-432, 235 p.
Fishman, M.J., Raese, J.W., Gerlitz, C.N., and Husband, R.A., 1994, U.S. Geological Survey approved inorganic and organic methods for the analysis of water and fluvial sediment, 1954-94: U.S. Geological Survey Open-File Report 94-351, 55 p.
Francis, J.K., and Loftus, N.S., 1977, Chemical and physical properties of Cumberland Plateau and Highland Rim forest soils: U.S. Department of Agriculture, Forest Service Research Paper SO-138, 44 p.
Heritage Conservation and Recreation Service, 1979, Buffalo River, Tennessee, wild and scenic river study: Washington, D.C., House document, 96th Congress, 1st session, no. 96-199, 239 p.
Lawrence, C.L., 1987, Streamflow characteristics at hydrologic bench-mark stations: U.S. Geological Survey Circular 941, 123 p.
Likens, G.E., Bormann, F.H., Pierce, R.S., Eaton, J.S., and Johnson, N.M., 1977, Biogeochemistry of a forested ecosystem: New York, Springer-Verlag, 146 p.
Overton, J.R., 1959, Soil survey of Lawrence County, Tennessee: U.S. Department of Agriculture Soil Conservation Service, 61 p.
Schertz, T.L., Wells, F.C., and Ohe, D.J., 1994, Sources of trends in water-quality data for selected streams in Texas, 1975-89 water years: U.S. Geological Survey Water-Resources Investigation 94-4213, 49 p.
Shanley, J.B., 1992, Sulfate retention and release in soils at Panola Mountain, Georgia: Soil Science, v. 154, no. 6, p. 499-508.
Smalley, G.W., 1981, Classification and evaluation of forest sites on the western Highland Rim and Pennyroyal: U.S. Department of Agriculture, Forest Service, Southern Forest Experiment Station, general technical report SO-30.
Stearns, R.G., and Wilson, J.M., 1971, Hydrology, geology, and erosion by leaching in Skillman Basin on the Western Highland Rim: Nashville, Tennessee Department of Conservation, Division of Water Resources, 33 p.
Tennessee Department of Public Health, 1974, Water quality survey of the Buffalo River: Nashville, Tenn., Division of Water Quality Control, 53 p.
U.S. Geological Survey, published annually, Water resources data, Tennessee, Nashville: U.S. Geological Survey Water Data Report.
Appendix A. List of Map References
a. U.S. Geological Survey topographic map:
- Deefield, Tennessee (1: 24,000)
- Ethridge, Tennessee (1: 24,000)
- Graves Spring, Tennessee (1: 24,000)
- Henerysville, Tennessee (1: 24,000)
- Kimmins, Tennessee (1: 24,000)
- Leatherwood, Tennessee (1: 24,000), gaging station on this quadrangle
- Negro Hollow, Tennessee (1: 24,000)
- Ovilla, Tennessee (1: 24,000)
- Riverside, Tennessee (1: 24,000)
- Summertown, Tennessee (1: 24,000)
- Topsy, Tennessee (1: 24,000)
- Waynesboro, Tennessee (1: 24,000)
- Hohenwald, Tennessee (1: 24,000)
- Lawrenceburg, Tennessee-Alabama (1: 100,000)
b. Geologic maps:
- Barnes, R.H., Lounsbury, R.E., and Moore, G.K., 1966, Geologic map of the Graves Spring quadrangle, Tennessee: Tennessee Division of Geology GM 41-SW, scale 1: 24,000.
- Lounsbury, R.E., and Marcher, M.V., 1964, Geologic map of the Etheridge quadrangle, Tennessee: Tennessee Division of Geology GM 51-SE, scale 1: 24,000.
- Marcher, M.V., 1963, Geologic map of the Ovilla quadrangle, Tennessee: Tennessee Division of Geology GM 42-SE, scale 1: 24,000.
- Marcher, M.V., 1965, Geologic map of the Kimmins quadrangle, Tennessee: Tennessee Division of Geology GM 41-SE, scale 1: 24,000.
- Marcher, M.V., and Lounsbury, R.E., 1964, Geologic map of the Deerfield quadrangle, Tennessee: Tennessee Division of Geology GM 51-SW, scale 1: 24,000.
- Marcher, M.V., and Lounsbury, R.E., 1965, Geologic map of the Henerysville quadrangle, Tennessee: Tennessee Division of Geology GM 51-NW, scale 1: 24,000.
- Marcher, M.V., and Lounsbury, R.E., 1966, Geologic map of the Summertown quadrangle, Tennessee: Tennessee Division of Geology GM 51-NE, scale 1: 24,000.
- Marcher, M.V., and Wilson, C.W., 1963, Geologic map of the Negro Hollow quadrangle, Tennessee: Tennessee Division of Geology GM 42-NE, scale 1: 24,000.
- Wilson, C.W., Jr., 1969, Geologic map of the Leatherwood quadrangle, Tennessee: Tennessee Division of Geology GM 33-NE, scale 1: 24,000.
- Wilson, C.W., Jr., and Marcher, M.V., 1963, Geologic map of the Topsy quadrangle, Tennessee: Tennessee Division of Geology GM 42-NW, scale 1: 24,000.
- Wilson, C.W., Jr., and Marcher, M.V., 1963, Geologic map of the Riverside quadrangle, Tennessee: Tennessee Division of Geology GM 42-NE, scale 1: 24,000.
- Wilson, C.W., Jr., Stearns, R.G., and Marcher, M.V., 1971, Geologic map of the Waynesboro quadrangle, Tennessee: Tennessee Division of Geology GM 33-SE, scale 1: 24,000.
c. Soil surveys:
- Overton, J.R., 1959, Soil survey of Lawrence County, Tennessee: Nashville, Tenn., U.S. Department of Agriculture Soil Conservation Service, 61 p., 49 soil maps.
- Soil Conservation Service, 1975, General soil map, Lewis County, Tennessee: Nashville, Tenn., U.S. Department of Agriculture Soil Conservation Service, scale 1: 126,720.
d. Other maps
- U.S. Department of the Interior, 1985, Natchez Trace Parkway, Mississippi, Alabama, and Tennessee-Official map and guide: Washington, D.C., U.S. Department of the Interior National Park Service.
- Tennessee Valley Authority, 1981, Important farmland in Perry County, Tennessee: Tennessee Valley Authority in cooperation with the Soil Conservation Service, scale 1: 100,000.
Appendix B - NWIS Site-Identification Numbers
Table B-1. NWIS site identification numbers and site names for water-quality sampling sites.
|
Site
|
Identification Number
|
Site Name
|
|
1
|
03604000 |
BUFFALO RIVER NEAR FLAT WOODS, TENNESSEE |
|
2
|
352603087411500 |
FORTYEIGHT CREEK NEAR MOUTH |
|
3
|
352718087363100 |
ROCKHOUSE CREEK AT MOUTH |
|
4
|
353624087355500 |
ALLENS CREEK NEAR RIVERSIDE |
|
5
|
352620087283200 |
SQUAW BRANCH NEAR NAPIER |
|
6
|
352620087283000 |
CHIEF CREEK BELOW RESERVOIR |
|
7
|
352620087243100 |
NOMEET CREEK NEAR BARNESVILLE |
|
8
|
352601087231600 |
SAW CREEK AT BARNESVILLE |
|
9
|
352549087462500 |
GREEN RIVER NEAR MOUTH |
|
10
|
352355087195800 |
BUFFALO RIVER AT BUFFALO ROAD |
This page maintained by Nichole Bisceglia.
Last updated July 31, 2000.