
Hydrologic Benchmark Network Stations in the Eastern U.S. 1963-95 (USGS Circular 1173-A)
|
|
|
|
|
Little River above Townsend, Tennessee (Station 03497300)
To download a printer friendly PDF version of this information click here.
This report details one of the approximately 50 stations in the Hydrologic Benchmark Network (HBN) described in the four-volume U.S. Geological Survey Circular 1173. The suggested citation for the information on this page is:
|
Mast, M.A., and Turk, J.T., 1999, Environmental characteristics and water quality of Hydrologic Benchmark Network stations in the Eastern United States, 1963-95: U.S. Geological Survey Circular 1173-A, 158 p. |
All of the tables and figures are numbered as they appear in each circular. Use the navigation bar above to view the abstract, introduction and methods for the entire circular, as well as a map and list of all of the HBN sites. Use the table of contents below to view the information on this particular station.
|
Table of Contents |
| 1. Site Characteristics and Land Use |
| 2. Historical Water Quality Data and Time-Series Trends |
| 3. Synoptic Water Quality Data |
Site Characteristics and Land Use
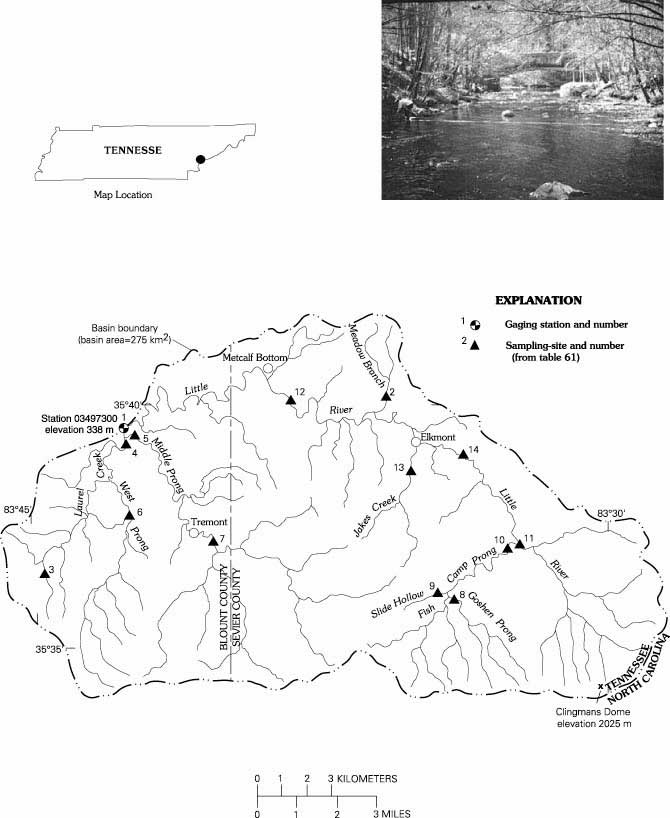
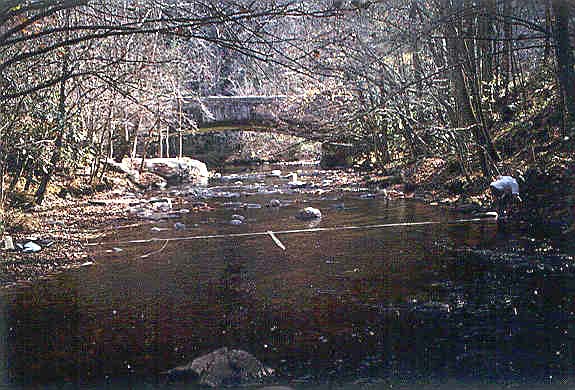
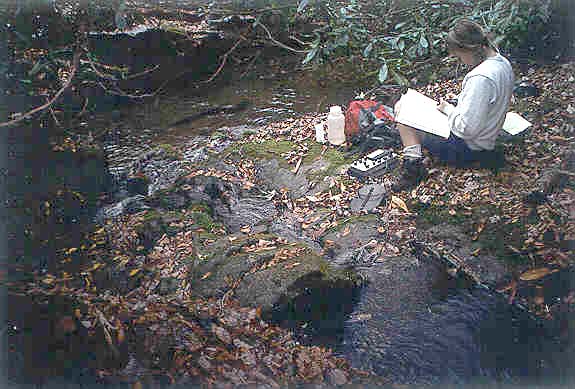
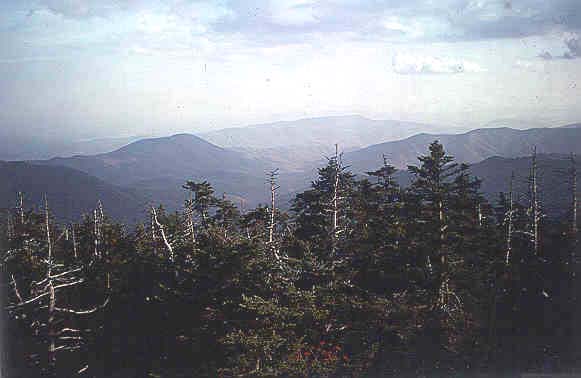
The Little River HBN Basin is in the western one-half of the Great Smoky Mountains National Park (GSMNP) in the Blue Ridge physiographic province in eastern Tennessee (Figure 30. Map showing study area in the Little River Basin and photograph of the stream channel of the Middle Prong). The basin drains 275 km²of steep, mountainous terrain that ranges in elevation from 338 m at the gage to 2,025 m at the summit of Clingmans Dome, the highest point in Tennessee. The USGS gaging station is 0.7 km upstream from the National Park boundary at latitude 35°39'52'' and longitude 83°42'41''. The Little River is a northwest-flowing tributary of the Tennessee River with a channel length of about 36 km upstream from the gage and stream gradients that range from 16 m/km downstream from Elkmont to as much as 110 m/km in the steep headwater tributaries. The main channel is perennial, and mean monthly discharge ranges from about 3.5 m³/s during base-flow conditions in September to 14.8 m³/s during high flow in March. Average annual runoff from the basin was 93 cm from 1964 through 1995 (U.S. Geological Survey, Water Resources Data, Tennessee). Climate of the area is characterized by abundant precipitation and moderate temperatures, although both vary considerably with elevation. For example, average annual precipitation in GSMNP increases from 147 cm at an elevation of 445 m to 231 cm at an elevation of 1,920 m (Shanks, 1954). Snowfall is common at higher elevations during winter months; however, a seasonal snowpack seldom lasts through the winter. Mean monthly air temperatures also vary with elevation and range from 4°C in December to 23°C in July at an elevation of 445 m and 0°C in March to 16°C in July at an elevation of 1,920 m (Shanks, 1954).
 |
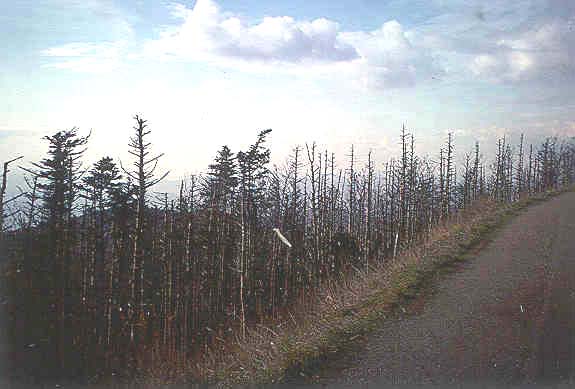
Detailed descriptions of forest vegetation in GSMNP are in Arends (1981) and MacKenzie (1993). The basin lies in the Central Appalachian Broadleaf Forest ecoregion (Bailey and others, 1994) and is covered by hardwood-hemlock forest types at elevations below 1,450 m. The most common tree species are red maple, yellow poplar, black locust, white oak, black oak, sweet birch, and hemlock with lesser amounts of white pine, shortleaf pine, pitchpine, dogwood, and sumac. Rosebay rhododendron and mountain laurel are locally abundant as a dense understory. Above 1,450 m, vegetation is dominated by red spruce and Fraser fir forests that are locally interrupted by beech stands and open areas covered by mountain laurel and blueberries. Recently, there has been substantial dieback of the Fraser fir because of the attack of the wooly aphid (Eagar, 1984). Most soils in the basin are classified as Inseptisols and are described as fairly deep, well-drained soils developed in residuum weathered from the underlying bedrock (Feldman and others, 1991). Chemically, these soils tend to be acidic (pH 4.1 to 5.8) and have a low organic content and low cation-exchange capacities (Daniels and others, 1987). Aluminum generally dominates the exchange complex, which is almost entirely derived from the organic matter. The mineralogy of the sand and silt fraction is dominated by quartz, mica, and feldspar, and the dominant clays are interstratified mica/vermiculite, smectite, kaolinite, and gibbsite.
Complete descriptions of the geology of GSMNP and detailed geologic maps can be found in King (1963) and King (1968). Most bedrock in GSMNP consists of a thick mass of variably metamorphosed sedimentary rocks of late Precambrian age. The dominant units underlying the Little River Basin are the Elkmont and Thunderhead Sandstones, which are massive, thick-bedded feldspathic sandstones composed of detrital quartz, potassium feldspar, and plagioclase and metamorphic biotite, muscovite, and chlorite. The Anakeesta Formation, a dark-gray slate and phyllite, crops out in the Fish Camp Prong subbasin and the headwaters area of Middle Prong. In outcrop, these rocks tend to form serrate crests and craggy pinnacles, and recent exposures are commonly heavily stained with rust owing to considerable quantities of iron sulfide minerals in the phyllite (King, 1968). Acidic leachate from roadfill materials containing rock from the Anakeesta Formation has impacted surface-water quality in some areas of GSMNP, although no problems have been identified in the Little River Basin (Mathews and Morgan, 1982). The Metcalf Phyllite is predominantly found in the northwestern part of the basin and is described as an almost homogeneous body of light-colored phyllite with minor amounts of siltstone and sandstone. About 80 percent of the phyllite consists of chlorite and sericite, and the remainder is quartz with minor amounts of feldspar and calcite. A small area near the headwaters of Laurel Creek is underlain by Ordovician limestone that is exposed by erosion of the overlying thrust sheet of Precambrian sediments. Bedrock in many areas of the basin is covered by deposits of alluvium and colluvium and saprolite that are locally as much as 30 m thick.
The Little River Basin drains parts of Sevier and Blount Counties in eastern Tennessee and is entirely in the boundaries of GSMNP. Access into the basin is by way of State Highway 73, which enters the basin at the gage and parallels the main channel as far upstream as Elkmont. Secondary roads provide access from outside the basin boundary to the Laurel Creek and Middle Fork drainages and to Clingmans Dome. State Highway 73 is occasionally plowed in winter, but deicing salts are not used on any roads in the GSMNP boundary. Foot trails provide access to most other areas in the basin, and a portion of the Appalachian Trail follows the southern basin divide.
 |
Significant landscape disturbance because of logging, farming, and fire occurred prior to GSMNP's establishment in 1933 (Pyle, 1985; Lambert, 1957, 1960). The Little River Basin was first settled by Europeans in the 1830's, but landscape disturbance was limited primarily to farming activities and selective logging at lower elevations in the basin. The early 1900's was the most intense period of human disturbance as a result of large-scale logging operations and severe forest fires. The largest single logging operation in GSMNP was run by the Little River Lumber Company, which logged in the Little River Basin from 1904 to 1939. Most drainages in the basin were penetrated by logging railroads, many of which were eventually converted to trails and roads, including State Highway 73 through the Little River Gorge.
Since the 1940's, GSMNP has managed land in the basin primarily to restore and preserve the natural environment as outlined in the park's general management plan (U.S. Department of the Interior, 1988). The exception is the main river corridor, which is designated as a development zone allowing park facilities and roads. The largest concentration of park facilities in the corridor is at Elkmont, which contains a 120-site campground, several park residences, and a ranger station (Wayne Williams, National Park Service, oral commun., 1996). Several unoccupied structures, including 60 summer cabins and an historic hotel, still stand near the mouth of Jakes Creek. Other park structures in the basin include a picnic area and comfort station and septic system at Metcalf Bottom and an educational center and ranger station at Tremont. Elkmont and Tremont have wastewater-treatment facilities that discharge treated water into the Little River and Middle Prong, respectively, during the summer (Wayne Williams, oral commun., 1996). The Little River is in one of the most accessible areas of GSMNP and receives considerable tourist traffic during the summer.
Because of the wide diversity of natural resources in GSMNP, the park has become an important research area for studying environmental impacts on terrestrial and aquatic ecosystems (Nodvin and others, 1993). A complete bibliography of scientific research in the park has been compiled by Nodvin and others (1993) and is available in digital form at URL http://funnelweb.utcc.utk.edu/%7Enodvin/smokyhtml.htm/. Air pollution is currently one of the biggest concerns for natural resources and for visitors in the park; consequently, GSMNP has one of the most comprehensive air-quality-monitoring programs in the National Park System. The current monitoring system includes nine weather stations, three atmospheric deposition sites, and seven air- quality-monitoring stations (Jim Renfro, National Park Service, oral commun., 1996). In addition, GSMNP also monitors the water quality of several streams, including an intensively monitored site at the headwaters of Noland Creek on the south site of Clingmans Dome (Jim Renfro, oral commun., 1996).
Historical Water-Quality Data and Time-Series Trends
The data set analyzed for this report includes 61 water-quality samples that were collected bimonthly from October 1985 through December 1995. Twenty samples were collected from August 1963 through August 1968, prior to 1986 when the site was added to the HBN. All samples that were collected as part of the HBN were analyzed at the NWQL in Arvada, Colo. Daily discharge records for the Little River (station 03497300) are available beginning in October 1933. Records of daily water temperature at the gage are available for October 1963 through January 1982, and daily precipitation amount was measured at the gage from 1991 through 1995.
Calculated ion balance for 60 samples with complete major ion analyses is shown in Figures 31a and 31b. Temporal variation of discharge, field pH, major ion concentrations, and ion balance at Little River, Tennessee. Ion balances ranged from -25 to +16 percent, and about 75 percent of samples had values within the ±10 percent range, indicating the analytical results are of good quality. The average ion balance was -7.6 percent, and 92 percent of samples had negative ion balances, indicating an excess of measured anions over cations in solution. Laboratory alkalinity in HBN samples was determined by a fixed-endpoint titration to pH 4.5. For low-alkalinity waters, the endpoint pH is closer to 5.0, and titration to pH 4.5 may over estimate alkalinity by as much as 25 meq/L (Barnes, 1964). Alkalinity also was determined by incremental titration in the field beginning in 1992. A comparison of the two alkalinity determinations shows that the fixed endpoint concentrations were, on average, 29 meq/L larger than the incremental concentrations. This discrepancy in the two measurements is similar to the average anion excess of 30 meq/L, suggesting that the fixed-endpoint titration is a reasonable explanation of the negative ion balances.
 |
Time-series plots of the major dissolved constituents were inspected for evidence of method-related effects (fig. 31). The most notable pattern observed was in sulfate, which had a period of elevated concentrations during the late 1980's. This pattern coincides with the use of a turbidimetric titration for sulfate analyses at the NWQL between March 1986 and December 1989 (Fishman and others, 1994). In 1989, the NWQL determined that sulfate concentrations can be overestimated by this technique and changed the method to ion chromatography in 1990 (Office of Water Quality Technical Memorandum No. 90.04, Turbidimetric Sulfate Method, issued December 21, 1989, at URL http://water.usgs.gov/admin/memo/). The bias was most pronounced in dilute waters, although it was not consistent among samples and appeared to be affected by factors such as color and turbidity (Schertz and others, 1994).
Table 58 lists median concentrations and ranges of major constituents in stream water collected at the gage and VWM concentrations in wet-only deposition measured at the Elkmont NADP station near the Elkmont campground. Atmospheric deposition of sulfate, nitrate, and hydrogen in the Southern Blue Ridge Province is among the highest reported in the Eastern United States (Elwood and others, 1991). The VWM pH of wet precipitation measured at the Elkmont NADP station was 4.5 during the 15 years of record. The dominant cations in precipitation were hydrogen, which contributed 63 percent of the total cation charge, and ammonium, which contributed 20 percent. The dominant anions were sulfate and nitrate, which accounted for 65 and 29 percent of the total anions, respectively.
Table 58. Minimum, first quartile, median, third quartile, and maximum values of physical properties and major ion concentrations measured in water-quality samples from Little River, Tennessee, October 1985 through July 1995, and volume-weighted mean concentrations in wet precipitation collected at the Elkmont Station, Tennessee
[Concentrations in units of microequivalents per liter, discharge in cubic meters per second, specific conductance in microsiemens per centimeter at 25 degrees Celsius, pH in standard units, and silica in micromoles per liter; n, number of stream samples; VWM, volume-weighted mean; inst., instantaneous; spec. cond., specific conductance; <, less than; --, not reported]
|
Parameter |
Stream Water |
Precipitation VMAa |
|||||
|
Minimum |
First quartile |
Median |
Third quartile |
Maximum |
n |
||
| Discharge, inst. |
1.0 |
2.8 |
5.1 |
8.5 |
20 |
57 |
-- |
| Spec. cond., field |
9.6 |
14 |
17 |
20 |
61 |
56 |
-- |
| pH, field |
6.4 |
6.8 |
6.9 |
7.2 |
7.7 |
56 |
4.5b |
| Calcium |
48 |
65 |
75 |
87 |
190 |
59 |
4.5 |
| Magnesium |
23 |
30 |
34 |
38 |
70 |
59 |
1.4 |
| Sodium |
19 |
39 |
44 |
48 |
61 |
59 |
2.7 |
| Potassium |
7.7 |
13 |
13 |
15 |
26 |
59 |
.9 |
| Ammonium |
<.7 |
<.7 |
<.7 |
1.4 |
3.6 |
59 |
10 |
| Alkalinity, laboratory |
60 |
96 |
120 |
140 |
260 |
59 |
-- |
| Sulfate |
25 |
35 |
42 |
58 |
130 |
59 |
34 |
| Chloride |
8.5 |
11 |
14 |
17 |
49 |
59 |
3.1 |
| Nitrite plus nitrate |
<3.6 |
9.7 |
11 |
14 |
31 |
56 |
15c |
| Silica |
83 |
90 |
95 |
110 |
120 |
58 |
-- |
aValues are volume-weighted mean concentrations for 1980-94.
bLaboratory pH.
cNitrate only.
Stream water in the Little River is dilute and weakly buffered; specific conductances ranged from 10 to 61 µS/cm, and alkalinities generally were between 40 and 260 meq/L. The major cations in stream water were calcium and sodium, and the dominant anion was alkalinity. The low concentrations of the weathering-derived solutes, particularly alkalinity, reflect the slow-weathering sandstones and quartzites of the underlying Precambrian bedrock. The median chloride concentration in stream water was 14 meq/L, which is about four times larger than the VWM concentration of chloride in precipitation. Based on the difference between average annual runoff and precipitation, evapotranspiration can account for about a twofold increase in the concentration of precipitation, suggesting that as much as one-half of stream-water chloride may be derived from sources other than wet deposition. Measurements at a high-elevation site in GSMNP indicate that total annual chloride deposition may be twice that of wet deposition because of additional inputs from dry deposition and cloud interception (Elwood and others, 1991). Estimates of total sulfate and nitrate deposition at the high-elevation site were two to five times greater than wet deposition. The median concentration of sulfate in stream water was 42 meq/L compared to the VWM concentration in precipitation of 34 meq/ L. Considering the combined effects of evapotranspiration and additional inputs of sulfate in dry deposition, these data suggest that a substantial portion of atmospherically deposited sulfate is retained in the basin. The most likely mechanism for retention is sulfate adsorption on clays and organic matter in the soil environment. The basin also is an important sink for nitrogen species, based on the smaller concentrations of both nitrate and ammonium in stream water compared to precipitation. By contrast, many higher elevation streams in the park have been found to have nitrate concentrations similar to those in precipitation (Nodvin and others, 1995). Retention of both sulfate and nitrate in the Little River Basin probably is an important process buffering stream water from the effects of acidic deposition (Cosby and others, 1991).
The solute composition of stream water was further evaluated by analyzing correlations between solutes and stream discharge (table 59). Most weathering-derived constituents, particularly calcium, magnesium, and alkalinity, had negative correlations with discharge. These results are consistent with a hydrologic system where weathering-enriched base flow is diluted by waters from shallow or surficial sources during periods of increased discharge. Among the ions, the strongest correlations were found between calcium, magnesium, and alkalinity, which indicates that weathering of carbonates is the dominant process that controls the release of base cations to surface waters. The atmospherically derived solutes, chloride and sulfate, were poorly correlated with the weathering-derived constituents with the exception of weak positive correlations with some base cations, particularly potassium. These weak correlations may be an indication that soil processes probably also are important in regulating cation concentrations stream water.
Table 59. Spearman rank correlation coefficients (rho values) showing the relation among discharge, pH, and major ion concentrations, Little River, Tennessee, 1986 through 1995
[Q, discharge; Ca, calcium; Mg, magnesium; Na, sodium; K, potassium; Alk, alkalinity; SO4, sulfate; Cl, chloride; N, nitrite plus nitrate; Si, silica]
|
|
Q |
pH |
Ca |
Mg |
Na |
K |
Alk |
SO4 |
Cl |
N |
| pH |
-0.341 |
|
|
|
|
|
|
|
|
|
| Ca |
-.756 |
0.385 |
|
|
|
|
|
|
|
|
| Mg |
-.731 |
.309 |
0.874 |
|
|
|
|
|
|
|
| Na |
-.696 |
.311 |
.673 |
0.616 |
|
|
|
|
|
|
| K |
-.474 |
.071 |
.619 |
.586 |
0.468 |
|
|
|
|
|
| Alk |
-.742 |
.375 |
.641 |
.614 |
.560 |
0.485 |
|
|
|
|
| SO4 |
-.237 |
.026 |
.355 |
.237 |
.177 |
.369 |
0.047 |
|
|
|
| Cl |
-.239 |
.156 |
.211 |
.094 |
.305 |
.389 |
.146 |
0.321 |
|
|
| N |
.204 |
-.160 |
-.107 |
-.155 |
-.123 |
-.046 |
-.258 |
-.127 |
-0.145 |
|
| Si |
-.468 |
.240 |
.460 |
.492 |
.505 |
.467 |
.634 |
-.218 |
.086 |
-0.214 |
Results of the seasonal Kendall test for trends in discharge and major dissolved constituents are shown in table 60. Trends at this station were calculated only during a 10-year period because the station was not added to the HBN until 1986. Statistically significant downward trends were detected in the unadjusted and flow-adjusted calcium, magnesium, and sulfate concentrations and the flow-adjusted potassium concentrations at the 0.01 confidence level. A statistically significant upward trend also was detected in the flow-adjusted alkalinity at the 0.01 confidence level. The LOWESS curve in figure 31 shows that most of the decrease in sulfate occurred around 1990 and was probably caused by the period of positive analytical bias in the 1980's. The cause of the upward trend in alkalinity is not clear but may be linked to declines in sulfate concentrations observed at many NADP stations in the Southeast from 1980 to 1992 (Lynch and others, 1995). Most NADP stations in the Southeast also had substantial declines in base cation concentrations, particularly calcium and magnesium (Lynch and others, 1995), which is consistent with the downward trends in stream-water cation concentrations in the Little River. The lack of trend in stream-water nitrite plus nitrate concentrations was somewhat unexpected considering the observation that many high-elevation areas in GSMNP are reaching an advanced stage of nitrogen saturation because of the cumulative effects of atmospheric nitrogen deposition (Nodvin and others, 1995). With continued high rates of nitrogen deposition, however, the area of nitrogen saturation should begin to move downslope and eventually may cause increasing nitrate concentrations in streams at lower elevations (Nodvin and others, 1995).
Table 60. Results of the seasonal Kendall test for trends in discharge and unadjusted and flow-adjusted pH and major ion concentrations, Little River, Tennessee, October 1985 through August 1995
[Trends in units of microequivalents per liter per year, except discharge in cubic meters per second per year, pH in standard units per year, and silica in micromoles per liter per year; <, less than; --, not calculated]
|
Parameter |
Unadjusted |
Flow adjusted |
||
|
Trend |
p-value |
Trend |
p-value |
|
| Discharge |
0.05 |
0.929 |
-- |
-- |
| pH, field |
<.01 |
.999 |
0.01 |
0.754 |
| Calcium |
-1.0 |
.008 |
-1.3 |
.001 |
| Magnesium |
-.6 |
.003 |
-.4 |
.005 |
| Sodium |
-.5 |
.060 |
-.5 |
.044 |
| Potassium |
<.1 |
.012 |
-.3 |
.006 |
| Alkalinity, laboratory |
1.4 |
.160 |
3.1 |
.008 |
| Sulfate |
-3.1 |
.000 |
-3.2 |
.000 |
| Chloride |
-.4 |
.045 |
-.4 |
.036 |
| Nitrite plus nitrate |
-.2a |
.022 |
-- |
-- |
| Silica |
.9 |
.064 |
.9 |
.023 |
a Calculated using a trend test for censored data.
Synoptic Water-Quality Data
Results of the surface-water synoptic sampling of October 29 and 30, 1991, are presented in table 61; locations of sampling sites are shown in figure 30. Discharge at the gage was 1.61 m³/s compared to the median daily discharge of 2.83 m³/s for October (Lawrence, 1987), indicating that the basin was sampled during base-flow conditions for that time of year. Solute concentrations measured at the gage (site 1) during the sampling period were similar to the third-quartile concentrations reported for the gage during the entire period of record, except for nitrate (table 58). Most tributary streams were very dilute and similar in composition to the sample collected at the gage. All samples had ion balances close to zero (range -1.6 to 3.7 percent), indicating that organic anions did not contribute significantly to the ionic content of stream water during the sampling period.
Table 61. Physical properties and major ion concentrations from surface-water sampling sites in the Little River Basin, Tennessee, October 29-30, 1991
[Site locations shown in fig. 30; Q, discharge in cubic meters per second; SC, specific conductance in microsiemens per centimeter at 25 degrees Celsius; pH in standard units; Ca, calcium; Mg, magnesium; Na, sodium; K, potassium; Alk, alkalinity; SO4, sulfate; Cl, chloride; NO3, nitrate; concentrations in microequivalents; Si, silica in micromoles per liter; CG, campground; SS, sandstone; <, less than; --, not measured]
|
Site |
Station number |
Q |
SC |
pH |
Ca |
Mg |
Na |
K |
Alk |
SO4 |
Cl |
NO3 |
Si |
Criteriaa |
Remarks |
|
1 |
03497300 |
|
22 | 7.16 | 95 | 42 | 57 |
|
140 | 38 | 14 | <0.7 | 120 |
-- |
-- |
|
2 |
353906083424700 | -- | 28 | 7.30 | 95 | 67 | 83 | 20 | 190 | 44 | 16 | <.7 | 210 |
BG
|
Metcalf Phyllite |
|
3 |
353648083443600 | .025 | 84 | 7.50 | 500 | 250 | 74 |
|
700 | 120 | 14 | <.7 | 160 | BG | Limestone |
|
4 |
353919083423600 |
|
31 | 6.84 | 140 | 66 | 65 |
|
220 | 50 | 18 | <.7 | 140 | MT, BG | Metcalf Phyllite |
|
5 |
353926083423100 |
|
19 | 7.07 | 75 | 36 | 44 |
|
120 | 33 | 14 | <.7 | 110 | MT, BG | Downstream from Tremont |
|
6 |
353741083421900 |
|
16 | 7.31 | 50 | 21 | 44 |
|
81 | 33 | 14 | <.7 | 130 | MT, BG | Thunderhead and Elkmont SS |
|
7 |
353631083401100 |
|
15 | 6.81 | 50 | 26 | 35 |
|
70 | 42 | 15 | <.7 | 87 | BG | Anakeesta Shale |
|
8 |
353552083335500 |
|
13 | 6.70 | 37 | 19 | 35 |
|
45 | 31 | 13 | 9.3 | 84 | BG | Thunderhead SS |
|
9 |
353616083334800 |
|
23 | 7.01 | 90 | 55 | 44 |
|
100 | 75 | 16 | <.7 | 95 | BG | Thunderhead and Anakeesta |
|
10 |
353708083322200 |
|
14 | 6.88 | 45 | 26 | 35 |
|
69 | 33 | 13 | <.7 | 87 | BG | Thunderhead and Anakeesta |
|
11 |
353709083321500 | .17 | 16 | 6.96 | 65 | 23 | 39 |
|
80 | 42 | 11 | <.7 | 92 | BG | Thunderhead SS |
|
12 |
353958083380500 |
|
18 | 7.07 | 70 | 29 | 44 |
|
110 | 35 | 13 | <.7 | 110 | LU | Downstream from Elkmont CG |
|
13 |
353835083350800 |
|
14 | 6.90 | 48 | 14 | 39 |
|
76 | 23 | 12 | <.7 | 110 | BG | Elkmont SS |
|
14 |
353900083334900 |
|
15 | 6.96 | 55 | 25 | 35 |
|
79 | 38 | 12 | <.7 | 950 | LU | Upstream from Elkmont CG |
aCriteria used in selection of sampling sites: BG = bedrock geology, MT = major tributary, LU = land use.
Comparison of results in table 61 with the distribution of dominant bedrock types in the basin shows no obvious correlation between surface-water chemistry and mapped bedrock geology, with the exception of site 3. Stream-water
 |
Constituents derived primarily from atmospheric sources had much less variability than the major weathering products. For example, chloride concentrations ranged from 11 to 18 meq/L, and nitrate concentrations were below the detection limit at all but one of the sampling sites. Neither chloride nor nitrate concentrations were elevated in stream waters downstream from Elkmont and Tremont (sites 5 and 12), indicating that the wastewater facilities do not affect water quality during periods of low visitor use in the park. Nitrate concentrations in tributary streams were lower than the long-term median concentrations at the gage (table 58), which may reflect the time of year the samples were collected. Silsbee and Larson (1982) observed that stream-water nitrate concentrations in GSMNP varied seasonally, with the highest concentrations in winter and spring and the lowest concentrations in autumn. Low autumn concentrations may result from uptake of nitrogen by microorganisms during the initial stages of leaf fall (Silsbee and Larson, 1982). Sulfate concentrations also were low and fairly uniform over the basin, except for site 3 and site 9, which had concentrations of 123 meq/L and 75 meq/L, respectively, compared to the average concentration of 34 meq/L for the remaining 12 sites. The slightly elevated sulfate concentrations in these tributaries indicate that weathering of pyrite in the Anakeesta Formation may contribute small amounts of sulfate to stream water in some areas of the basin.
References Cited
Arends, Ernesto, 1981, Vegetation patterns a half century following the chestnut blight in the Great Smoky Mountains National Park: Knoxville, University of Tennessee, Master's thesis, 79 p.
Bailey, R.G., Avers, P.E., King, T., and McNab, W.H., eds., 1994, Ecoregions and subregions of the United States with supplementary table of map unit descriptions: Washington, D.C., U.S. Department of Agriculture Forest Service, scale 1:7,500,000 (also at URL http://www.fs.fed.us/land/ecosysmgmt/ecoreg1_home.html).
Barnes, Ivan, 1964, Field measurement of alkalinity and pH: U.S. Geological Survey Water-Supply Paper-1535-H, 17 p.
Cosby, B.J., Ryan, P.F., Webb, J.R., Hornberger, G.M., and Galloway, J.N., 1991, Mountains of western Virginia, in Charles, D.F., ed., Acidic deposition and aquatic ecosystems-Regional case studies: New York, Springer- Verlag, p. 297-318.
Daniels, W.L., Zelazny, L.W., and Everett, C.J., 1987, Virgin hardwood forest soils of the Southern Appalachian Mountains-II, Weathering, mineralogy, and chemical properties: Soil Science Society of America, v. 51, p. 730-738.
Elwood, J.W., Sale. M.J., and Kaufman, P.R., 1991, The Southern Blue Ridge Province, in Charles, D.F., ed., Acidic deposition and aquatic ecosystems-Regional case studies: New York, Springer-Verlag, p. 319-364.
Feldman, S.B., Zelazny, L.W., and Baker, J.C., 1991, High-elevation forest soils of the Southern Appalachians-II, Geomorphology, pedogenesis, and clay mineralogy: Soil Science Society of America, v. 55, p. 1782-1791.
Fishman, M.J., Raese, J.W., Gerlitz, C.N., and Husband, R.A., 1994, U.S. Geological Survey approved inorganic and organic methods for the analysis of water and fluvial sediment, 1954-94: U.S. Geological Survey Open-File Report 94-351, 55 p.
King, P.B., 1963, Geology of the central Great Smoky Mountains, Tennessee: U.S. Geological Survey Professional Paper 349-C.
King, P.B., 1968, Geology of the Great Smoky Mountains National Park Tennessee and North Carolina: U.S. Geological Survey Professional Paper 587.
Lambert, R.S., 1957, The pioneer history of the Great Smoky Mountains National Park: Great Smoky Mountains National Park, report to the superintendent, 96 p.
Lambert, R.S., 1960, Logging in the Great Smoky Mountains: Great Smoky Mountains National Park, report to the superintendent, 65 p.
Lawrence, C.L., 1987, Streamflow characteristics at hydrologic bench-mark stations: U.S. Geological Survey Circular 941, 123 p.
Lynch, J.A., Grimm, J.W., and Bowersox, V.C., 1995, Trends in precipitation chemistry in the United States-A national perspective, 1980-1992: Atmospheric Environment, v. 29, no. 11, p. 1231-1246.
MacKenzie, M.D., 1993, The vegetation of Great Smoky Mountains National Park-Past, present, and future: Knoxville, University of Tennessee, Ph.D. dissertation, 154 p.
Mathews, R.C., and Morgan, E.L., 1982, Toxicity of Anakeesta Formation leachates to shovel-nosed salamander, Great Smoky Mountains National Park: Journal of Environmental Quality, v. 11, no. 1, p. 102-106.
Nodvin, S.C., Van Miegroet, H., Lindberg, S.E., Nicholas, N.S., and Johnson, D.W., 1995, Acidic deposition, ecosystem processes, and nitrogen saturation in a high elevation southern Appalachian watershed: Water, Air, and Soil Pollution, v. 85, p. 1647-1652.
Pyle, Charlotte, 1985, Vegetation disturbance history of Great Smoky Mountains National Park-An analysis of archival maps and records: U.S. Department of the Interior, National Park Service, Southeast Region, Research/Resource Management Report SER-77, 69 p.
Schertz, T.L., Wells, F.C., and Ohe, D.J., 1994, Sources of trends in water-quality data for selected streams in Texas, 1975-89 water years: U.S. Geological Survey Water-Resources Investigation 94-4213, 49 p.
Shanks, R.E., 1954, Climates of the Great Smoky Mountains: Ecology, v. 35, p. 354-361.
Silsbee, D.G., and Larson, G.L., 1982, Water quality of streams in the Great Smoky Mountains National Park: Hydrobiologia, v. 89, p. 97-115.
U.S. Department of the Interior, 1988, Final environmental impact statement for the general management plan, Great Smoky Mountain National Park, North Carolina-Tennessee: National Park Service, Denver Service Center.
U.S. Geological Survey, published annually, Water resources data, Tennessee, Nashville: U.S. Geological Survey Water Data Report.
Appendix A. List of Map References
a. U.S. Geological Survey topographic maps:
- Cades Cove, Tennessee-North Carolina (1: 24,000)
- Clingmans Dome, North Carolina-Tennessee (1: 24,000)
- Gatlinburg, Tennessee (1: 24,000)
- Silers Bald, North Carolina-Tennessee (1: 24,000)
- Thunderhead Mountain, North Carolina-Tennessee (1: 24,000)
- Wear Cove, Tennessee (1: 24,000), gaging station on this quadrangle
- Knoxville, Tennessee-North Carolina (1: 100,000)
- Great Smoky Mountains National Park, Tennessee and North Carolina, West Half (1: 62,500)
b. Geologic maps:
- King, P.B., 1968, Geology of the Great Smoky Mountains National Park Tennessee and North Carolina: U.S. Geological Survey Professional Paper 587, scale 1: 250,000.
- King, P.B., 1963, Geology of the central Great Smoky Mountains, Tennessee: U.S. Geological Survey Professional Paper 349-C, scale 1:62,500.
c. Soil surveys:
- Elder, J.A., 1953, Soil survey of Blount County, Tennessee: U.S. Department of Agriculture Soil Conservation Service, p. 119.
- Hubbard, E.H., 1956, Soil survey of Sevier County, Tennessee: U.S. Department of Agriculture Soil Conservation Service, p. 203.
d. Other maps:
- Earthwalk Press, 1990, Earthwalk Press hiking map and guide, Great Smoky Mountains National Park, scale 1: 62,500.
- MacKenzie, M.D., 1991, Vegetation map of the Great Smoky Mountains National Park based on landsat thematic mapper data-Accuracy assessment and numerical description of vegetation types: Knoxville University of Tennessee, Cooperative Park Studies Unit, 11 p.
- McMaster, W.M., and Hubbard, E.F., 1970, Water resources of the Great Smoky Mountains National Park, Tennessee and North Carolina: U.S. Geological Survey Hydrologic Investigations Atlas HA-420, scale 1: 125,000.
- National Park Service, 1988, Great Smoky Mountains National Park trail map, North Carolina/Tennessee: U.S. Department of the Interior, National Park Service, 40 x 55 cm, scale 1: 168,000.
Appendix B. NWIS Site-Identification Numbers
Table B-1. NWIS site identification numbers and site names for water-quality sampling sites.
|
Site |
Identification Number |
Site Name |
|
1 |
03497300 |
LITTLE RIVER AB TOWNSEND, TENNESSEE |
|
2 |
353906083424700 |
MEADOW BRANCH AB TOWNSEND |
|
3 |
353648083443600 |
LAUREL CREEK AB TOWNSEND |
|
4 |
353919083423600 |
WEST PRONG AB TOWNSEND |
|
5 |
353926083423100 |
MIDDLE PRONG AB TOWNSEND |
|
6 |
353741083421900 |
WEST PRONG AB LAUREL CREEK AB TOWNSEND |
|
7 |
353631083401100 |
SAMS CREEK AB TOWNSEND |
|
8 |
353552083335500 |
GOSHEN PRONG AB ELKMONT |
|
9 |
353616083334800 |
SLIDE HOLLOW AB ELKMONT |
|
10 |
353708083322200 |
FISH CAMP PRONG AB ELKMONT |
|
11 |
353709083321500 |
LITTLE RIVER AB FISH CAMP PRONG AB ELKMONT |
|
12 |
353958083380500 |
LITTLE RIVER BELOW ELKMONT |
|
13 |
353835083350800 |
JAKES CREEK NEAR ELKMONT |
|
14 |
353900083334900 |
LITTLE RIVER AB ELKMONT |
| Back to 1173-A Contents |
This page maintained by Nichole Bisceglia.
Last updated July 31, 2000.