
Hydrologic Benchmark Network Stations in the Eastern U.S. 1963-95 (USGS Circular 1173-A)
|
|
|
|
|
Holiday Creek near Andersonville, Virginia (Station 02038850)
To download a printer friendly PDF version of this information click here.
This report details one of the approximately 50 stations in the Hydrologic Benchmark Network (HBN) described in the four-volume U.S. Geological Survey Circular 1173. The suggested citation for the information on this page is:
|
Mast, M.A., and Turk, J.T., 1999, Environmental characteristics and water quality of Hydrologic Benchmark Network stations in the Eastern United States, 1963-95: U.S. Geological Survey Circular 1173-A, 158 p. |
All of the tables and figures are numbered as they appear in each circular. Use the navigation bar above to view the abstract, introduction and methods for the entire circular, as well as a map and list of all of the HBN sites. Use the table of contents below to view the information on this particular station.
|
Table of Contents |
| 1. Site Characteristics and Land Use |
| 2. Historical Water Quality Data and Time-Series Trends |
| 3. Synoptic Water Quality Data |
Site Characteristics and Land Use
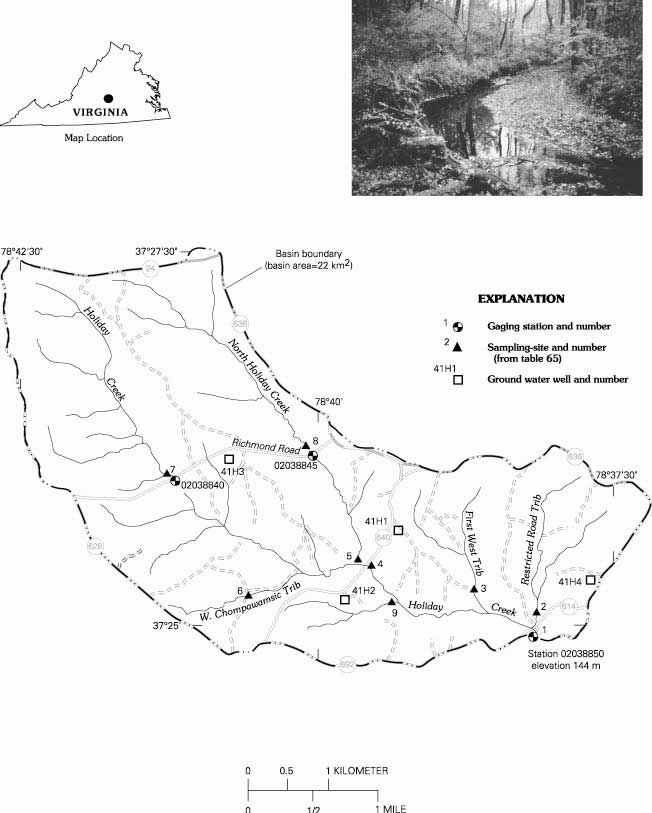
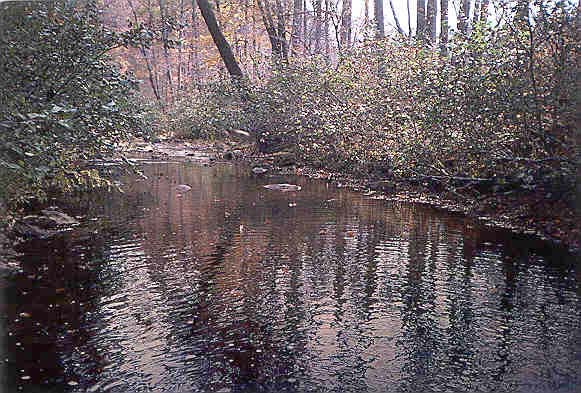
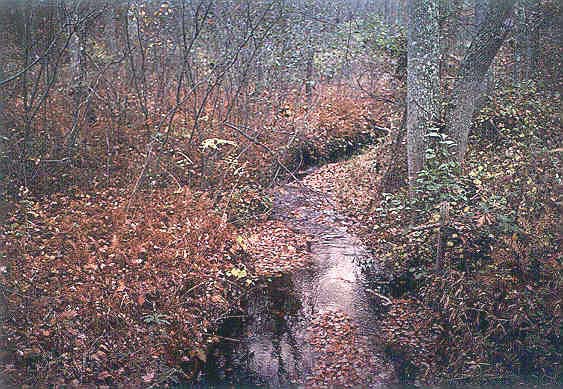
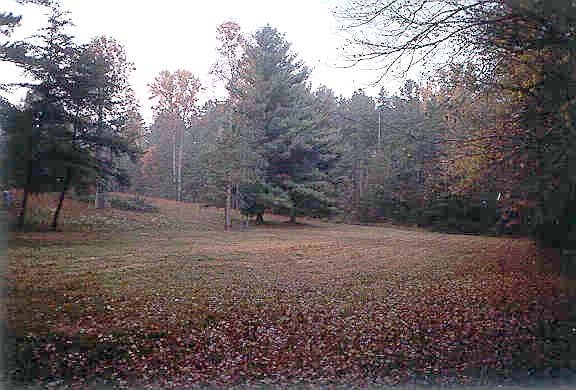
The Holiday Creek HBN Basin is in the Piedmont physiographic province in central Virginia (Figure 32. Map showing study area in the Holiday Creek Basin and photograph of the stream channel of North Holiday Creek ). The topography is undulating to hilly, and the landscape is dissected by numerous small streams. The Holiday Creek Basin drains 22 km² of forested terrain that ranges in elevation from 144 to 280 m. The HBN gage is 2 km north of Holiday Lake State Park at latitude 37°24'55'' and longitude 78°38'10''. Holiday Creek is a southeast-flowing tributary of the Appomattox River and has a channel length of about 8 km upstream from the gage and an average gradient of 11.5 m/km. The main channel is perennial, and mean monthly discharge varies from 0.13 m³/s in July to 0.40 m³/s in March. Average annual runoff was 35 cm from 1966 to 1995 (U.S. Geological Survey, Water Resources Data, Virginia). Climate is characterized by warm summers and relatively mild winters. Average daily air temperatures range from 3.0°C in January to 25.0°C in July (Bullard, 1977). Precipitation averages 105 cm annually and is fairly evenly distributed throughout the year; July and August are the wettest months and October and November are the driest (Bullard, 1977). Average annual snowfall in less than 35 cm and, on average, only 16 days per year have a snow cover of more than 2 cm.
 |
The basin lies in the Southern Mixed Forest ecoregion (Bailey and others, 1994) and is covered by about 60 percent pine forests and 40 percent upland and lowland hardwood communities. The dominant pine species are loblolly pine, Virginia pine, and shortleaf pine; the primary hardwood species are chestnut oak, scarlet oak, red oak, white oak, and yellow poplar. Soils in the basin are mapped in the Tatum and Manteo soil series, which are representative of large areas of the southern Virginia Piedmont [Natural Resources Conservation Service (NRCS), written commun., 1994]. The Tatum series are deep, well-drained residual soils formed from the weathering of gneiss and schist. A typical profile consists of 5 cm of forest litter and 20 cm of brown loam overlying a subsoil of yellowish-red clay and clay loam that extends to a depth of 130 cm. Soils in the Manteo series are steeper and shallower than the Tatum series soils and typically contain as much as 50 percent thin, flat fragments of schist. Soils in both series are acidic and have low cation-exchange capacities. The dominant clay minerals are kaolinite and hydroxy-interlayered vermiculite (Thomas and others, 1989).
Bedrock in the basin consists of complexly folded and highly metamorphosed sedimentary and volcanic rocks of late Precambrian to early Paleozoic age (Marr, 1980). The northern two-thirds of the basin is underlain by phyllites and schists of the Candler Formation. The fine-grained, gray to green phyllites are primarily composed of muscovite, chlorite, and quartz (Ern, 1968). The schists are greenish-brown to tan and contain abundant muscovite and quartz with lesser amounts of plagioclase, chlorite, hematite, magnetite, and pyrite. Rocks of the Chopawamsic Formation underlie the lower one-third of the basin and are generally more mafic than rocks of the Candler Formation. The two dominant rock types comprising the Chopawamsic Formation are a dark-green to gray amphibole gneiss and schist and a biotite-quartz-feldspar gneiss interlayered with amphibole gneiss (Marr, 1980).
 |
The Holiday Creek Basin drains parts of Appomattox and Buckingham Counties, and 70 percent is in the boundaries of the Appomattox-Buckingham State Forest administered by the Virginia Division of Forestry. Privately owned land, which accounts for the remaining 30 percent, is concentrated in the area of the basin north of Richmond Road (fig. 32). Primary and secondary roads trace the entire perimeter of the basin, and several gravel roads traverse the basin. Most unpaved roads in the State Forest are covered with limestone gravel. State Highway 24, which runs along the northern basin divide, is occasionally plowed and salted in winter.
Most areas of the Virginia Piedmont were logged or used for agriculture in the late 1800's and early 1900's. The State forest system was established in the 1950's on abandoned farmland that was originally acquired by the Federal Government in the 1930's. Current land cover in the basin is more than 80 percent forest, and the major land-use activities are timber harvesting and recreation. Forests on State-owned lands are currently managed on a sustained-yield basis of which about 100 ha are subject to cutting or thinning operations each year (Wayne Bowman, Appomattox-Buckingham State Forest, oral commun., 1994). Logging operations on State-owned lands are required to leave 25- to 50-m buffer strips along drainages with flowing water. Since 1990, a large percentage of forests on private land have been harvested and the land has been sold off in 10-ha parcels to real estate developers (Wayne Bowman, oral commun., 1994). Forests in the basin experienced a disproportionate amount of natural disturbance in the early 1990's because of several devastating windstorms, an ice storm, and the southern pine-beetle infestation.
Historical Water-Quality Data and Time-Series Trends
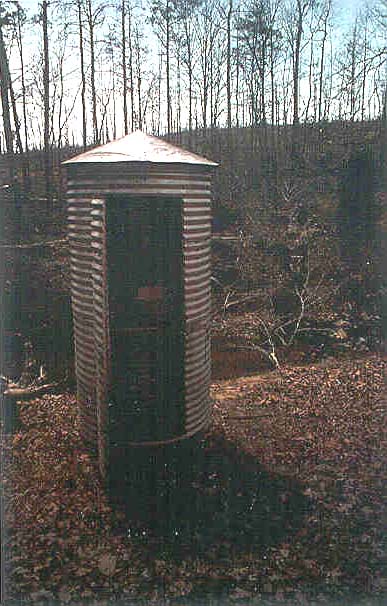
The data set analyzed for this report includes 152 water-quality samples that were collected from October 1967 through July 1995. Nine samples were collected in 1968 and 10 in 1969 and 1970. Sampling frequency was reduced to bimonthly from 1971 through 1982 and quarterly from 1983 through 1995. Water-quality samples were analyzed at a USGS laboratory in Charlottesville, Va., from 1967 through 1972, the USGS Central Laboratory in Atlanta, Ga., from 1973 through 1985, and at the NWQL in Arvada, Colo., from 1986 through 1995. Daily discharge records for Holiday Creek (station 02038850) are available beginning in April 1966. Two partial-record gaging stations, four observation wells, two rain gages, and a number of soil-moisture tubes were installed in the basin in the early 1970's to calculate a hydrologic budget for the basin (wells and secondary gage locations shown in fig. 32). Water-level data for the four observation wells, 41H1 (station 372541078392101), 41H2 (station 372514078394301), 41H3 (station 372608078404601), and 41H4 (station 372519078374001), and maximum discharge at the two partial-record stations, Holiday Creek near Toga (station 02038840) and North Holiday Creek near Toga (station 02038845), are available from NWIS. Water-quality samples were collected from the four observation wells on August 8, 1971. Unpublished precipitation and soil-moisture data are available through the USGS office in Richmond, Va.
 |
Calculated ion balances for 151 samples with complete major-ion analyses are shown in Figures 33a and 33b. Temporal variation of discharge, field pH, major ion concentrations, and ion balance at Holiday Creek, Virginia. Charge balance ranged from -22 to +11 percent, and almost 85 percent of samples had charge balances within the ±10 percent range, indicating the analyses are of good quality. The mean charge balance was -3.2 percent and more than 70 percent of the samples had an excess of measured anions over cations in solution. Laboratory alkalinity in HBN samples was determined by a fixed-endpoint titration to pH 4.5. For waters with low alkalinities, however, the endpoint pH is closer to 5.0, and titration to pH 4.5 may over-estimate alkalinity by as much as 25 meq/L (Barnes, 1964). Alkalinity also was determined by incremental titration in the field beginning in 1992. A comparison of the two alkalinity determinations shows that the fixed endpoint concentrations were, on average, 34 meq/L larger than the incremental concentrations. This discrepancy in the two measurements is similar to the average anion excess of 23 meq/L, suggesting that the fixed-endpoint titration is a reasonable explanation of the negative ion balances.
Time-series plots of the major dissolved constituents were inspected for evidence of method-related effects (fig. 33). Several uncharacteristically high sulfate concentrations were reported during the late 1980's. This pattern coincides with the use of a turbidimetric titration for sulfate analyses at the NWQL between March 1986 and December 1989 (Fishman and others, 1994). In 1989, the NWQL determined that sulfate concentrations can be over-estimated by this technique and changed the method to ion chromatography in 1990 (Office of Water Quality Technical Memorandum No. 90.04, Turbidimetric Sulfate Method, issued December 21, 1989, at URL http://water.usgs.gov/admin/memo/). The bias was most pronounced in dilute waters, although it was not consistent among samples and appeared to be influenced by factors such as color and turbidity (Schertz and others, 1994).
Median concentrations and ranges of major constituents in stream water collected at the HBN gaging station and VWM concentrations in wet-only deposition measured at the Charlottesville NADP station, about 75 km north of the basin, are presented in table 62. Precipitation at the NADP station was dilute and acidic with a VWM pH of 4.3 for 11 years of record. The dominant cations were hydrogen and ammonium, which contributed 68 and 18 percent, respectively, of the total cation charge. The dominant anions were sulfate, which accounted for 61 percent of the anion charge, and nitrite, which accounted for 31 percent. The low pH and predominance of strong acid anions indicates that precipitation at the NADP station probably is affected by anthropogenic emissions of sulfur and nitrogen compounds, which cause acid rain (Likens and others, 1977).
Table 62. Minimum, first quartile, median, third quartile, and maximum values of physical properties and major ion concentrations measured in water-quality samples from Holiday Creek, Virginia, October 1967 through July 1995, and volume-weighted mean concentrations in wet precipitation collected at the Charlottesville Station, Virginia
[Concentrations in units of microequivalents per liter, discharge in cubic meters per second, specific conductance in microsiemens per centimeter at 25 degrees Celsius, and silica in micromoles per liter; n, number of stream samples; VWM, volume-weighted mean; inst., instantaneous; spec. cond., specific conductance at 25 degrees Celsius; <, less than; --, not reported]
|
Parameter |
Stream Water |
Precipitation VMAa |
|||||
|
Minimum |
First quartile |
Median |
Third quartile |
Maximum |
n |
||
| Discharge, inst. |
0.02 |
0.08 |
0.16 |
0.24 |
3.1 |
152 |
-- |
| Spec. cond., field |
22 |
32 |
36 |
39 |
150 |
151 |
-- |
| pH, field |
5.0 |
6.6 |
6.8 |
7.1 |
7.9 |
151 |
4.3b |
| Calcium |
35 |
110 |
120 |
150 |
270 |
150 |
3.7 |
| Magnesium |
25 |
81 |
91 |
99 |
210 |
150 |
1.8 |
| Sodium |
43 |
100 |
120 |
130 |
250 |
151 |
4.9 |
| Potassium |
5.0 |
13 |
15 |
21 |
61 |
150 |
.7 |
| Ammonium |
<.7 |
<.7 |
.7 |
2.1 |
11 |
62 |
13 |
| Alkalinity, laboratory |
100 |
220 |
260 |
320 |
420 |
151 |
-- |
| Sulfate |
15 |
42 |
58 |
79 |
180 |
151 |
46 |
| Chloride |
17 |
45 |
51 |
63 |
190 |
150 |
6.1 |
| Nitrite plus nitrate |
<.7 |
3.6 |
7.1 |
7.1 |
22 |
97 |
23c |
| Silica |
43 |
180 |
200 |
220 |
380 |
152 |
-- |
a Values are volume-weighted mean concentrations for 1984-94.
b Laboratory pH.
c Nitrate only.
Stream water in Holiday Creek was dilute and weakly buffered; total ionic constituents ranged from 450 to 1,200 meq/L, and alkalinities were generally between 220 to 320 meq/L. The major cations in stream water were calcium and sodium and the major anion was alkalinity. Dissolved cations, alkalinity, and silica in stream water are most likely derived from the weathering of silicate minerals in the underlying phyllite and schist. The median chloride concentration in stream water was 51 meq/L, which is 6.5 times larger than the VWM concentration of 6.1 meq/L in precipitation. Based on the difference between annual precipitation and runoff, evapotranspiration can account for about a threefold increase in the concentration of precipitation, indicating that some chloride in stream water is contributed from sources other than precipitation. Additional sources of stream-water chloride might include dry deposition of marine aerosols or possibly deicing salts applied to Highway 24. In addition, the bedrock contains considerable amounts of biotite and hornblende, both of which can contribute small amounts of chloride to surface waters (Peters, 1991). Median sulfate concentration of stream water was 58 meq/L compared to 46 meq/L in precipitation and was somewhat smaller than expected considering the concentrating effects of evapotranspiration and additional inputs of sulfate from dry deposition, indicating some sulfate is retained in the basin. Sulfate retention probably occurs by adsorption on pedogenic iron and aluminum oxides that are common in the highly weathered soils of the Southeast (Rochelle and Church, 1987; Shanley, 1992). Concentrations of inorganic nitrogen species in stream water were well below the average concentration in precipitation at all discharge levels, indicating that most atmospheric nitrogen is retained by vegetation and soils in the basin.
The solute composition of stream water was further evaluated by analyzing correlations between solutes and stream discharge (table 63). The weathering-derived constituents had strong negative correlations with discharge. These results are consistent with a hydrologic system where weathering-enriched base flow is diluted by waters from shallower sources during periods of high flow. Among the ions, the strongest correlations were found between the base cations, alkalinity, and silica. These associations support the idea that weathering of silicate minerals is the primary source of solutes in stream water. The lack of correlations with sulfate and chloride provides additional evidence that these ions are derived primarily from atmospheric sources.
Table 63. Spearman rank correlation coefficients (rho values) showing the relation among discharge, pH, and major ion concentrations, Holiday Creek, Virginia, 1980 through 1995
[Q, discharge; Ca, calcium; Mg, magnesium; Na, sodium; K, potassium; Alk, alkalinity; SO4, sulfate; Cl, chloride; Si, silica]
|
|
Q |
pH |
Ca |
Mg |
Na |
K |
Alk |
SO4 |
Cl |
| pH |
-0.237 |
|
|
|
|
|
|
|
|
| Ca |
-.786 |
0.204 |
|
|
|
|
|
|
|
| Mg |
-.756 |
.151 |
0.789 |
|
|
|
|
|
|
| Na |
-.841 |
.286 |
.739 |
0.813 |
|
|
|
|
|
| K |
-.278 |
-.029 |
.371 |
.317 |
0.190 |
|
|
|
|
| Alk |
-.862 |
.328 |
.821 |
.769 |
.846 |
0.253 |
|
|
|
| SO4 |
.143 |
-.295 |
-.150 |
-.043 |
-.197 |
.035 |
-0.304 |
|
|
| Cl |
.283 |
-.050 |
-.240 |
-.182 |
-.161 |
.228 |
-.274 |
-0.015 |
|
| Si |
-.832 |
.340 |
.645 |
.663 |
.755 |
.255 |
.756 |
-.194 |
-0.083 |
Results of the seasonal Kendall test for trends in discharge and major dissolved constituents are shown in table 64. A statistically significant downward trend was detected in both the unadjusted and flow-adjusted calcium concentrations at the 0.01 confidence level. Downward trends also were detected in the flow-adjusted potassium and chloride concentrations. The downward trend in potassium is extremely small [<-0.1 (meq/L)/yr] and amounts to a decrease of less than 3 meq/L during the entire period of record. The LOWESS curve in figure 33 shows that most of the decrease in calcium concentrations occurred in the late 1960's and early 1970's, and since then concentrations have remained relatively constant (fig. 33). Although not shown, the flow-adjusted chloride concentrations showed a similar pattern of slightly elevated concentrations in the early part of the record, followed by relatively constant concentrations through the remainder of the record. The cause of these trends in stream-water calcium and chloride concentrations in the early part of the record could not be identified. The only change in land use that occurred in the early 1970's was the requirement that logging companies leave buffer strips of vegetation along any drainages with flowing water (Wayne Bowman, oral commun., 1994). Changes also may have occurred in acidic deposition and road salting; however, it is unlikely that these factors would have affected the stream-water concentrations of chloride and calcium without affecting the concentrations of other constituents as well. Alternatively, chloride and calcium concentrations may have been affected by method-related activities, the most likely being a change of analytical laboratory in 1973.
Table 64. Results of the seasonal Kendall test for trends in discharge and unadjusted and flow-adjusted pH and major ion concentrations, Holiday Creek, Virginia, October 1967 through July 1995
[Trends in units of microequivalents per liter per year, except discharge in cubic meters per second per year, pH in standard units per year, and silica in micromoles per liter per year; <, less than; --, not calculated]
|
Parameter |
Unadjusted |
Flow adjusted |
||
|
Trend |
p-value |
Trend |
p-value |
|
| Discharge |
<0.01 |
0.315 |
-- |
-- |
| pH, field |
.01 |
.195 |
0.01 |
0.102 |
| Calcium |
-1.1 |
.002 |
-.8 |
.006 |
| Magnesium |
<.1 |
.466 |
.2 |
.152 |
| Sodium |
<.1 |
.234 |
<-.1 |
.848 |
| Potassium |
<.1 |
.019 |
<-.1 |
.006 |
| Alkalinity, laboratory |
<.1 |
.321 |
.1 |
.810 |
| Sulfate |
-.1 |
.692 |
-.5 |
.219 |
| Chloride |
-.3 |
.033 |
-.4 |
.012 |
| Nitrite plus nitrate |
(a) |
-- |
-- |
-- |
| Silica |
<.1 |
.474 |
.3 |
.223 |
a Insufficient data to calculate trend.
Synoptic Water-Quality Data
Results of the surface-water synoptic sampling of October 24, 1991, are presented in table 65; locations of sampling sites are shown in figure 32. Discharge at the gage was 0.08 m³/s compared to the median daily discharge of 0.09 m³/s for October (Lawrence, 1987), indicating the basin was sampled during base-flow conditions for that time of year. Solute concentrations measured at the gage (site 1) during the synoptic sampling were generally between the first- and third- quartile concentrations reported for the gage during the entire period of record (table 62). All tributary streams were similar in composition to the gage, with calcium and sodium the dominant cations and alkalinity the dominant anion. Ion balances ranged from 1.6 to 8.3 percent, indicating unmeasured organic anions appeared to be an important component of stream water during the sampling period.
 |
Surface-water chemistry of the tributary streams varied in a pattern that appears to reflect the underlying bedrock type. Streams that drain the Chopawamsic Formation (sites 2, 3, 6, and 9) had higher concentrations of weathering-derived solutes than streams that drain the Candler Formation (sites 4, 5, 7, and 8). For example, the average alkalinity of sites 2, 3, 6, and 9 was 400 meq/L compared to the average alkalinity of 170 meq/L for sites 4, 5, 7, and 8. A similar pattern was observed for calcium and silica concentrations, which were consistently higher at sites 2, 3, 6, and 9 than at sites 4, 5, 7, and 8. In addition to differences in concentrations, streams that drain the Chopawamsic Formation had higher calcium-to-sodium ratios (1.8) than streams that drain the Candler Formation, which had an average ratio of 0.8. As discussed previously, rocks in the Candler Formation are composed primarily of felsic minerals, and rocks of the Chopawamsic Formation are more mafic in composition. The larger concentrations of calcium, alkalinity, and silica at sites 2, 3, 6, and 9 probably reflect the higher weathering rates of mafic minerals in the Chopawamsic Formation compared to the more felsic plagioclase and muscovite in the Candler Formation. The differences in cation ratios among the streams also reflect this difference in bedrock mineralogy. The lower calcium-to-sodium ratios at sites 4, 5, 7, and 8 are indicative of weathering of sodium-rich plagioclase, whereas the higher ratios at sites 2, 3, 6, and 9 reflect the abundance of calcium-rich minerals, such as amphibole.
Table 65. Physical properties and major ion concentrations from surface-water sampling sites in the Holiday Creek Basin, Virginia, October 24, 1991
[Site locations shown on fig. 32; Q, discharge in cubic meters per second; SC, specific conductance in microsiemens per centimeter at 25 degrees Celsius; pH in standard units; Ca, calcium; Mg, magnesium; Na, sodium; K, potassium: Alk, alkalinity; SO4, sulfate; Cl, chloride; NO3, nitrate; concentrations in microequivalents per liter; Si, silica in micromoles per liter; Fm, Formation; <, less than; --, not measured]
|
Site |
Station number |
Q |
SC |
pH |
Ca |
Mg |
Na |
K |
Alk |
SO4 |
Cl |
NO3 |
Si |
Criteriaa |
Remarks |
|
1 |
02038850 |
0.093 |
36 |
7.1 |
130 |
88 |
120 |
26 |
260 |
27 |
45 |
<0.7 |
220 |
|
|
|
2 |
372512078403500 |
-- |
32 |
6.6 |
110 |
64 |
130 |
26 |
230 |
27 |
34 |
<.7 |
250 |
BG | Chompawamsic Fm |
|
3 |
372510078392100 |
.003 |
45 |
7.0 |
160 |
96 |
150 |
41 |
360 |
27 |
39 |
<.7 |
320 |
BG | Chompawamsic Fm |
|
4 |
372524078393600 |
.048 |
29 |
6.7 |
90 |
74 |
100 |
23 |
190 |
23 |
42 |
<.7 |
180 |
BG | Candler Fm |
|
5 |
372525078393900 |
.019 |
29 |
6.7 |
95 |
70 |
96 |
24 |
190 |
23 |
39 |
<.7 |
180 |
MT, BG | Candler Fm |
|
6 |
372514078384100 |
.006 |
49 |
7.0 |
180 |
110 |
170 |
33 |
410 |
21 |
42 |
<.7 |
350 |
BG | Chompawamsic Fm |
|
7 |
372559078411300 |
.019 |
23 |
6.7 |
55 |
69 |
87 |
15 |
140 |
16 |
45 |
<.7 |
150 |
BG, LU | Candler Fm, logging |
|
8 |
372608078400400 |
.012 |
25 |
6.6 |
60 |
64 |
87 |
20 |
150 |
21 |
39 |
<.7 |
160 |
BG, LU | Candler Fm, logging |
|
9 |
372501078380900 |
.005 |
72 |
7.3 |
260 |
210 |
230 |
49 |
610 |
42 |
65 |
<.7 |
380 |
BG | Chompawamsic Fm |
aCriteria used in selection of sampling sites: BG = bedrock geology, MT = major tributary, LU = land use.
References Cited
Bailey, R.G., Avers, P.E., King, T., and McNab, W.H., eds., 1994, Ecoregions and subregions of the United States with supplementary table of map unit descriptions: Washington, D.C., U.S. Department of Agriculture Forest Service, scale 1:7,500,000 (also at URL http://www.fs.fed.us/land/ecosysmgmt/ecoreg1_home.html).
Barnes, Ivan, 1964, Field measurement of alkalinity and pH: U.S. Geological Survey Water-Supply Paper 1535-H, 17 p.
Bullard, C.F., Jr., 1977, Soil survey of Campbell County and City of Lynchburg, Virginia: U.S. Department of Agriculture Soil Conservation Service, 121 p.
Ern, E.H., 1968, Geology of Buckingham quadrangle, Virginia: Virginia Division of Mineral Resources, Report of Investigations 15, 45 p., scale 1:24,000.
Fishman, M.J., Raese, J.W., Gerlitz, C.N., and Husband, R.A., 1994, U.S. Geological Survey approved inorganic and organic methods for the analysis of water and fluvial sediment, 1954-94: U.S. Geological Survey Open-File Report 94-351, 55 p.
Lawrence, C.L., 1987, Streamflow characteristics at hydrologic bench-mark stations: U.S. Geological Survey Circular 941, 123 p.
Likens, G.E., Bormann, F.H., Pierce, R.S., Eaton, J.S., and Johnson, N.M., 1977, Biogeochemistry of a forested ecosystem: New York, Springer-Verlag, 146 p.
Marr, J.D., Jr., 1980, Geology of the Andersonville quadrangle, Virginia: Virginia Division of Mineral Resources, scale 1:24,000.
Peters, N.E., 1991, Chloride cycling in two forested lake watersheds in the west-central Adirondack Mountains, New York, U.S.A.: Water, Air, and Soil Pollution, v. 59, p. 201-215.
Rochelle, B.P., and Church, M.R., 1987, Regional patterns of sulfate retention in watersheds of the eastern U.S.: Water, Air, and Soil Pollution, v. 33, p. 61-73.
Schertz, T.L., Wells, F.C., and Ohe, D.J., 1994, Sources of trends in water-quality data for selected streams in Texas, 1975-89 water years: U.S. Geological Survey Water-Resources Investigation 94-4213, 49 p.
Shanley, J.B., 1992, Sulfate retention and release in soils at Panola Mountain, Georgia: Soil Science, v. 154, no. 6, p. 499-508.
Thomas, P.J., Baker, J.C., and Simpson, T.W., 1989, Variability of the Cecil Map Unit in Appomattox County, Virginia: Journal of Soil Science Society of America, v. 53, p. 1470-1474.
U.S. Geological Survey, published annually, Water resources data, Virginia, Richmond: U.S. Geological Survey Water Data Report.
Appendix A. List of Map References
a. U.S. Geological Survey topographic maps:
- Andersonville, Virginia (1: 24,000)
- Holiday Lake, Virginia (1: 24,000), gaging station on this quadrangle
- Appomattox, Virginia (1: 100,000)
b. Geologic maps:
- Marr, J.D., Jr., 1980, Geology of the Andersonville quadrangle, Virginia: Virginia Division of Mineral Resources, scale 1: 24,000.
c. Soil surveys:
- U.S. Department of Agriculture, in press, Soil survey of Appomattox County, Virginia: U.S. Department if Agriculture Soil Conservation Service.
Appendix B. NWIS Site-Identification Numbers
Table B-1. NWIS site identification numbers and site names for water-quality sampling sites.
|
Site |
Identification Number |
Site Name |
|
1 |
02038850 |
HOLIDAY CREEK NEAR ANDERSONVILLE, VIRGINIA |
|
2 |
372512078403500 |
RESTRICTED ROAD TRIBUTARY NEAR ANDERSONVILLE, VIRGINIA |
|
3 |
372510078392100 |
FIRST W TRIBUTARY NEAR ANDERSONVILLE, VIRGINIA |
|
4 |
372524078393600 |
HOLIDAY CREEK AT STATE ROAD 640 NEAR ANDERSONVILLE, VIRGINIA |
|
5 |
372525078393900 |
N HOLIDAY CREEK AT MOUTH NEAR ANDERSONVILLE, VIRGINIA |
|
6 |
372514078384100 |
WEST CHOMPAWAMSIC CREEK NEAR ANDERSONVILLE, VIRGINIA |
|
7 |
372559078411300 |
HOLIDAY CREEK AT OLD RICHMOND ROAD NEAR ANDERSONVILLE, VIRGINIA |
|
8 |
372608078400400 |
N HOLIDAY CREEK AT OLD RICHMOND ROAD NEAR ANDERSONVILLE, VIRGINIA |
|
9 |
372501078380900 |
EAST CHOMPAWAMSIC CREEK NEAR ANDERSONVILLE, VIRGINIA |