
Hydrologic Benchmark Network Stations in the Midwestern U.S. 1963-95 (USGS Circular 1173-B)
|
|
|
|
|
Cossatot River near Vandervoort, Arkansas (Station 07340300)
To download a printer friendly PDF version of this information click here.
This report details one of the approximately 50 stations in the Hydrologic Benchmark Network (HBN) described in the four-volume U.S. Geological Survey Circular 1173. The suggested citation for the information on this page is:
|
Mast, M.A., and Turk, J.T., 1999, Environmental characteristics and water quality of Hydrologic Benchmark Network stations in the Midwestern United States, 1963-95: U.S. Geological Survey Circular 1173-B, 130 p. |
All of the tables and figures are numbered as they appear in each circular. Use the navigation bar above to view the abstract, introduction and methods for the entire circular, as well as a map and list of all of the HBN sites. Use the table of contents below to view the information on this particular station.
|
Table of Contents |
| 1. Site Characteristics and Land Use |
| 2. Historical Water Quality Data and Time-Series Trends |
| 3. Synoptic Water Quality Data |
Site Characteristics and Land Use
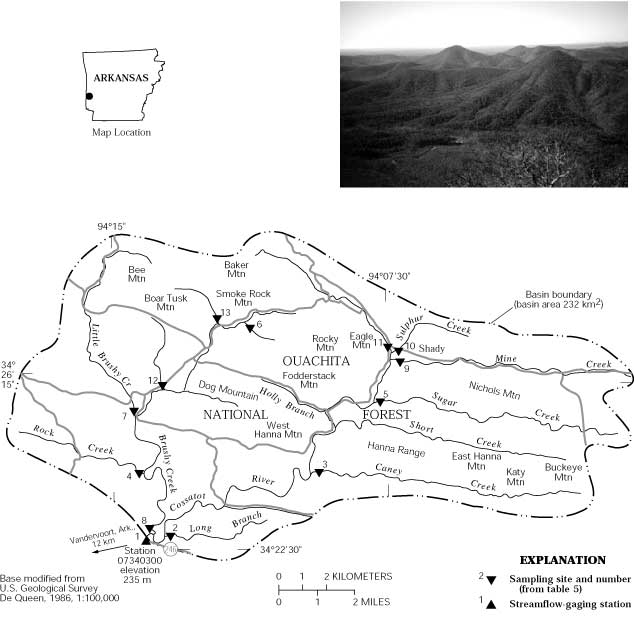
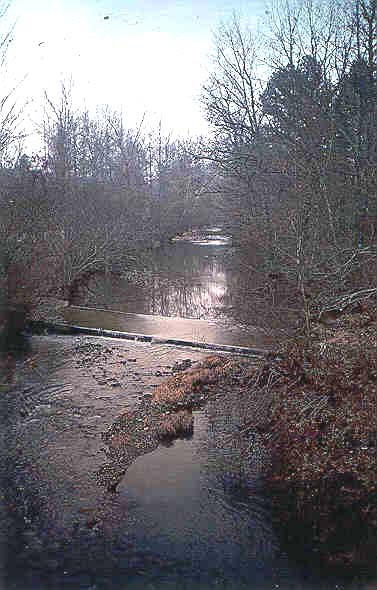
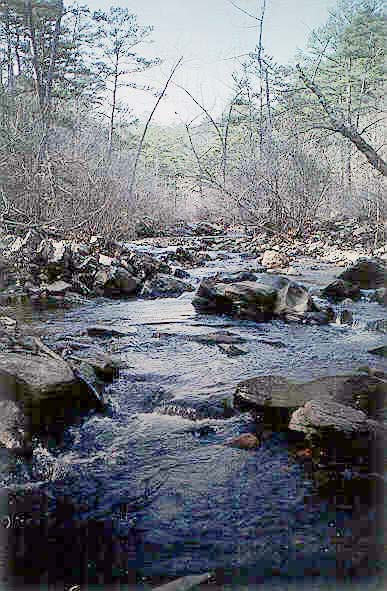
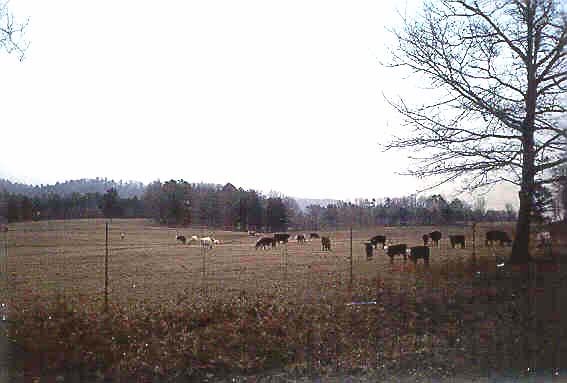
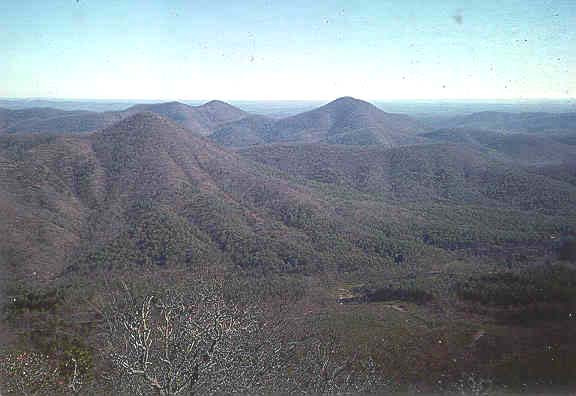
The Cossatot River HBN Basin is in the Ouachita Mountains section of the Ouachita physiographic province in west-central Arkansas (Figure 2. Map showing study area in the Cossatot River Basin and photograph of the landscape of the basin). The 232-km² basin ranges in elevation from 235 to 680 m and drains a landscape of long east-west-trending even-crested ridges separated by narrow flat- bottomed stream valleys. The USGS gaging station is located 12 km east of the town of Vandervoort, Ark., at latitude 34×22'46'' and longitude 94×14'08''. The Cossatot River flows south into the Little River, a tributary of the Red River, and has a channel length of about 30 km upstream from the gaging station and an average stream gradient of 5.6 m/km. Mean monthly discharge varies from 0.84 m³/s in August to 10.5 m³/s in March, and average annual runoff from the basin was 78 cm from 1967 through 1995 (Porter and others, 1996). Streamflow is highly variable during storms because of surface runoff from steep hillslopes in the basin but is well sustained by springs during periods of low rainfall. The climate is characterized as subtropical with hot, humid summers and mild winters (U.S. Department of Agriculture, 1990c). Average daily air temperatures range from 5.0×C in January to 27.2×C in July. Average annual precipitation is about 130 cm with rainfall in March, April, and May accounting for 40 percent of the annual precipitation (Freiwald, 1985).
 |
The basin is located in the Southeastern Mixed Forest ecoregion (Bailey and others, 1994), and vegetation is dominated by second growth (50 to 70 years old) pine and oak vegetation types (U.S. Department of Agriculture, 1990c). Drier south- and west-facing slopes are dominated by shortleaf pine and minor amounts of loblolly pine. Pines and hardwoods grow together on wetter north- and east-facing slopes. The predominant hardwood species are white oak, black oak, post oak, blackjack oak, black hickory, pignut hickory, and mockernut hickory. Stunted scrubby pines and hardwoods, which are interspersed with mosses and lichens, cover large expanses of exposed novaculite bedrock on the ridgetops. Vegetation along the flood plain includes alder, sycamore, sweetgum, and river birch. Soils in the basin are classified as Ultisols and Inceptisols and are mapped in the Sherwood-Pickens-Rock Land soil association (Hoelscher and others, 1975). The Sherwood series is mapped along the ridgetops and includes well-drained soils developed in interbedded sandstone and shale. A typical soil profile has a surface layer of yellowish-brown fine sandy loam that is 20 cm thick overlying a subsoil of yellowish-red sandy clay loam that extends to a depth of 70 cm. These soils have low base saturation (9 to 19 percent), low soil pH (4.8 to 4.9), and low organic-matter content (0.3 to 2.3 percent) (Hoelscher and others, 1975). The Pickens series includes shallow, well-drained soils on hillslopes. A typical profile has a surface layer of dark grayish-brown shaly sandy loam that is 15 cm thick overlying a subsoil of yellowish-brown shaly sandy loam that extends to a depth of 30 cm. The Rock Land series includes shallow (2 to 10 cm), acidic loams directly overlying sandstone and novaculite on the crests and sideslopes of steep ridges.
The Ouachita Mountains are formed by sedimentary rocks of Paleozoic age that have been intensely deformed into a series of east-west-trending, tightly folded anticlines and synclines that strongly control the local topography (Miser and Purdue, 1929; Ericksen and others, 1983). The Paleozoic units in the basin include, from oldest to youngest, the Bigfork Chert, Polk Creek Shale, Blaylock Sandstone, Missouri Mountain Shale, Arkansas Novaculite, and Stanley Shale. The Bigfork Chert, which crops out in the eastern part of the Sugar Creek subbasin, consists of gray to black chert with finely disseminated grains of calcite. The Blaylock Sandstone and Stanley Shale are the most common units along the valley floors. The Stanley Shale is a black shale with sandstone interbeds and the Blaylock Sandstone is a gray quartzitic sandstone. The Arkansas Novaculite is a highly fractured, thermally metamorphosed chert that forms most of the topographic ridges because of its resistance to weathering. The Arkansas Novaculite and Bigfork Chert are important sources of water to springs in the area, which contribute locally to the base flow of streams (Ludwig, 1992). Some rocks in the area contain small deposits of metallic and industrial minerals. For example, the Arkansas Novaculite contains deposits of manganese oxide and veins of barite, and the Bigfork Chert, Missouri Mountain Shale, and Stanley Shale locally contain sulfide-bearing veins. Many inactive manganese mines are in the basin, some of which were operated until the late 1950's (Cole and Morris, 1986).
 |
The Cossatot River drains the southern part of Polk County of Arkansas and is entirely in the boundaries of the Mena Ranger District of the Ouachita National Forest. About 40 km², or 17 percent, of National Forest land in the Caney Creek and Short Creek drainages also is in the boundaries of the Caney Creek Wilderness. Privately owned lands, which are concentrated along the main channel of the Cossatot River and the Sugar Creek tributary, account for 13 percent of land in the basin (J.A. Clingenpeel, U.S. Department of Agriculture Forest Service, written commun., 1997). More than 200 km of National Forest and county roads traverse the basin, paralleling the upper two-thirds of the main Cossatot River channel as well as most of the major tributaries. Because of infrequent snow or ice, there is no salting or plowing of roads in the basin (J.A. Clingenpeel, written commun., 1997). The Caney Creek Wilderness is accessible from a well-maintained foot trail along Caney Creek and an unmaintained foot trail that follows an abandoned road along Short Creek.
Land cover in the Cossatot River Basin is 99.5 percent forest and 0.5 percent pasture and residential land (J.A. Clingenpeel, written commun., 1997). The major land-use activities on National Forest land are timber harvesting and recreation. Through the 1980's, the U.S. Department of Agriculture Forest Service (Forest Service) used clearcutting as the primary harvest method (J.A. Clingenpeel, written commun., 1997). Since 1990, forests have been managed by using a combination of even-aged and uneven-aged silvicultural systems. Thinning, single-tree selection, and shelter woods are the main harvesting techniques. Privately and commercially owned lands continue to be harvested by clearcutting. Other human-related features in the basin include rural residences, hunting cabins, the community of Shady (population 100), and strips of pasture land bordering the streams, as along many streams in the Ouachita Mountains. The only major change in land use in the basin during the past 30 years was the designation of the Caney Creek Wilderness in 1975. Two segments of the Cossatot River, totaling 30 km, are currently being studied for possible designation as components of the National Wild and Scenic Rivers System (U.S. Department of Agriculture, 1990c). In the early 1990's, the Forest Service conducted a number of studies in the Brushy Creek and Caney Creek subbasins to evaluate the cumulative effect of forest management practices on physical, chemical, and biological characteristics of streams in the Ouachita National Forest. Preliminary results of these studies are summarized in Clingenpeel (1994).
Historical Water-Quality Data and Time-Series Trends
The data set for the Cossatot River HBN Station analyzed for this report includes 59 water-quality samples that were collected from November 1985 through October 1995 on a bimonthly schedule. Water-quality records also are available for an additional nine samples that were collected in 1967, 1968, and 1984 before the inclusion of the station in the HBN. All water-quality samples that were collected after 1985 were analyzed at the NWQL in Arvada, Colo. Daily discharge records are available for the Cossatot River (station 07340300) beginning in June 1967.
Calculated ion balances for 59 samples with complete major-ion analyses are shown in Figures 3a and 3b. Temporal variation of discharge, field pH, major ion concentrations, and ion balance at the Cossatot River, Arkansas. Ion balances ranged from -16 to 8 percent, and 85 percent of samples had values in the ±10 percent range, indicating that the analytical measurements were of good quality. Almost 85 percent of samples had negative ion balances, indicating an excess of measured anions over cations in solution. Because stream water at this station generally has low alkalinity, the apparent anion excess may be due to an overestimation of laboratory alkalinity by the fixed endpoint titration to pH 4.5 (Office of Water Quality Technical Memorandum No. 80.27, New Parameter Codes for pH, Alkalinity, Specific Conductance, and Carbonate/Bicarbonate, issued September 19, 1980, at URL http://water.usgs.gov/admin/memo/, accessed 1997). In low
 |
Median concentrations and ranges of major constituents in stream water at the Cossatot River Station and VWM concentrations in wet-only deposition measured at the Caddo Valley NADP Station are listed in table 2. Precipitation chemistry at the NADP station, which is located about 110 km southeast of the HBN station, was dilute and slightly acidic with a VWM pH of 4.7 for 13 years of record. The predominant cations were hydrogen, which composed 44 percent of the total cation charge, and ammonium, which accounted for 22 percent. Sulfate accounted for 56 percent of the total anions, whereas nitrate contributed 30 percent and chloride contributed 14 percent. These results indicate that precipitation at the nearby NADP station may be affected by anthropogenic emissions of sulfur and nitrogen compounds, which cause acid rain (Likens and others, 1977).
Table 2. Minimum, first quartile, median, third quartile, and maximum values of physical properties and major dissolved constituents measured in water-quality samples from the Cossatot River, Arkansas, November 1985 through October 1995, and volume-weighted mean concentrations in wet precipitation collected at the Caddo Valley Station, Arkansas
[Concentrations in units of microequivalents per liter, discharge in cubic meters per second, specific conductance in microsiemens per centimeter at 25 degrees Celsius, pH in standard units, and silica in micromoles per liter; n, number of stream samples; VWM, volume-weighted mean; inst., instantaneous; spec. cond., specific conductance; <, less than; --, not reported]
|
Parameter |
Stream Water |
Precipitation VMAa |
|||||
|
Minimum |
First quartile |
Median |
Third quartile |
Maximum |
n |
||
| Discharge, inst. |
0.071 |
0.62 |
1.8 |
5.1 |
35.7 |
59 |
-- |
| Spec. cond., field |
20 |
30 |
38 |
69 |
73 |
59 |
13 |
| pH, field |
6.4 |
7.0 |
7.3 |
7.5 |
8.8 |
59 |
4.7b |
| Calcium |
65 |
100 |
170 |
320 |
420 |
59 |
5.9 |
| Magnesium |
50 |
72 |
96 |
130 |
160 |
59 |
2.1 |
| Sodium |
57 |
70 |
78 |
91 |
130 |
58 |
6.4 |
| Potassium |
5.1 |
15 |
18 |
18 |
23 |
57 |
.8 |
| Ammonium |
<.7 |
<.7 |
2.1 |
2.7 |
14 |
34 |
10 |
| Alkalinity, laboratory |
100 |
170 |
260 |
440 |
560 |
59 |
-- |
| Sulfate |
15 |
63 |
73 |
96 |
170 |
59 |
26 |
| Chloride |
25 |
39 |
48 |
56 |
140 |
59 |
6.6 |
| Nitrite plus nitrate |
<3.6 |
<3.6 |
<7.1 |
<7.1 |
8.6 |
58 |
14c |
| Silica |
88 |
120 |
130 |
140 |
160 |
59 |
-- |
a Data are volume-weighted mean concentrations for 1984-95.
b Laboratory pH.
c Nitrate only.
Stream water in the Cossatot River is dilute and weakly buffered; specific conductance ranged from 20 to 73 mS/cm, and alkalinity was between 100 and 560 meq/L (table 2). The major ions in stream water were calcium, magnesium, and bicarbonate, which are attributed to the dissolution of carbonate minerals in the underlying sedimentary rocks. The median concentration of chloride in stream water was 48 meq/L, which is about seven times greater than the VWM concentration of 6.6 meq/L in precipitation. On the basis of the difference between annual precipitation and runoff, evapotranspiration can account for roughly a threefold increase in the concentration of precipitation, indicating that stream-water chloride is derived from sources other than precipitation. Additional sources of stream-water chloride might include salts in the marine sedimentary rocks or, perhaps, septic drainfields or runoff from pasture land along the drainages. The median concentration of sulfate in stream water was 73 meq/L compared to 26 meq/L in precipitation. This difference in concentration can be largely accounted for by evapotranspiration, indicating that stream-water sulfate is derived primarily from precipitation and behaves fairly conservatively in the basin. Conservative sulfate behavior also was reported by Nix and others (1988) who studied chemical budgets in two small, forested basins in southwestern Arkansas. The low concentrations of nitrate and of ammonium in stream water compared to precipitation indicate that nitrogen is strongly retained by soils and vegetation in the basin. In addition, the low stream-water nitrogen concentrations indicate that strips of grazing land bordering the streams do not seem to greatly affect the nutrient composition of stream water at the HBN station.
 |
The solute composition of stream water was further evaluated by analyzing correlations between dissolved constituents and stream discharge (table 3). Most dissolved constituents were inversely correlated with discharge, particularly calcium (rho = -0.945), magnesium (rho = -0.920), and alkalinity (rho = -0.940). The exception was silica, which had a strong positive correlation with discharge (rho = 0.642). The distribution of different sedimentary units in the basin may provide a possible explanation for the opposite behavior of silica and the other major weathering products. In general, the stream valleys tend to be cut into the less resistant shale units, whereas the hillslopes and ridges are formed by the resistant novaculite. Limestone layers, which are in most of the shale units, are the most likely source of calcium, magnesium, and alkalinity in stream water. In contrast, the novaculite is depleted in carbonate minerals but is rich in microcrystalline quartz, which probably is a substantial source of stream-water silica. One possible result of this topographic distribution of rock types is that during low-flow conditions, discharge is primarily supplied by carbonate-rich water from the underlying shales. During high-flow conditions, however, there probably is a larger contribution of runoff from the hillslopes and ridges, which may produce water enriched in dissolved silica.
Table 3. Spearman rank correlation coefficients (rho values) showing the relation among discharge, pH, and major dissolved constituents, Cossatot River, Arkansas, 1986-95
[Q, discharge; Ca, calcium; Mg, magnesium; Na, sodium; K, potassium; Alk, alkalinity; SO4, sulfate; Cl, chloride; Si, silica]
|
|
Q |
pH |
Ca |
Mg |
Na |
K |
Alk |
SO4 |
Cl |
| pH |
-0.166 |
|
|
|
|
|
|
|
|
| Ca |
-.945 |
0.132 |
|
|
|
|
|
|
|
| Mg |
-.920 |
.154 |
0.977 |
|
|
|
|
|
|
| Na |
-.776 |
.020 |
.805 |
0.817 |
|
|
|
|
|
| K |
-.395 |
-.120 |
.407 |
.482 |
0.318 |
|
|
|
|
| Alk |
-.940 |
.205 |
.976 |
.953 |
.781 |
0.376 |
|
|
|
| SO4 |
-.324 |
-.149 |
.383 |
.404 |
.462 |
.342 |
0.290 |
|
|
| Cl |
-.696 |
-.017 |
.700 |
.692 |
.747 |
.384 |
.665 |
0.496 |
|
| Si |
.642 |
-.035 |
-.690 |
-.640 |
-.421 |
-.367 |
-.707 |
-.283 |
-0.550 |
Results of the seasonal Kendall test for trends in discharge and major dissolved constituents from 1986 through 1995 are listed in table 4. Trends were calculated for only 10 years because the station was not added to the HBN until 1986. Statistically significant downward trends were observed in the unadjusted sodium, potassium, sulfate, and chloride concentrations at the 0.01 probability level. Results were similar for unadjusted and flow-adjusted sodium, sulfate, and chloride concentrations, indicating that these trends were not caused by variations in stream discharge. After flow adjustment, a statistically significant downward trend also was detected in the magnesium concentrations. The LOWESS curves in figure 3 show that the sulfate trend was primarily caused by elevated sulfate concentrations in the late 1980's. In contrast, the declines in sodium, potassium, and chloride concentrations have been more gradual during the period of record. Trends in stream chemistry at this station may reflect changes in environmental factors, such as precipitation chemistry or land-use activities. Lynch and others (1995) reported significant declines in calcium, magnesium, and sulfate concentrations in precipitation at a nearby NADP station in Arkansas from 1982 through 1990. Although the downward trends in stream-water sulfate and magnesium were consistent with trends in atmospheric deposition, the trend in flow-adjusted sulfate concentrations [-4.5 (meq/L)/yr] was significantly larger than the decrease in flow-adjusted magnesium [-1.2 (meq/L)/yr] and, in addition, no significant trend was detected in stream-water calcium. Declines in stream-water chloride, sodium, and potassium probably cannot be attributed to changes in atmospheric deposition on the basis of results from Lynch and others (1995), but may reflect human activities upstream from the gaging station. Although the basin is primarily forested, there is pasture land and a number of rural residential areas along the main river channel and major tributaries that may affect the concentrations of these ions. Method-related factors also may be responsible for the stream-water trends, particularly for sulfate. Elevated sulfate concentrations before 1990 were coincident with a period when sulfate was determined by turbidimetric titration method, which often introduced a positive bias in sulfate concentrations, particularly in dilute water. Although how much the method elevated sulfate concentrations before 1990 is not known, the sulfate trend at this station probably is at least partly an artifact of this analytical bias.
Table 4. Results of the seasonal Kendall test for trends in discharge and unadjusted and flow-adjusted pH and major dissolved constituents, Cossatot River, Arkansas, November 1985 through October 1995
[Trends in units of microequivalents per liter per year, except discharge in cubic meters per second per year, pH in pH standard units per year, and silica in micromoles per liter per year; inst., instantaneous; <, less than; --, not calculated]
|
Parameter |
Unadjusted |
Flow adjusted |
||
|
Trend |
p-value |
Trend |
p-value |
|
| Discharge, inst. |
0.12 |
0.228 |
-- |
-- |
| pH, field |
.02 |
.211 |
(a) |
-- |
| Calcium |
-7.2 |
.254 |
-2.6 |
0.036 |
| Magnesium |
-2.5 |
.130 |
-1.2 |
.006 |
| Sodium |
-2.2 |
.004 |
-1.2 |
.011 |
| Potassium |
-.5 |
.002 |
(a) |
-- |
| Alkalinity, laboratory |
-8.0 |
.336 |
.8 |
.649 |
| Sulfate |
-5.5 |
.000 |
-4.5 |
.000 |
| Chloride |
-2.2 |
.001 |
-2.1 |
.001 |
| Nitrite plus nitrate |
(b) |
-- |
-- |
-- |
| Silica |
<.1 |
.748 |
-.2 |
.927 |
a Flow model not significant at a = 0.10.
b Insufficient data to calculate trend.
Synoptic Water-Quality Data
Results of the surface-water synoptic sampling in the Cossatot River Basin on January 29 and 30, 1991, are listed in table 5, and the locations of sampling sites are shown in figure 2. During the sampling period, discharge at the gaging station was about 2.4 m³/s compared to the median daily discharge of about 2.8 m³/s for January (Lawrence, 1987), indicating that the basin was sampled during normal flow conditions for that time of year. Solute concentrations measured at site 1 during the synoptic sampling were generally between the first-quartile and median concentrations reported for the HBN station during the entire period of record (table 2). The concentrations of solutes in the tributary streams bracketed the composition of stream water collected at the gaging station (site 1), except for calcium and alkalinity, which were lower than at site 1, except for site 5. Ion balances for all samples ranged from -3.9 to 5.5 percent, indicating that organic anions did not seem to be an important component of stream water during the sampling period.
Table 5. Physical properties and major dissolved constituents from surface-water sampling sites in the Cossatot River Basin, Arkansas, collected January 29-30, 1991
[Site locations shown in fig. 2; Q, discharge in cubic meters per second; SC, specific conductance in microsiemens per centimeter at 25 degrees Celsius; pH in standard units; Ca, calcium; Mg, magnesium; Na, sodium; K, potassium; Alk, alkalinity; SO4, sulfate; Cl, chloride; NO3, nitrate; Si, silica; concentrations in microequivalents per liter, except silica in micromoles per liter; <, less than; criteria used in selection of sampling sites: BG = bedrock geology, LU = land use, MT = major tributary]
|
Site |
Station number |
Q |
SC |
pH |
Ca |
Mg |
Na |
K |
Alk |
SO4 |
Cl |
NO3 |
Si |
Criteria |
Remarks |
|
1 |
07340300 |
2.4 |
31 |
7.3 |
140 |
79 |
74 |
13 |
180 |
67 |
42 |
0.7 |
120 |
-- |
Gaging station |
|
2 |
342249094133300 |
.046 |
25 |
7.0 |
60 |
42 |
100 |
16 |
110 |
63 |
42 |
1.4 |
170 |
BG | Stanley Shale |
|
3 |
342408094083200 |
.18 |
17 |
6.7 |
28 |
58 |
43 |
12 |
34 |
69 |
37 |
1.4 |
120 |
BG, LU | Arkansas Novaculite, wilderness |
|
4 |
342440094155700 |
.017 |
21 |
6.9 |
46 |
38 |
78 |
14 |
74 |
71 |
39 |
<.7 |
150 |
BG | Stanley Shale |
|
5 |
342549094075000 |
.25 |
44 |
7.5 |
260 |
96 |
52 |
12 |
260 |
69 |
39 |
5.7 |
100 |
BG, LU | Bigfork Chert, rural development |
|
6 |
342551094080000 |
.039 |
25 |
6.9 |
60 |
96 |
52 |
13 |
97 |
79 |
42 |
1.4 |
95 |
BG, LU | Blaylock Sandstone, mines |
|
7 |
342615094144200 |
.020 |
23 |
6.9 |
55 |
44 |
96 |
16 |
85 |
69 |
42 |
<.7 |
180 |
BG | Stanley Shale |
|
8 |
342615094144300 |
.099 |
29 |
7.3 |
120 |
79 |
65 |
14 |
150 |
67 |
42 |
<.7 |
140 |
BG, MT | Mixed lithology |
|
9 |
342643094060300 |
.23 |
21 |
6.9 |
50 |
61 |
65 |
11 |
84 |
58 |
39 |
1.4 |
150 |
BG | Stanley Shale |
|
10 |
342659094071000 |
.070 |
25 |
6.8 |
75 |
76 |
65 |
11 |
110 |
65 |
48 |
2.1 |
140 |
LU | Rural development |
|
11 |
342704094072200 |
.088 |
26 |
7.1 |
95 |
67 |
70 |
12 |
130 |
60 |
39 |
2.1 |
140 |
BG, LU | Stanley Shale, rural development |
|
12 |
342737094120500 |
.042 |
25 |
6.6 |
65 |
88 |
39 |
11 |
110 |
71 |
42 |
<.7 |
110 |
BG, LU | Mixed lithology, mines |
|
13 |
342739094111700 |
.017 |
16 |
6.3 |
27 |
57 |
43 |
10 |
30 |
71 |
37 |
1.4 |
110 |
BG | Arkansas Novaculite |
Most of the variability in stream chemistry in the Cossatot River Basin was measured in the weathering-derived constituents calcium and alkalinity. For example, calcium ranged from a minimum of 27 meq/L at site 13 to a maximum of 260 meq/L in Sugar Creek (site 5) (table 5). A similar pattern was measured in the concentration of alkalinity, which ranged from 30 meq/L at site 13 to 260 meq/L in Sugar Creek (site 5). This range in calcium and alkalinity concentrations among the tributary streams may reflect differences in the mineralogy of the sedimentary units. For example, the highest concentrations were measured in Sugar Creek (site 5), which drains an area underlain by the Bigfork Chert, and the lowest concentrations were at sites 3 and 13, which primarily drain the Arkansas Novaculite. Although both sedimentary units consist mostly of quartz, the Bigfork Chert contains interbedded limestones and disseminated grains of calcite, whereas the Arkansas Novaculite is nearly carbonate free (Ericksen and others, 1983). These results also reveal that the concentrations of calcium and alkalinity at the HBN station were not representative of most of the tributary streams sampled during the synoptic sampling. In contrast to calcium and alkalinity, concentrations of the remaining solutes varied by less than a factor of two. For example, sulfate concentrations ranged from 58 to 79 meq/L and silica ranged from 95 to 180 mmol/L. The similarity in sulfate concentrations among the sites supports the assumption that sulfate is primarily derived from atmospheric deposition. Internal sources of sulfate, such as weathering of pyrite from mineralized areas, might be expected to produce a wider range of sulfate concentrations among the tributary streams. Chloride and nitrate, which are often indicators of human activities, had uniformly low concentrations throughout the basin. For example, nitrate concentrations at all sites were less than 6 meq/L, and chloride varied only from 37 to 48 meq/L. These data indicate that the effect of pasture land and rural residential areas on water quality during the sampling period was minimal.
References Cited
Bailey, R.G., Avers, P.E., King, T., and McNab, W.H., eds., 1994, Ecoregions and subregions of the United States with supplementary table of map unit descriptions: Washington, D.C., U.S. Department of Agriculture Forest Service, scale 1:7,500,000(also at URL http://www.fs.fed.us/land/ecosysmgmt/ecoreg1_home.html, accessed 1998).
Barnes, Ivan, 1964, Field measurement of alkalinity and pH: U.S. Geological Survey Water-Supply Paper 1535-H, 17 p.
Clingenpeel, J.A., 1994, A cumulative effects analysis of silvicultural best management practices using basin areas stream survey methods-v. 1, The study, results, discussion, and summary and conclusions: Arkansas, Hot Springs, U.S. Department of Agriculture Forest Service, Southern Region, Ouachita National Forest, 53 p.
Cole, E.F., and Morris, E.E., 1986, Quality of water resources of the Ouachita National Forest, Arkansas: U.S. Geological Survey Water-Resources Investigations Report 86-4166.
Ericksen, G.E., and others, 1983, Mineral resources of the Caney Creek Wilderness, Polk County, Arkansas: U.S. Geological Survey Bulletin 1551, 42 p.
Freiwald, D.A., 1985, Average annual precipitation and runoff for Arkansas, 1951-80: U.S. Geological Survey Water-Resources Investigations Report 84-4363.
Hoelscher, J.E., McCollum, C.N., and Laurent, G.D., 1975, Soils survey of Howard County, Arkansas: U.S. Department of Agriculture Soil Conservation Service, 75 p., 38 folded plates.
Lawrence, C.L., 1987, Streamflow characteristics at hydrologic benchmark stations: U.S. Geological Survey Circular 941, 123 p.
Likens, G.E., Bormann, F.H., Pierce, R.S., Eaton, J.S., and Johnson, N.M., 1977, Biogeochemistry of a forested ecosystem: New York, Springer-Verlag, 146 p.
Ludwig, A.H., 1992, Flow duration and low-flow characteristics of selected Arkansas streams: U.S. Geological Survey Water-Resources Investigations Report 92-4026, 57 p.
Lynch, J.A., Grimm, J.W., and Bowersox, V.C., 1995, Trends in precipitation chemistry in the United States-A national perspective, 1980-1992 :Atmospheric Environment, v. 29, no. 11, p. 1231-1246.
Mast, M.A., and Turk, J.T., 1999, Environmental characteristics and water quality of Hydrologic Benchmark Network stations in the Eastern United States, 1963-95: U.S. Geological Survey Circular 1173-A, 158 p.
Miser, H.D., and Purdue, A.H., 1929, Geology of the De Queen and Caddo Gap quadrangles: U.S. Geological Survey Bulletin 808, 195 p., scale 1:125,000.
Nix, J.F., Thornton, K.W., Ford, D.E., and Malcolm, J., 1988, Storm event sampling of two low alkalinity southwestern Arkansas streams: U.S. Environmental Protection Agency Report EPA/600/3-88/023, 239 p.
Porter, J.E., Evans, D.A., and Pugh, A.L., 1996, Water resources data, Arkansas, water year 1995: U.S. Geological Survey Water-Data Report AR-95-1, 408 p.
U.S. Department of Agriculture, 1990c, Vegetation management in the Ozark/Ouachita Mountains, Final Environmental Impact Statement: U.S. Department of Agriculture Forest Service, Southern Region, Management Bulletin R8- MB 45.
Appendix A. List of Map References
a. U.S. Geological Survey topographic maps:
- Eagle Mountain, Arkansas (1:24,000), 1986, gaging station on this quadrangle
- Nichols Mountain, Arkansas (1:24,000), 1986
- Vandervoort, Arkansas (1:24,000), 1984
- De Queen, Arkansas-Oklahoma (1:100,000), 1986
b. Geologic maps:
- Erickson, G.E., Patterson, S.H., Dunn, M.L., Jr., and Harrison, D.K., 1983, Mineral resources of the Caney Creek Wilderness, Polk County, Arkansas: U.S. Geological Survey Bulletin 1551, 42 p.
- Miser, H.D., and Purdue, A.H., 1929, Geology of the De Queen and Caddo Gap quadrangles: U.S. Geological Survey Bulletin 808, 195 p., scale 1:125,000.
c. Miscellaneous maps:
- U.S. Department of Agriculture, 1984, Map of Ouachita National Forest (west half), Arkansas and Oklahoma: U.S. Department of Agriculture Forest Service, Southern Region, scale 1:126,720.
- U.S. Geological Survey, 1986, Land-use series, De Queen, Arkansas; Oklahoma: U.S. Geological Survey Open-File Report 85-0323, scale 1:100,000.
Appendix B. NWIS Site-Identification Numbers
Table B-1. NWIS site-identification numbers and site names for water-quality sampling sites.
|
Site |
Identification Number |
Site Name |
|
1 |
07340300 |
COSSATOT RIVER NR VANDERVOORT ARKANSAS |
|
2 |
342249094133300 |
LONG BR NR VANDERVOORT ARKANSAS |
|
3 |
342408094083200 |
CANEY CR NR VANDERVOORT ARKANSAS |
|
4 |
342440094155700 |
ROCK CR NR VANDERVOORT ARKANSAS |
|
5 |
342549094075000 |
SUGAR CR NEAR SHADY ARKANSAS |
|
6 |
342551094080000 |
ROCKY MTN BR NR SHADY ARKANSAS |
|
7 |
342615094144200 |
NORTH FORK LITTLE BRUSHY CR NR SHADY ARKANSAS |
|
8 |
342615094144300 |
LITTLE BRUSHY CR NR SHADY ARKANSAS |
|
9 |
342643094060300 |
MINE CR NR SHADY ARKANSAS |
|
10 |
342659094071000 |
SULPHUR CR NR SHADY ARKANSAS |
| 11 |
342704094072200 |
COSSATOT R AT SHADY ARKANSAS |
| 12 |
342737094120500 |
BOAR TUSK MTN BR NR SHADY ARKANSAS |
| 13 |
342739094111700 |
SUGARTREE MTN BR NR SHADY ARKANSAS |