
Hydrologic Benchmark Network Stations in the Midwestern U.S. 1963-95 (USGS Circular 1173-B)
|
|
|
|
|
North Sylamore Creek near Fifty Six, Arkansas (Station 07060710)
To download a printer friendly PDF version of this information click here.
This report details one of the approximately 50 stations in the Hydrologic Benchmark Network (HBN) described in the four-volume U.S. Geological Survey Circular 1173. The suggested citation for the information on this page is:
|
Mast, M.A., and Turk, J.T., 1999, Environmental characteristics and water quality of Hydrologic Benchmark Network stations in the Midwestern United States, 1963-95: U.S. Geological Survey Circular 1173-B, 130 p. |
All of the tables and figures are numbered as they appear in each circular. Use the navigation bar above to view the abstract, introduction and methods for the entire circular, as well as a map and list of all of the HBN sites. Use the table of contents below to view the information on this particular station.
|
Table of Contents |
| 1. Site Characteristics and Land Use |
| 2. Historical Water Quality Data and Time-Series Trends |
| 3. Synoptic Water Quality Data |
Site Characteristics and Land Use
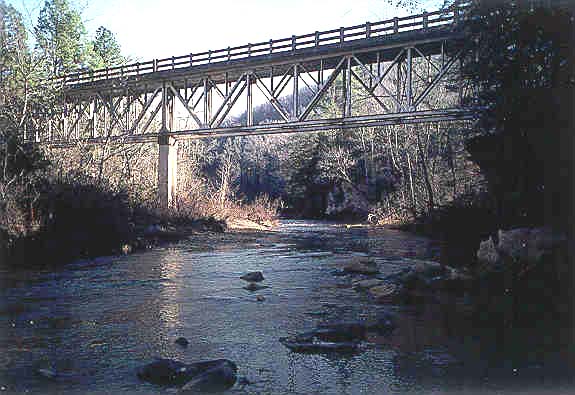 |
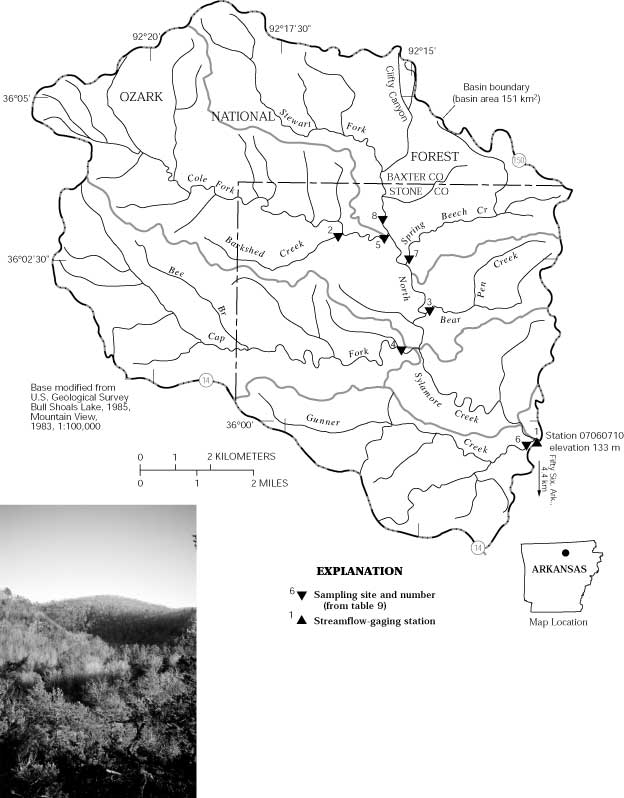
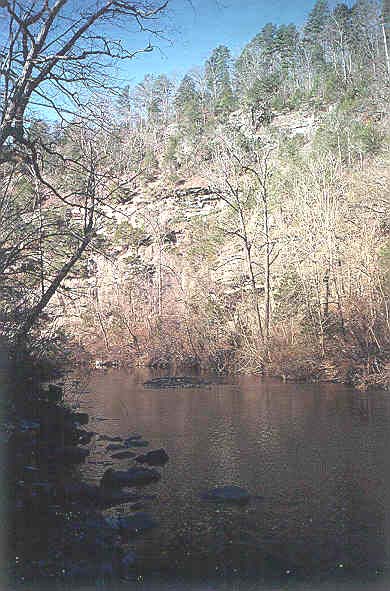
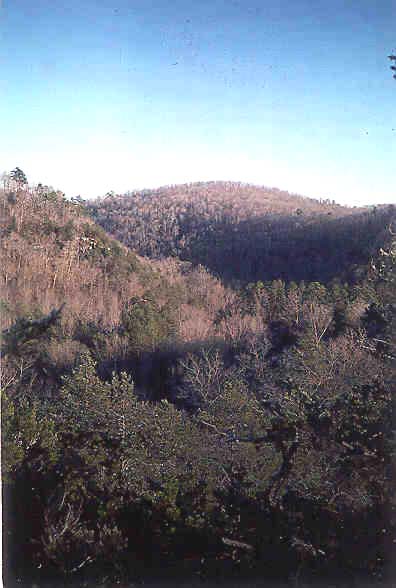
The North Sylamore Creek HBN Basin is located in the Springfield-Salem Plateaus section of the Ozark Plateaus physiographic province in north-central Arkansas (Figure 4. Map showing study area in the North Sylamore Creek Basin and photograph of the landscape of the basin). The 150-km² basin ranges in elevation from 133 to 415 m and drains an area characterized by steep V-shaped valleys separated by long, narrow winding ridges. The USGS gaging station is located 4.4 km north of Fifty Six, Ark., at latitude 35×59'30" and longitude 92×12'50". North Sylamore Creek flows southeast into the White River, a tributary of the Mississippi River, and has a channel length of about 25 km upstream from the gaging station and an average stream gradient of 2.9 m/km. Mean monthly discharge varies seasonally from a minimum of 0.18 m³/s in August to 3.1 m³/s in April, and streamflow is highly variable during storms because of rapid runoff from the steep hillslopes. Average annual runoff from the basin was 28 cm from 1966 through 1995 (Porter and others, 1996). The climate is temperate with hot summers and moderately cool winters (Ward, 1983). Average daily air temperatures range from 1.9×C in January to 26.2×C in July. Precipitation averages 112 cm annually and is greatest in spring and least in the late fall and winter (Freiwald, 1985; Adamski and others, 1995). Annual snowfall is about 15 cm, although snow cover generally lasts only a few days at a time. Estimated mean annual evapotranspiration in the region is between 75 and 90 cm annually (Hanson, 1991).
The North Sylamore Creek Basin is in the Eastern Broadleaf Forest (Continental) ecoregion (Bailey and others, 1994), and vegetation consists of 65 percent hardwoods and 35 percent pines. The most common forest community is the oak-hickory association, which grows on south-facing slopes, hilltops, and upper northern exposures (Dale and others, 1978). Common species include post oak, white oak, blackjack oak, black oak, mockernut hickory, and dogwood. Pine and pine-oak forest types most commonly grow on soils derived from sandstone and shale. The predominant species include shortleaf pine and upland oak species. Cedar glades grow almost exclusively on soil derived from limestone and dolomite. The predominant glade species are red cedar and white cedar with a ground cover of prairie grasses and forbs (Dale and others, 1978). Most soils in the basin are classified as Ultisols (Typic Paleudults) and are mapped in the Norak and Clarksville soil series, which includes well-drained cherty soils developed in residuum of cherty limestone (Ward, 1983). The Norak soils are on gently sloping hillslopes and ridges and generally have a grayish-brown surface layer of cherty silt loam up to 30 cm thick overlying a yellowish-red cherty silt clay subsoil that extends to a depth of 200 cm. Clarksville soils are similar to Norak soils, except they form on steeper hillslopes and ridges and have a slightly higher clay content. Soils in both series contain between 35 to 80 percent chert fragments, are strongly acidic (pH 4.5 to 5.5), and depleted in organic matter (Ward, 1983). The predominant clay minerals in these soils are kaolinite, illite, and iron and aluminum oxides (Adamski and others, 1995).
Bedrock in the basin consists of flat-lying sedimentary rocks of Ordovician and Mississippian age. The oldest formation, the St. Peter Sandstone of Ordovician age, primarily crops out along the streambeds and contains massive layers of well-rounded sandstone interbedded with greenish-gray shale and layers of dolomite (McFarland and others, 1979). The valley walls are formed by limestones and dolomites of the Joachim Dolomite, Plattin Limestone, Kimmswick Limestone, and Fernvale Limestone of Ordovician age. Rocks of the younger Boone Formation of Mississippian age cap the uplands and ridges and consist of light-gray limestone interbedded with chert. The limestones and dolomites provide water for a large number of springs and, as a result, many streams in the region have a well-sustained base flow (Ludwig, 1992).
 |
North Sylamore Creek drains parts of Baxter and Stone Counties in Arkansas and is entirely in the Sylamore Ranger District of the Ozark-St. Francis National Forest. About 14 percent of National Forest land that is adjacent to the main stream corridor and to segments of the Clifty Canyon, Cole Fork, Cap Fork, and Stewart Fork tributaries has special protection in the Clifty Canyon Botanical Area. Privately owned parcels account for less than 5 percent of land in the National Forest boundary; most of the parcels are concentrated in the Gunner Creek subbasin. The basin is accessible by a few gravel roads and several jeep trails, except for the Clifty Canyon Botanical Area, which is primarily roadless. Because of the steep, canyonlike topography along the drainages, most roads and trails follow the ridgelines. Access to the main stream channel, upstream from the gaging station, is limited to two road crossings and several unmaintained hiking trails that follow abandoned logging roads.
Land cover in the North Sylamore Creek Basin is 99 percent forest and 1 percent cleared land, including maintained wildlife openings and a few private fields and residences (Joseph Dabney, U.S. Department of Agriculture Forest Service, written commun., 1996). Land-use activities in the basin include timber harvesting, recreation, and a small amount of cattle grazing. National Forest land in the basin is divided into two management areas, special interest areas, and general forest (U.S. Department of Agriculture, 1985b). The Clifty Canyon Botanical Area includes 125 km² of forest land that is managed to protect, study, and enhance sensitive plants that have been identified by the Forest Service and the Arkansas Natural Heritage Commission. In this area, motorized travel is restricted to designated routes, livestock grazing is prohibited, and the area is considered unavailable for timber harvest, except where necessary to improve conditions for sensitive plants. The remainder of the basin is classified as general forest, of which about 70 percent is suitable for timber production (U.S. Department of Agriculture, 1985b). Second growth pines and hardwoods are managed on a 80-year rotation, and old growth forests are cut on a 200-year rotation. Timber harvesting in the basin for the past 7 years has affected about 165 ha annually with thinning, group selection, and shelterwood being the most common methods of harvest (Joseph Dabney, written commun., 1996). The Forest Service also maintains a small reservoir and recreational site at the mouth of Gunner Creek and a picnic area near the mouth of Barkshed Creek. The only substantial change in land use since the establishment of the HBN station has been a decrease in land available for timber management owing to the expansion of the Clifty Canyon Botanical Area in 1984. A more complete history of land use in the Ozark-St. Francis National Forest is described in Bass (1981).
Historical Water-Quality Data and Time-Series Trends
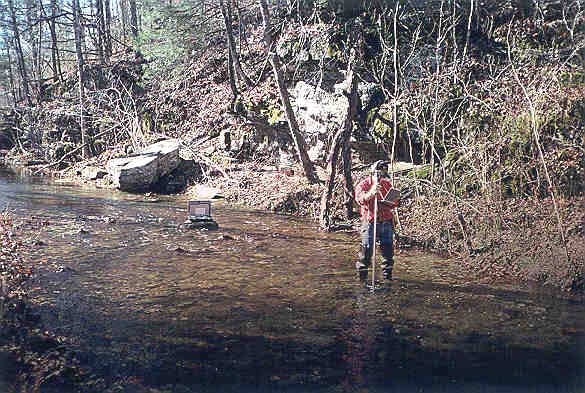
The data set for the North Sylamore Creek HBN Station analyzed for this report includes 267 water-quality samples that were collected from June 1966 through August 1995. Sampling frequency was monthly from 1968 through 1982 and bimonthly from 1983 through 1995. Monthly samples were collected from 1993 through 1995 as part of the National Water-Quality Assessment Program in the Ozark Plateaus study unit (Davis and others, 1995). Water-quality samples from the early part of the record were analyzed at a USGS laboratory in Little Rock, Ark., that operated until 1973 (Durum, 1978). After establishment of the central laboratory system, samples were analyzed at a laboratory in Atlanta, Ga., from 1973 through 1985 and at the NWQL in Arvada, Colo., from 1986 through 1995. Daily discharge records are available for North Sylamore Creek (station 07060710) beginning in December 1965.
 |
Calculated ion balances for 255 samples with complete major-ion analyses are shown in Figures 5a and 5b. Temporal variation of discharge, field pH, major dissolved constituents, and ion balance at North Sylamore Creek, Arkansas. Ion balances ranged from -14 to 19 percent, and 99 percent of samples had values within the ±5 percent range, indicating that the analytical measurements were of high quality. The average ion balance for all samples was -0.4 percent, indicating that unmeasured constituents, such as organic anions, do not seem to contribute substantially to the ion balance of stream water at this site. Time-series plots of major dissolved constituents were inspected for evidence of method-related effects. No unusual patterns were apparent, except perhaps in the sodium, potassium, and chloride concentrations. Sodium and potassium had slightly different concentration patterns in the late 1980's; the potassium concentrations were somewhat lower than average, and the sodium concentrations were somewhat higher. Although there are no documented changes in field or laboratory methods for these constituents during this period of record, the possibility of analytical bias cannot be completely ruled out. Chloride concentrations seemed to increase near the beginning of record then level off after the early 1970's. The cause of this apparent increase could not be identified, although it may be related to the change in analytical laboratory that occurred in 1973.
Median concentrations and ranges of major constituents in stream water at the North Sylamore Creek Station and VWM concentrations in wet-only deposition measured at the Buffalo National River NADP Station are listed in table 6. Precipitation chemistry at the NADP station, which is located about 36 km west of the HBN station, was dilute and slightly acidic and had a VWM pH of 4.8 for 13 years of record. The predominant cations were hydrogen, which accounted for 40 percent of the total cation charge, and ammonium, which accounted for 25 percent. Sulfate composed 57 percent of the total anions, whereas nitrate contributed 30 percent and chloride contributed 13 percent. These results indicate that precipitation at the nearby NADP station may be affected by anthropogenic emissions of sulfur and nitrogen compounds, which cause acid rain.
Table 6. Minimum, first quartile, median, third quartile, and maximum values of physical properties and major dissolved constituents measured in water-quality samples from North Sylamore Creek, Arkansas, June 1966 through August 1995,and volume-weighted mean concentrations in precipitation collected at the Buffalo National River Station, Arkansas
[Concentrations in units of microequivalents per liter, discharge in cubic meters per second, specific conductance in microsiemens per centimeter at 25 degrees Celsius, pH in standard units, and silica in micromoles per liter; n, number of stream samples; VWM, volume-weighted mean; inst., instantaneous; spec. cond., specific conductance; <, less than; --, not reported]
|
Parameter |
Stream Water |
Precipitation VWMa |
|||||
|
Minimum |
First quartile |
Median |
Third quartile |
Maximum |
n |
||
| Discharge |
0.051 |
0.18 |
0.37 |
0.91 |
110 |
267 |
-- |
| Spec. cond., field |
100 |
250 |
270 |
280 |
320 |
264 |
12 |
| pH, field |
7.2 |
7.9 |
8.1 |
8.2 |
8.8 |
264 |
4.8b |
| Calcium |
850 |
2,150 |
2,300 |
2,400 |
2,800 |
267 |
6.9 |
| Magnesium |
110 |
420 |
480 |
540 |
880 |
265 |
2.0 |
| Sodium |
26 |
52 |
61 |
74 |
140 |
264 |
4.7 |
| Potassium |
<2.6 |
18 |
21 |
23 |
54 |
265 |
1.2 |
| Ammonium |
<.7 |
<.7 |
1.4 |
2.1 |
24 |
119 |
11 |
| Alkalinity, laboratory |
940 |
2,500 |
2,720 |
2,880 |
3,400 |
265 |
-- |
| Sulfate |
6.3 |
94 |
120 |
140 |
270 |
264 |
25 |
| Chloride |
8.5 |
42 |
51 |
65 |
150 |
262 |
5.0 |
| Nitrite plus nitrate |
<3.6 |
<7.1 |
<7.1 |
7.1 |
27 |
198 |
13c |
| Silica |
50 |
110 |
120 |
140 |
200 |
266 |
-- |
a Data are volume-weighted mean concentrations for 1982-95.
b Laboratory pH.
c Nitrate only.
 |
Stream water in North Sylamore Creek is fairly concentrated and strongly buffered; specific conductance ranged from 100 to 320 mS/cm, and alkalinity was between 940 and 3,400 meq/L (table 6). The major ions in stream water were calcium, magnesium, and bicarbonate, which accounted for more than 90 percent of the total ionic charge. The predominance of these ions in stream water is attributed to the dissolution of carbonate minerals in the underlying limestone and dolomite bedrock. The median chloride concentration in stream water was 51 meq/L, which is about 10 times greater than the VWM chloride concentration of 5.0 meq/L in precipitation. On the basis of the difference between average annual precipitation and runoff, evapotranspiration can account for about a fourfold increase in the chloride concentration in precipitation, indicating that stream-water chloride is derived from sources other than precipitation. Human-related sources of chloride are probably minimal because roads are not salted in winter, and there are only a few residences and campsites upstream from the gaging station. The excess stream-water chloride, therefore, probably is derived from natural sources, such as trace amounts of halite in the underlying marine sediments (Craig and others, 1984). The median concentration of sulfate in stream water was 120 meq/L, which is about five times greater than the VWM concentration of 25 meq/L in precipitation. This difference in concentration can largely be accounted for by evapotranspiration, indicating that stream-water sulfate is derived primarily from precipitation and behaves fairly conservatively in the basin. Inorganic nitrogen species seem to be strongly retained in the basin, based on the low concentrations of nitrate and of ammonium in stream water compared to precipitation. Stream-water concentrations of nitrate and of ammonium were similar to concentrations reported for other undisturbed streams draining forested areas in the Ozark Plateaus Province (Smart and others, 1985).
The solute composition of stream water was further evaluated by analyzing correlations between solutes and stream discharge (table 7). The major weathering products had moderately strong inverse correlations with discharge (-0.411 > rho > -0.789), except for silica (rho = -0.335). Inverse correlations between weathering products and discharge are consistent with a hydrologic system where weathering-enriched base flow is diluted by waters from shallow sources during periods of increased discharge. Chloride also had an inverse correlation with flow (rho = -0.497), supporting the assumption that stream-water chloride may be derived from dissolution of salt in the underlying limestone and dolomite. Among the solutes, the strongest correlations were between calcium and alkalinity (rho = 0.757) and magnesium and alkalinity (rho = 0.608). Silica had little correlation with other weathering-derived solutes, except for a weak positive correlation with sodium (rho = 0.401). The strong correlations among calcium, magnesium, and alkalinity and the lack of correlations with silica are consistent with the weathering stoichiometry of carbonate minerals. The processes that control silica in stream water are not clear, particularly because silica concentrations varied minimally for a wide range of streamflows. Weathering of quartz, chert, and clay minerals in the sedimentary rocks is the most likely source of silica in stream water during low-flow conditions. During high-flow conditions, however, silica may be regulated largely by processes occurring in soil and shallow ground-water environments. These processes may include dissolution of amorphous silica minerals, biological activity, and sorption reactions.
Table 7. Spearman rank correlation coefficients (rho values) showing the relation among discharge, pH, and major dissolved constituents, North Sylamore Creek, Arkansas, 1966-95
[Q, discharge; Ca, calcium; Mg, magnesium; Na, sodium; K, potassium; Alk, alkalinity; SO4, sulfate; Cl, chloride; Si, silica]
|
|
Q |
pH |
Ca |
Mg |
Na |
K |
Alk |
SO4 |
Cl |
| pH |
-0.043 |
|
|
|
|
|
|
|
|
| Ca |
-.412 |
-0.023 |
|
|
|
|
|
|
|
| Mg |
-.788 |
-.059 |
0.471 |
|
|
|
|
|
|
| Na |
-.570 |
-.018 |
.409 |
0.653 |
|
|
|
|
|
| K |
-.173 |
.015 |
.146 |
.137 |
0.073 |
|
|
|
|
| Alk |
-.548 |
-.096 |
.757 |
.608 |
.404 |
0.105 |
|
|
|
| SO4 |
.243 |
.092 |
-.136 |
-.146 |
-.155 |
-.266 |
-0.262 |
|
|
| Cl |
-.497 |
.008 |
.292 |
.457 |
.427 |
.152 |
.300 |
-0.086 |
|
| Si |
-.335 |
.065 |
.137 |
.265 |
.401 |
.230 |
.140 |
-.561 |
0.192 |
Results of the seasonal Kendall test for trends in discharge and major dissolved constituents are listed in table 8. Statistically significant trends were observed in magnesium, potassium, and silica concentrations at the 0.01 probability level. Trends in all three constituents were similar for unadjusted and flow-adjusted concentrations, indicating that trends were not caused by variations in stream discharge. The LOWESS curves in figure 5 indicate slightly different trend patterns for all three constituents. For example, the upward trend in silica is primarily caused by a period of low concentrations in the early part of the period of record. Since 1973, silica concentrations have remained nearly constant. By contrast, the greatest change in magnesium and potassium concentrations occurred in the later one-half of the period of record. The decline in potassium occurred during a short period in the early 1980's, whereas the decline in magnesium was more gradual.
Table 8. Results of the seasonal Kendall test for trends in discharge and unadjusted and flow-adjusted pH and major dissolved constituents, North Sylamore Creek, Arkansas, June 1966 through August 1995
[Trends in units of microequivalents per liter per year, except discharge in cubic meters per second per year, pH in standard units per year, and silica in micromoles per liter per year; inst., instantaneous; <, less than; --, not calculated]
|
Parameter |
Unadjusted |
Flow adjusted |
||
|
Trend |
p-value |
Trend |
p-value |
|
| Discharge, inst. |
0.002 |
0.294 |
-- |
-- |
| pH, field |
.01 |
.027 |
0.01 |
0.030 |
| Calcium |
-2.2 |
.124 |
-2.7 |
.157 |
| Magnesium |
-2.9 |
.000 |
-2.0 |
.000 |
| Sodium |
<.1 |
.568 |
.2 |
.257 |
| Potassium |
-.1 |
.000 |
-.2 |
.000 |
| Alkalinity, laboratory |
-5.0 |
.013 |
-4.2 |
.050 |
| Sulfate |
-.3 |
.211 |
-.5 |
.077 |
| Chloride |
.4 |
.097 |
.4 |
.042 |
| Nitrite plus nitrate |
(a) |
-- |
-- |
-- |
| Silica |
.3 |
.003 |
.4 |
.003 |
a Insufficient data to calculate trend.
Trends in stream chemistry at this HBN station may reflect changes in environmental factors, such as land-use activities or precipitation chemistry. The effect of land use on stream chemistry at this station probably is minimal because the basin is primarily forested and, except for a small amount of logging, has been used little by humans during the period of record. Trends in precipitation chemistry at this site are difficult to confirm because no long-term records are available for the entire period of record. Lynch and others (1995) did report significant declines in calcium, magnesium, and sulfate concentrations at a nearby NADP station in Arkansas from 1982 through 1990. Although the trend in magnesium is consistent with the downward trend in stream-water magnesium, it is unlikely that changes in atmospheric deposition would have a measurable effect on stream-water chemistry at this station, given the dilute concentration of precipitation compared to the stream. Method-related factors may provide an alternative explanation for trends in some constituents at this station. For example, the low silica concentrations in the early part of the period of record are coincident with a period when samples were analyzed at a USGS laboratory in Arkansas from 1966 through 1972 (Durum, 1978). Procedural changes that may have affected magnesium and potassium concentrations include a change in the analytical method for cations and trace metals in 1983 (Office of Water Quality Technical Memorandum No. 82.18, National Water-Quality Networks, issued September 28, 1982, at URL http://water.usgs.gov/admin/memo/, accessed 1997) and a switch to the NWQL in Arvada, Colo., in 1985.
Synoptic Water-Quality Data
Results of the surface-water synoptic sampling in the North Sylamore Creek Basin on November 28 and 29, 1990, are listed in table 9, and the locations of sampling sites are shown in figure 4. During the sampling period, discharge at the gaging station was about 1.1 m³/s compared to the median discharge of 0.3 m³/s for November (Lawrence, 1987), indicating that the basin was sampled during high-flow conditions for that time of year. Solute concentrations measured at site 1 during the synoptic sampling were between the first- and third-quartile concentrations reported for the HBN station during the entire period of record, except for chloride (table 6). The tributary streams were similar in composition to stream water collected at the gaging station (site 1), with calcium and bicarbonate the predominant ions. Ion balances for all samples but one were slightly negative and ranged from -1.0 to -7.4 percent. An anion excess was somewhat unexpected because of the high ionic content of the water and may indicate a slight bias in one of the analytical determinations.
Table 9. Physical properties and major dissolved constituents from surface-water sampling sites in the North Sylamore Creek Basin, Arkansas, collected November 28-29, 1990
[Site locations shown in fig. 4; Q, discharge in cubic meters per second; SC, specific conductance in microsiemens per centimeter at 25 degrees Celsius; pH in standard units; Ca, calcium; Mg, magnesium; Na, sodium; K, potassium; Alk, alkalinity; SO4, sulfate; Cl, chloride; NO3, nitrate; Si, silica; concentrations in microequivalents per liter, except silica in micromoles per liter; <, less than; criteria used in selection of sampling sites: BG = bedrock geology, MT = major tributary, LU = land use]
|
Site |
Station number |
Q |
SC |
pH |
Ca |
Mg |
Na |
K |
Alk |
SO4 |
Cl |
NO3 |
Si |
Criteria |
Remarks |
|
1 |
7060710 |
1.1 |
260 |
8.3 |
2,400 |
460 |
52 |
21 |
2,840 |
120 |
93 |
<7.1 |
120 |
-- |
Gaging station |
|
2 |
360254092162200 |
.16 |
240 |
8.4 |
2,300 |
240 |
61 |
20 |
2,860 |
81 |
93 |
<7.1 |
130 |
BG | Limestone and shale |
|
3 |
360146092144200 |
.060 |
270 |
7.8 |
2,600 |
380 |
57 |
22 |
2,900 |
140 |
99 |
<7.1 |
130 |
BG | Limestone and shale |
|
4 |
360107092150400 |
.077 |
280 |
8.3 |
2,700 |
240 |
48 |
20 |
2,960 |
120 |
85 |
<7.1 |
120 |
BG, MT | Limestone and shale |
|
5 |
360256092162100 |
.47 |
190 |
8.3 |
1,850 |
390 |
43 |
21 |
2,160 |
79 |
45 |
<7.1 |
110 |
BG, MT | Sandstone along streambed |
|
6 |
355943092124700 |
.045 |
290 |
8.2 |
2,900 |
200 |
57 |
22 |
3,060 |
140 |
96 |
29 |
130 |
LU | Some development |
|
7 |
360228092151000 |
.0020 |
300 |
7.6 |
2,800 |
500 |
48 |
22 |
3,220 |
130 |
87 |
<7.1 |
130 |
BG | Limestone and shale |
|
8 |
360256092153100 |
.27 |
290 |
8.2 |
2,550 |
620 |
52 |
23 |
3,180 |
130 |
100 |
<7.1 |
130 |
BG, MT | Sandstone along streambed |
In general, concentrations of the major solutes did not vary markedly among the tributary sites. For example, alkalinity ranged from a minimum of 2,160 meq/L in Cole Fork (site 5) to a maximum of 3,220 meq/L in Spring Beech Creek (site 7) (table 9). Calcium concentrations ranged from 1,850 to 2,900 meq/L, and magnesium concentrations ranged from 200 to 620 meq/L. The presence of limestone and dolomite in the bedrock throughout most of the basin and the rapid weathering rate of carbonate minerals are the most likely reasons for the lack of substantial spatial variation in the concentrations of these solutes. The noncarbonate solutes also had a narrow range of concentrations during the synoptic sampling. For example, sodium ranged from 43 to 61 meq/L, and silica varied only from 110 to 130 mmol/L. Sulfate and chloride concentrations were similar among the sampling sites, except for slightly lower sulfate concentrations in Barkshed Creek (site 2) and Cole Fork (site 5) and a lower chloride concentration in Cole Fork (site 5). Cole Fork not only had the lowest chloride and sulfate concentrations of the sampled tributaries, but had the lowest alkalinity and calcium concentrations as well. The lower concentrations at this site may be because this site had the largest discharge of the seven sampled tributaries. Nitrate was less than the reporting limit at all sites, except for Gunner Creek (site 6), which had a concentration of 29 meq/L. This slightly elevated nitrate concentration may reflect upstream human activities because this sampling site is immediately downstream from a small impoundment and a developed recreational area, which includes picnic and camping facilities.
References Cited
Adamski, J.C., Petersen, J.C., Freiwald, D.A., and Davis, J.V., 1995, Environmental and hydrologic setting of the Ozark Plateaus study unit, Arkansas, Kansas, Missouri, and Oklahoma: U.S. Geological Survey Water- Resources Investigations Report 94-4022, 69 p.
Bailey, R.G., Avers, P.E., King, T., and McNab, W.H., eds., 1994, Ecoregions and subregions of the United States with supplementary table of map unit descriptions: Washington, D.C., U.S. Department of Agriculture Forest Service, scale 1:7,500,000(also at URL http://www.fs.fed.us/land/ecosysmgmt/ecoreg1_home.html, accessed 1998).
Bass, S.M.W., 1981, For the trees-An illustrated history of the Ozark-St. Francis National Forests, 1908-1978: U.S. Department of Agriculture Forest Service, Southern Region, 171 p.
Craig, W.W., Wise, O., and McFarland, J.D., 1984, A guidebook to the post-St. Peter Ordovician and the Silurian and Devonian rocks of north-central Arkansas: Arkansas Geological Commission Report GB-84-1, p. 1-9.
Dale, E.E., Meyer, R.L., Parker, D.G., Smith, E.G., and Springer, M.D., 1978, Buffalo National River ecosystems-Final report: Arkansas Water Resources Research Center, Publication 58, p. 77-112.
Davis, J.V., Petersen, J.C., Adamski, J.C., and Freiwald, D.A., 1995, Water-quality assessment of the Ozark Plateaus study unit, Arkansas, Kansas, Missouri, and Oklahoma-Analysis of information on nutrients, suspended sediment, and suspended solids, 1970-92: U.S. Geological Survey Water-Resources Investigations Report 95-4042, 112 p.
Durum, W.H., 1978, Historical profile of quality of water laboratories and activities, 1879-1973: U.S. Geological Survey Open-File Report 78-432, 235 p.
Freiwald, D.A., 1985, Average annual precipitation and runoff for Arkansas, 1951-80: U.S. Geological Survey Water-Resources Investigations Report 84-4363.
Hanson, R.L., 1991, Hydrology of floods and droughts, evapotranspiration and droughts, in National Water Summary 1988-89-Floods and droughts: U.S. Geological Survey Water-Supply Paper 2375, p. 99-104.
Lawrence, C.L., 1987, Streamflow characteristics at hydrologic benchmark stations: U.S. Geological Survey Circular 941, 123 p.
Ludwig, A.H., 1992, Flow duration and low-flow characteristics of selected Arkansas streams: U.S. Geological Survey Water-Resources Investigations Report 92-4026, 57 p.
Lynch, J.A., Grimm, J.W., and Bowersox, V.C., 1995, Trends in precipitation chemistry in the United States-A national perspective, 1980-1992:Atmospheric Environment, v. 29, no. 11, p. 1231-1246.
McFarland, J.D., Bush, W.V., Wise, O.A., and Holbrook, Drew, 1979, A guidebook to the Ordovician-Mississippian rocks of north-central Arkansas: Arkansas Geological Commission Report GB-79-1, 25 p.
Porter, J.E., Evans, D.A., and Pugh, A.L., 1996, Water resources data, Arkansas, water year 1995: U.S. Geological Survey Water-Data Report AR-95-1, 408 p.
Smart, M.M., Jones, R.J., and Sebaugh, J.L., 1985, Stream-watershed relations in the Missouri Ozark Plateau Province: Journal of Environmental Quality, v. 14, no. 1, p. 77-82.
U.S. Department of Agriculture, 1985b, Land and resource management plan, Ozark-St. Francis National Forests: U.S. Department of Agriculture Forest Service, Southern Region.
Ward, L.B., 1983, Soil survey of Stone County, Arkansas: U.S. Department of Agriculture Soil Conservation Service, 152 p., 41 folded plates.
Appendix A. List of Map References
a. U.S. Geological Survey topographic maps:
- Calico Rock, Arkansas (1:24,000), 1964
- Fifty Six, Arkansas (1:24,000), 1972, gaging station on this quadrangle
- Norfork SE, Arkansas (1:24,000), 1980
- Onia, Arkansas (1:24,000), 1980
- Bull Shoals Lake, Arkansas-Missouri (1:100,000), 1985
- Mountain View, Arkansas (1:100,000), 1983
b. Geologic maps:
- McFarland, J.D., Bush, W.V., Wise, O.A., and Holbrook, Drew, 1979, A guidebook to the Ordovician-Mississippian rocks of north-central Arkansas: Arkansas Geological Commission Report GB-79-1, 25 p.
c. Soil surveys:
- U.S. Department of Agriculture, 1983, Soils survey of Baxter and Marion Counties, Arkansas: U.S. Department of Agriculture Soil Conservation Service, 136 p.
- Ward, L.B., 1983, Soil survey of Stone County, Arkansas: U.S. Department of Agriculture Soil Conservation Service, 152 p
d. Miscellaneous maps:
- Imes, J.L., and Emmett, L.F., 1994, Geohydrology of the Ozark Plateaus aquifer system in parts of Missouri, Arkansas, Oklahoma, and Kansas: U.S. Geological Survey Professional Paper 1414-D, 127 p.
- U.S. Department of Agriculture, 1986, Map of Ozark National Forest, Sylamore Ranger District, Arkansas: U.S. Department of Agriculture Forest Service, Southern Region, scale 1:126,720.
- U.S. Geological Survey, 1987, Land use and land cover and associated maps for Mountain View, Arkansas: U.S. Geological Survey Open-File Report 87-311, scale 1:100,000.
Appendix B. NWIS Site-Identification Numbers
Table B-1. NWIS site-identification numbers and site names for water-quality sampling sites.
|
Site |
Identification Number |
Site Name |
|
1 |
07060710 |
NORTH SYLAMORE CREEK NR FIFTY SIX ARKANSAS |
|
2 |
360254092162200 |
BARKSHED CREEK AT MOUTH ARKANSAS |
|
3 |
360146092144200 |
BEAR PEN CREEK NR MOUTH ARKANSAS |
|
4 |
360107092150400 |
CAP FORK AT MOUTH ARKANSAS |
|
5 |
360256092162100 |
COLE FORK AT MOUTH ARKANSAS |
|
6 |
355943092124700 |
GUNNER CREEK AT MOUTH ARKANSAS |
|
7 |
360228092151000 |
SPRING BEECH CREEK AT MOUTH ARKANSAS |
|
8 |
360256092153100 |
STEWART FORK AT MOUTH ARKANSAS |