
Hydrologic Benchmark Network Stations in the Midwestern U.S. 1963-95 (USGS Circular 1173-B)
|
|
|
|
|
South Hogan Creek near Dillsboro, Indiana (Station 03276700)
To download a printer friendly PDF version of this information click here.
This report details one of the approximately 50 stations in the Hydrologic Benchmark Network (HBN) described in the four-volume U.S. Geological Survey Circular 1173. The suggested citation for the information on this page is:
|
Mast, M.A., and Turk, J.T., 1999, Environmental characteristics and water quality of Hydrologic Benchmark Network stations in the Midwestern United States, 1963-95: U.S. Geological Survey Circular 1173-B, 130 p. |
All of the tables and figures are numbered as they appear in each circular. Use the navigation bar above to view the abstract, introduction and methods for the entire circular, as well as a map and list of all of the HBN sites. Use the table of contents below to view the information on this particular station.
|
Table of Contents |
| 1. Site Characteristics and Land Use |
| 2. Historical Water Quality Data and Time-Series Trends |
| 3. Synoptic Water Quality Data |
Site Characteristics and Land Use
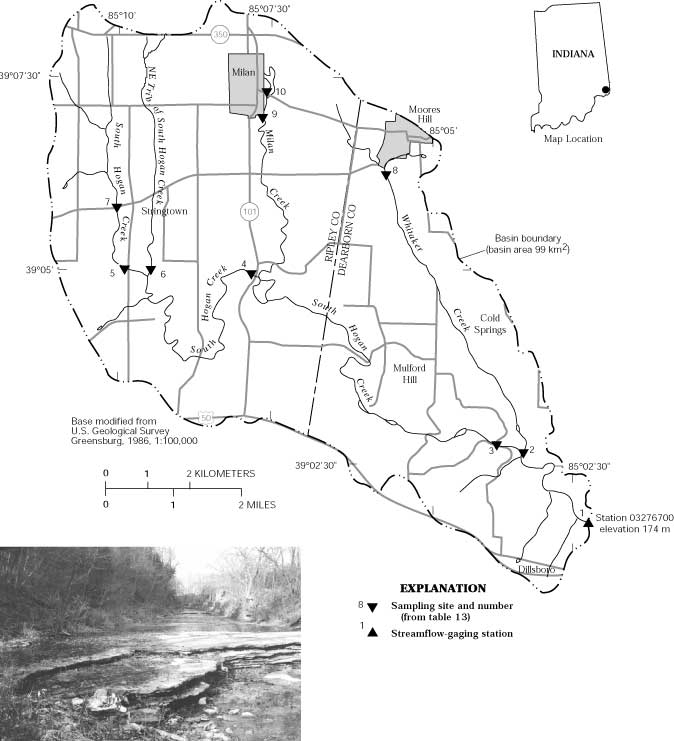
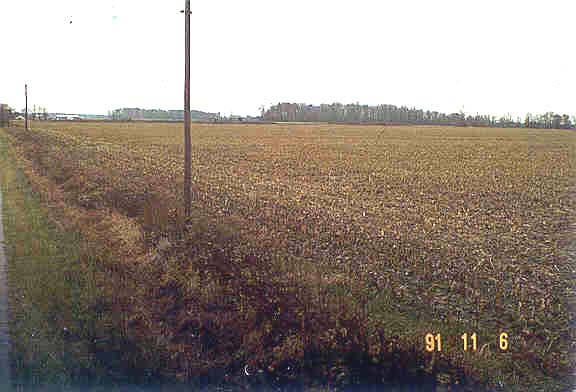
The South Hogan Creek HBN Basin is in the Central Lowlands physiographic province in southeastern Indiana (Figure 6. Map of study area in the South Hogan Creek Basin and photograph of the Whitaker Creek tributary). The 99-km² basin ranges in elevation from 174 to 303 m and drains the remnants of a broad undulating plateau dissected by deeply entrenched streams forming rugged V-shaped valleys. The USGS gaging station is located 1.9 km northeast of the town of Dillsboro, Ind., at latitude 39×01'47'' and longitude 85×02'17''. South Hogan Creek is a southeast-flowing tributary of the Ohio River and has a channel length of about 29 km upstream from the gaging station and an average stream gradient of 4.2 m/km. The main channel is perennial, and mean monthly discharge varies from 0.23 m³/s in September to 2.8 m³/s in March; there are occasional periods of no flow during the late summer and fall (July through November). Streamflow is highly variable during storms as a result of rapid runoff from the deeply incised stream channel and rocky streambed. Average annual runoff from the basin was 39 cm from 1961 through 1993 (Stewart and others, 1994). The climate is characterized by cold winters and hot summers (McWilliams, 1985). Average daily air temperatures range from -1.9×C in January to 22.9×C in July. Average annual precipitation is 100 cm, of which about 50 percent falls between March and July. Average annual snowfall is 42 cm, and, on average, 11 days of the year have at least 2 cm of snow on the ground (McWilliams, 1985).
 |
The South Hogan Creek Basin is in the Eastern Broadleaf Forest (Continental) ecoregion, and forest vegetation, which covers about 30 percent of the basin, is dominated by the oak-hickory association (Bailey and others, 1994). The predominant tree species are American beech, white ash, sugar maple, white oak, chinquapin oak, red oak, shagbark hickory, blue ash, tuliptree, Ohio buckeye, and black walnut (Homoya and others, 1985). Common understory species include flowering dogwood, sassafras, and hophornbeam. Soils in the basin are classified as Alfisols (Fragiudalfs, Ochraqualfs, and Hapludalfs) and are mapped in the Cobbsfork-Avonburg and Cincinnati- Rossmoyne-Hickory soil associations (McWilliams, 1985). The Cobbsfork-Avonburg soils are on the almost level to gently sloping upland plateau surface and are deep, poorly drained soils developed in loess and in silty glacial drift. A typical soil profile has a surface layer of dark grayish-brown silt loam as much as 25 cm thick overlying a subsoil of light-gray to yellowish-brown mottled silt loam and silty clay loam that extents to a depth of 200 cm. The Cincinnati-Rossmoyne-Hickory association includes well-drained soils on hillslopes that have developed in loess and in silty glacial drift. These soils range in thickness from 200 to 300 cm and often have a fragipan in the lower part of the subsoil. Soils in both associations have acidic surface layers (pH 5.1 to 6.0) that are sometimes limed to raise the soil pH for certain crops (McWilliams, 1985). The clay fraction of soils is dominated by smectite, which probably is derived from the underlying Peoria loess (Burras and others, 1996).
The basin is underlain by flat-lying marine sedimentary rocks of Ordovician age consisting of the Dillsboro Formation and Saluda Formation (Gray and others, 1972; Renn and Arihood, 1991). The Dillsboro Formation consists of argillaceous, rubbly limestone and calcareous shale, and the overlying Saluda Formation is a gray, silty dolomitic limestone. The Saluda Formation is more resistant to weathering than the Dillsboro Formation and tends to be the ridge-forming rock unit, whereas the Dillsboro Formation is the valley-forming rock unit (Renn and Arihood, 1991). In the upland areas, the bedrock is covered by unconsolidated glacial till of late Wisconsinan age, which has an average thickness of 6 m. The till consists of clay to gravel-size deposits and, in parts of the basin, is mantled by a thin (30- to 100-cm) layer of Peoria loess (McWilliams, 1985).
 |
The South Hogan Creek Basin drains parts of Ripley and Dearborn Counties in southern Indiana. Land ownership in the basin is 99 percent private and 1 percent county and State (Irvin Harmeyer, U.S. Department of Agriculture Natural Resources Conservation Service, written commun., 1996). More than 80 km of paved and gravel roads provide access to most areas of the basin. Access to waterways is limited to rights-of-way at public road crossings.
Current land use in the basin is about 40 percent row crops, 30 percent pasture, and 30 percent forest (Irvin Harmeyer, written commun., 1996). Agricultural lands tend to be located on the upland plateau surface, and forested areas are concentrated along the drainages. The major row crops are corn and soybeans, which are tilled conventionally (Renn and Arihood, 1991). In addition to agricultural land, the basin contains the communities of Milan (population 1,530), Moores Hill (population 650), and part of Dillsboro (population 1,200). The town of Milan has some industrial development and a wastewater-treatment facility that discharges treated water into the head-waters of Milan Creek. Moores Hill has a wastewater-treatment facility that discharges into the headwaters of Whitaker Creek. Neither treatment facility was in operation when South Hogan Creek was selected as an HBN station (Cheryl Silcox, U.S. Geological Survey, written commun., 1997). Most residents in the basin obtain domestic water from reservoirs because the bedrock and glacial deposits are poor sources of ground water (Renn and Arihood, 1991). Other human-related activities in the basin include road salting, channel-bottom excavation for fossil exploration, several livestock yards, and an active freight-hauling railroad paralleling almost the entire length of the main channel of South Hogan Creek (Cheryl Silcox, written commun., 1997). The only change in land use since the establishment of the HBN site has been a slight increase in urban development (Irvin Harmeyer, written commun., 1996).
Historical Water-Quality Data and Time-Series Trends
The data set for the South Hogan Creek HBN Station analyzed for this report includes 189 water-quality samples that were collected from October 1968 through May 1993. Samples were collected monthly from 1969 through 1982 and quarterly from 1983 through 1993. Water-quality samples in the early part of the period of record probably were analyzed at a USGS laboratory in Columbus, Ohio, that was operated until 1973 (Durum, 1978). After establishment of the central laboratory system, samples were analyzed at a laboratory in Atlanta, Ga., from 1973 through 1985 and at the NWQL in Arvada, Colo., from 1986 through 1993. Daily discharge records are available for South Hogan Creek (station 03276700) from July 1961 through September 1993, and sediment discharge records are available from 1969 through 1993.
 |
Calculated ion balances for 186 samples with complete major-ion analyses are shown in Figures 7a and 7b. Temporal variation of discharge, field pH, major dissolved constituents, and ion balance at South Hogan Creek, Indiana. Ion balances ranged from -8.2 to 12 percent, and more than 95 percent of samples had values within the ±5 percent range, indicating that the analytical measurements were of high quality. The average charge balance for all samples was 0.4 percent, indicating that unmeasured constituents, such as organic anions, do not seem to contribute substantially to the ion balance of stream water at this site. No unusual patterns were evident in the time-series plots to indicate any method-related biases in the water-quality data for this HBN station (fig. 7).
Median concentrations and ranges of major constituents in stream water at the South Hogan Creek Station and VWM concentrations in wet-only precipitation measured at the Oxford NADP Station are listed in table 10. Precipitation chemistry at the NADP station, which is located about 63 km northeast of the HBN station, was dilute and acidic with a VWM pH of 4.3 for 12 years of record. The predominant cations were hydrogen, which accounted for 63 percent of the total cation charge, and ammonium, which accounted for 20 percent. Sulfate and nitrate were the predominant anions and contributed almost 95 percent of the total anion charge. The low pH and predominance of strong acid anions indicate that precipitation at the nearby NADP station probably is affected by anthropogenic emissions of sulfur and nitrogen compounds, which cause acid rain.
Table 10. Minimum, first quartile, median, third quartile, and maximum values of physical properties and major dissolved constituents measured in water-quality samples from South Hogan Creek, Indiana, October 1968 through May 1993, and volume-weighted mean concentrations in wet precipitation collected at the Oxford Station, Ohio
[Concentrations in units of microequivalents per liter, discharge in cubic meters per second, specific conductance in microsiemens per centimeter at 25 degrees Celsius, pH in standard units, and silica in micromoles per liter; n, number of stream samples; VWM, volume-weighted mean; inst., instantaneous; spec. cond., specific conductance; <, less than; --, not reported]
|
Parameter |
Stream Water |
Precipitation VWMa |
|||||
|
Minimum |
First quartile |
Median |
Third quartile |
Maximum |
n |
||
| Inst. discharge |
0.0003 |
0.045 |
0.25 |
0.76 |
64 |
187 |
-- |
| Spec. cond., field |
120 |
420 |
470 |
520 |
720 |
188 |
28 |
| pH, field |
6.4 |
7.8 |
8.1 |
8.3 |
9.5 |
187 |
4.3b |
| Calcium |
750 |
3,000 |
3,30 |
3,800 |
6,000 |
189 |
6.9 |
| Magnesium |
220 |
850 |
1,070 |
1,150 |
1,920 |
189 |
2.0 |
| Sodium |
78 |
400 |
480 |
610 |
1,260 |
188 |
3.2 |
| Potassium |
31 |
67 |
85 |
110 |
190 |
188 |
.5 |
| Ammonium |
<.7 |
1.4 |
2.1 |
2.9 |
11 |
57 |
16 |
| Alkalinity, laboratory |
700 |
2,800 |
3,320 |
3,760 |
5,500 |
188 |
-- |
| Sulfate |
310 |
960 |
1,200 |
1,410 |
2,500 |
189 |
57 |
| Chloride |
120 |
340 |
390 |
540 |
1,210 |
188 |
4.2 |
| Nitrite plus nitrate |
<.7 |
7.1 |
24 |
71 |
220 |
130 |
24c |
| Silica |
.7 |
55 |
88 |
110 |
200 |
189 |
-- |
a Data are volume-weighted mean concentrations for 1984-95.
b Laboratory pH.
c Nitrate only.
Stream water in South Hogan Creek is concentrated and strongly buffered; specific conductance ranged from 120 to 720 µmS/cm, and alkalinity was between 700 and 5,500 meq/L (table 10). The major ions in stream water were calcium and alkalinity, which accounted for almost 70 percent of the total ionic charge. The high concentrations of these ions in stream water are attributed to the dissolution of carbonate minerals in the limestone bedrock and glacial till. The median chloride
 |
The solute composition of stream water was further evaluated by analyzing correlations between solutes and stream discharge (table 11). Most solutes were weakly correlated with discharge, except for sodium (rho = -0.733), chloride (rho = -0.669), and nitrogen (rho = 0.703). For the solutes, the strongest correlations were found among the weathering-derived solutes, particularly calcium, magnesium, and alkalinity. The strong inverse correlations of sodium and chloride with discharge simply may be due to dilution of wastewater discharge during periods of increased discharge. Alternatively, these correlations may indicate that human activities have resulted in the contamination of the local ground-water system. Although nitrate also is derived primarily from human-related sources, it had a positive correlation with discharge. This indicates that nitrate primarily is transported during periods of high flow, probably due to surface runoff from agricultural lands and livestock yards. The strong correlations among calcium, magnesium, and alkalinity reflect the weathering of carbonate minerals, but the lack of correlation with discharge was somewhat unexpected. A more detailed examination of the data revealed that the concentrations of these constituents were, in fact, related to discharge, but the relation was not monotonic. Concentrations had the expected inverse correlation with discharge, but only for discharges greater than 0.03 m³/s. At flows less than 0.03 m³/s, stream-water concentrations were fairly constant as a function of discharge, perhaps reflecting a uniform source of streamflow from the bedrock aquifer.
Table 11. Spearman rank correlation coefficients (rho values) showing the relation among discharge, pH, and major dissolved constituents, South Hogan Creek, Indiana, 1969-93
[Q, discharge; Ca, calcium; Mg, magnesium; Na, sodium; K, potassium; Alk, alkalinity; SO4, sulfate; Cl, chloride; N, nitrite plus nitrate; Si, silica]
|
|
Q |
pH |
Ca |
Mg |
Na |
K |
Alk |
SO4 |
Cl |
N |
| pH |
0.345 |
|
|
|
|
|
|
|
|
|
| Ca |
-.250 |
0.303 |
|
|
|
|
|
|
|
|
| Mg |
-.333 |
.252 |
0.866 |
|
|
|
|
|
|
|
| Na |
-.733 |
-.206 |
.416 |
0.555 |
|
|
|
|
|
|
| K |
-.550 |
-.320 |
.033 |
-.052 |
0.487 |
|
|
|
|
|
| Alk |
-.264 |
.250 |
.914 |
.846 |
.388 |
-0.010 |
|
|
|
|
| SO4 |
-.429 |
.224 |
.728 |
.734 |
.617 |
.145 |
0.628 |
|
|
|
| Cl |
-.669 |
-.164 |
.406 |
.393 |
.871 |
.639 |
.354 |
0.569 |
|
|
| N |
.703 |
.122 |
-.020 |
-.230 |
-.426 |
-.316 |
-.126 |
-.216 |
-0.292 |
|
| Si |
.227 |
-.139 |
-.286 |
-.521 |
-.287 |
.221 |
-.358 |
-.399 |
-.126 |
0.478 |
Results of the seasonal Kendall test for trends in discharge and major dissolved constituents are listed in table 12. No statistically significant trends were observed at the South Hogan Creek Station at the 0.01 probability level. Upward trends in flow-adjusted pH and sulfate concentrations were detected at a slightly less significant level of p £ 0.02. The lack of trends in most dissolved constituents, particularly sodium, chloride, and nitrate, indicates that land-use activities in the basin, such as road salting, agricultural runoff, and wastewater discharge, have remained fairly constant during the period of record. The source of trends in flow-adjusted pH and sulfate concentrations are less clear. Atmospheric deposition of sulfate has decreased substantially in the industrialized Midwest since the 1970's (Husar and others, 1991); however, changes in precipitation chemistry probably would not have much of an effect on stream chemistry in this basin because of the large internal source of sulfate from weathering. The trends in sulfate and pH also might be caused by changes in land use; however, there are few human-related activities that would impact pH and sulfate concentrations without also affecting the concentrations of the other dissolved constituents, particularly chloride, sodium, and nitrate.
Table 12. Results of the seasonal Kendall test for trends in discharge and unadjusted and flow-adjusted pH and major dissolved constituents, South Hogan Creek, Indiana, October 1968 through May 1993
[Trends in units of microequivalents per liter per year, except discharge in cubic meters per second per year, pH in standard units per year, and silica in micromoles per liter per year; inst., instantaneous; <, less than; --, not calculated]
|
Parameter |
Unadjusted |
Flow adjusted |
||
|
Trend |
p-value |
Trend |
p-value |
|
| Discharge |
-0.001 |
0.294 |
-- |
-- |
| pH |
.02 |
.025 |
0.02 |
0.015 |
| Calcium |
-4.4 |
.446 |
-3.1 |
.649 |
| Magnesium |
<.1 |
.225 |
-1.8 |
.221 |
| Sodium |
.1 |
.698 |
-1.4 |
.494 |
| Potassium |
.6 |
.064 |
.6 |
.113 |
| Alkalinity |
-3.3 |
.688 |
1.0 |
.887 |
| Sulfate |
-7.7 |
.111 |
-7.6 |
.020 |
| Chloride |
1.8 |
.331 |
2.6 |
.139 |
| Nitrite plus nitrate |
.3a |
.763 |
-- |
-- |
| Silica |
-.6 |
.108 |
-.8 |
.053 |
a Trend calculated for 1974-93 using a trend test for censored data.
Synoptic Water-Quality Data
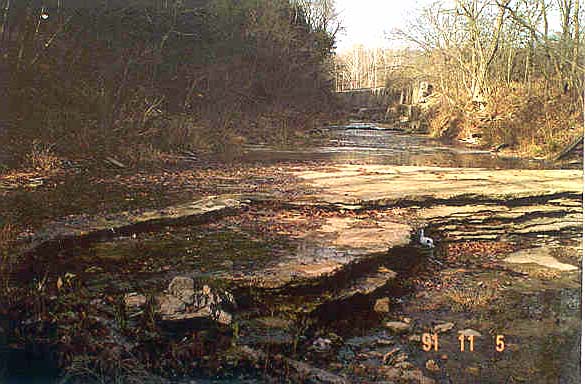
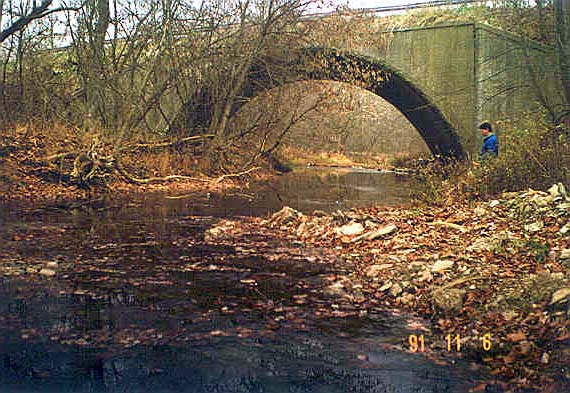
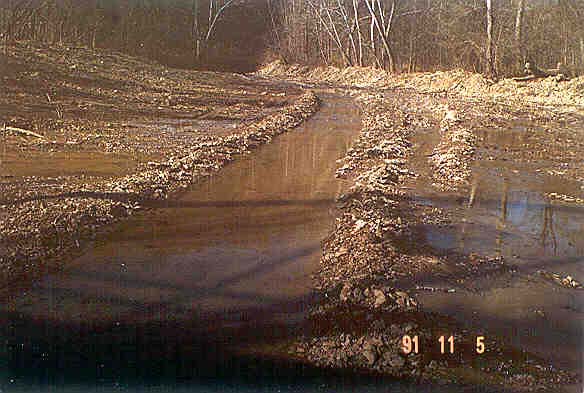
Results of the surface-water synoptic sampling in the South Hogan Creek Basin on November 5 and 6, 1991, are listed in table 13, and the locations of the sampling sites are shown in figure 6. During the sampling period, discharge at the gaging station was about 0.01 m³/s compared to the median discharge of 0.15 m³/s for November (Lawrence, 1987), indicating that the basin was sampled during low-flow conditions for that time of year. Because of the low-flow conditions, solute concentrations measured at site 1 were greater than the third-quartile concentrations reported for the HBN station during the entire period of record (table 10). The tributary streams were similar in composition to stream water collected at the gaging station (site 1); calcium and magnesium were the predominant cations, and bicarbonate and sulfate were the predominant anions. Ion balances for the synoptic samples were around zero (range -2.4 to 2.4 percent), indicating that unmeasured constituents, such as organic anions, did not seem to be an important component of stream water during the sampling period.
Table 13. Physical properties and major dissolved constituents from surface-water sampling sites in the South Hogan Creek Basin, Indiana, collected November 5-6, 1991
[Site locations shown in fig. 6; Q, discharge in cubic meters per second; SC, specific conductance in microsiemens per centimeters at 25 degrees Celsius; Ca, calcium; Mg, magnesium; Na, sodium; K, potassium; Cl, chloride; NO3, nitrate; SO4, sulfate; Alk, alkalinity; Si, silica; concentrations in microequivalents per liter, except silica in micromoles per liter; WTP, wastewater-treatment plant; --, not reported; criteria used in selection of sampling sites: BG = bedrock geology, MT = major tributary, LU = land use]
|
Site |
Station number |
Q |
SC |
pH |
Ca |
Mg |
Na |
K |
Alk |
SO4 |
Cl |
NO3 |
Si |
Criteria |
Remarks |
|
1 |
3276700 |
0.0096 |
720 |
8.2 |
4,650 |
1,200 |
1,090 |
160 |
4,000 |
2,040 |
1,320 |
0.7 |
110 |
-- |
Gaging station |
|
2 |
390241085031600 |
-- |
670 |
8.5 |
4,600 |
1,280 |
830 |
62 |
3,540 |
2,710 |
850 |
.4 |
120 |
MT | Downstream from Moores Hill |
|
3 |
390246085034400 |
.0079 |
650 |
8.1 |
3,800 |
1,040 |
1,130 |
200 |
3,700 |
1,440 |
730 |
.6 |
87 |
MT, BG | Limestone bedrock |
|
4 |
390456085074700 |
-- |
590 |
7.6 |
3,900 |
1,200 |
370 |
250 |
4,700 |
400 |
560 |
3.4 |
170 |
MT, BG | Glacial till |
|
5 |
390500085095100 |
-- |
660 |
8.2 |
3,500 |
2,000 |
780 |
160 |
5,300 |
500 |
730 |
3.5 |
160 |
BG | Glacial till |
|
6 |
390502085092800 |
-- |
320 |
7.8 |
1,850 |
620 |
130 |
200 |
2,480 |
180 |
160 |
.6 |
63 |
BG | Glacial till |
|
7 |
390550085100300 |
-- |
640 |
7.9 |
3,350 |
2,000 |
870 |
460 |
5,620 |
520 |
510 |
3.4 |
230 |
BG | Glacial till |
|
8 |
390620085053700 |
.0017 |
100 |
8.0 |
4,100 |
1,680 |
3,740 |
240 |
5,680 |
1,650 |
1,940 |
590 |
270 |
LU | Downstream from WTP |
|
9 |
390706085073700 |
.0059 |
830 |
7.4 |
2,650 |
960 |
3,000 |
440 |
1,520 |
1,480 |
2,510 |
1,710 |
120 |
LU | Downstream from WTP |
|
10 |
390715085073500 |
.0006 |
560 |
7.7 |
3,300 |
1,120 |
610 |
150 |
2,780 |
1,400 |
760 |
29 |
110 |
LU | Upstream from WTP |
Considerable spatial variability in stream chemistry was measured in the South Hogan Creek Basin, particularly for sodium, chloride, and nitrate, which seems to be related to wastewater discharge from treatment facilities in the towns of Milan and Moores Hill. For example, chloride concentrations in tributaries sampled downstream from the towns of Moores Hill (site 8) and Milan (site 9) were 1,940 and 2,510 meq/L (table 13), respectively, compared to the average concentration of 580 meq/L at background sites in the basin (sites 3-7, 10). Sodium concentrations were 3,740 and 3,000 meq/L at sites 8 and 9, respectively, compared to the average background concentration of 650 meq/L. The most substantial difference in concentration was measured for nitrate, which had a concentration of 590 meq/L at site 8 and 1,710 meq/L at site 9 compared to the average background concentration of less than 10 meq/L. The synoptic samples also demonstrate that the water quality downstream at the HBN station was impacted by the wastewater-treatment facilities based on the elevated chloride concentration measured at site 1. By contrast, the nitrate concentration measured at site 1 was similar to background concentrations, implying that, at least during low-flow conditions, the biota were capable of consuming excess nitrate upstream from the HBN station. In contrast to sodium, chloride, and nitrate, the concentration patterns of the weathering-derived constituents were more uniform across the basin. For example, calcium concentrations ranged from 1,850 to 4,600 meq/L, and magnesium ranged from 620 to 2,000 meq/L. This pattern not only reflects the widespread presence of carbonate minerals in the glacial till and bedrock, but indicates that the towns of Milan and Moores Hill did not greatly affect the concentrations of these constituents in surface water. Sulfate concentrations were much lower in tributaries in the western one-half of the basin compared to the eastern one-half. For example, the average sulfate concentration at sites 4, 5, 6, and 7 was 400 meq/L compared to the average concentration of 1,740 meq/L at sites 2, 3, 8, 9, and 10. One explanation for this spatial pattern is a difference in bedrock mineralogy between these two areas of the basin. The streams in the northwestern part of the basin drain areas covered by glacial till, whereas drainages in the southeastern part of the basin are incised into the Ordovician bedrock, which, in places, contains evaporite beds of gypsum and anhydrite.
References Cited
Bailey, R.G., Avers, P.E., King, T., and McNab, W.H., eds., 1994, Ecoregions and subregions of the United States with supplementary table of map unit descriptions: Washington, D.C., U.S. Department of Agriculture Forest Service, scale 1:7,500,000(also at URL http://www.fs.fed.us/land/ecosysmgmt/ecoreg1_home.html, accessed 1998).
Burras, L., Smeck, N.E., and Bigham, J.M., 1996, Origin and properties of smectite in loess-derived soils of western Ohio: Soil Science Society of America, v. 60, p. 1961-1968.
Durum, W.H., 1978, Historical profile of quality of water laboratories and activities, 1879-1973: U.S. Geological Survey Open-File Report 78-432, 235 p.
Homoya, M.A., Abrell, D.B., Aldrich, J.R., and Post, T.W., 1985, The natural regions of Indiana: Indiana Academy of Science, v. 94, p. 245-268.
Gray, H.H., Forsyth, J.L., Schneider, A.F., and Gooding, A.M., 1972, Regional geologic map no. 7, Cincinnati sheet, part B: Bloomington, Indiana Geological Survey, 1 sheet, scale 1:250,000.
Kross, B.C., 1990, The Iowa State-wide rural well-water survey, water-quality data-Initial analysis: Iowa Department of Natural Resources Technical Information Series 19, 142 p.
Lawrence, C.L., 1987, Streamflow characteristics at hydrologic benchmark stations: U.S. Geological Survey Circular 941, 123 p.
McWilliams, K.M., 1985, Soil survey of Ripley County and part of Jennings County, Indiana: U.S. Department of Agriculture Soil Conservation Service, 125 p.
Renn, D.E., and Arihood, L.D., 1991, Sedimentation in Versailles Lake, Ripley County, southeastern Indiana, 1956- 88: U.S. Geological Survey Water-Resources Investigations Report 92-4011, 63 p.
Stewart, J.A., Keeton, C.R., Benedict, B.L., and Hammil, L.E., 1994, Water resources data, Indiana, water year 1993: U.S. Geological Survey Water-Data Report IN-93-1, 344 p.
Appendix A. List of Map References
a. U.S. Geological Survey topographic maps:
- Dillsboro, Indiana (1:24,000), 1980, gaging station on this quadrangle
- Milan, Indiana (1:24,000), 1980
- Pierceville, Indiana (1:24,000), 1980
- Greensburg, Indiana (1:100,000), 1986
b. Geologic maps:
- Gray, H.H., Forsyth, J.L., Schneider, A.F., and Gooding, A.M., 1972, Regional geologic map no. 7, Cincinnati sheet, part B: Bloomington, Indiana Geological Survey, 1 sheet, scale 1:250,000.
c. Soil surveys:
- McWilliams, K.M., 1985, Soil survey of Ripley County and part of Jennings County, Indiana: U.S. Department of Agriculture Soil Conservation Service, 125 p.
- Nickell, A.K., 1981, Soil survey of Dearborn and Ohio Counties, Indiana: U.S. Department of Agriculture Soil Conservation Service.
d. Miscellaneous maps:
- U.S. Department of Agriculture, 1986, Important farmland, Ripley County, Indiana: U.S. Department of Agriculture Soil Conservation Service, scale 1:50,000.
Appendix B. NWIS Site-Identification Numbers
Table B-1. NWIS site-identification numbers and site names for water-quality sampling sites.
|
Site |
Identification Number |
Site Name |
|
1 |
03276700 |
SOUTH HOGAN CR NR DILLSBORO INDIANA |
|
2 |
390241085031600 |
WHITAKER CR ABOVE DILLSBORO INDIANA |
|
3 |
390246085034400 |
S HOGAN CR AB CHANCE BRANCH NR DILLSBORO INDIANA |
|
4 |
390456085074700 |
S HOGAN CR AT HWY 101 NR MILAN INDIANA |
|
5 |
390500085095100 |
S HOGAN CR AT 525 EAST RD NR STRINGTOWN INDIANA |
|
6 |
390502085092800 |
NORTHEAST TRIB OF S HOGAN CR NR STRINGTOWN INDIANA |
|
7 |
390550085100300 |
S HOGAN CR AB HOG FARM NR STRINGTOWN INDIANA |
|
8 |
390620085053700 |
WHITAKER CR BLW MOORES HILL INDIANA |
|
9 |
390706085073700 |
MILAN CR BELOW WWTP AT MILAN INDIANA |
|
10 |
390715085073500 |
MILAN CR AB WWTP AT MILAN INDIANA |