
Hydrologic Benchmark Network Stations in the Midwestern U.S. 1963-95 (USGS Circular 1173-B)
|
|
|
|
|
Elk Creek near Decatur City, Iowa (Station 06897950)
To download a printer friendly PDF version of this information click here.
This report details one of the approximately 50 stations in the Hydrologic Benchmark Network (HBN) described in the four-volume U.S. Geological Survey Circular 1173. The suggested citation for the information on this page is:
|
Mast, M.A., and Turk, J.T., 1999, Environmental characteristics and water quality of Hydrologic Benchmark Network stations in the Midwestern United States, 1963-95: U.S. Geological Survey Circular 1173-B, 130 p. |
All of the tables and figures are numbered as they appear in each circular. Use the navigation bar above to view the abstract, introduction and methods for the entire circular, as well as a map and list of all of the HBN sites. Use the table of contents below to view the information on this particular station.
|
Table of Contents |
| 1. Site Characteristics and Land Use |
| 2. Historical Water Quality Data and Time-Series Trends |
| 3. Synoptic Water Quality Data |
Site Characteristics and Land Use
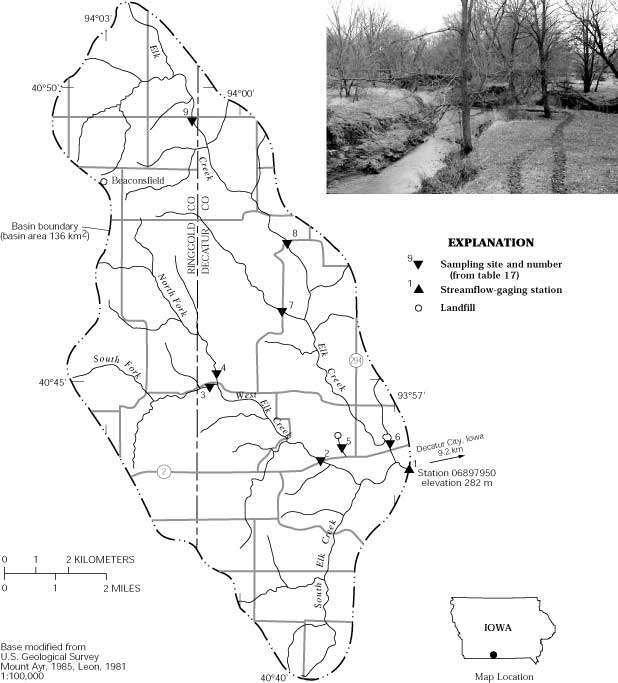
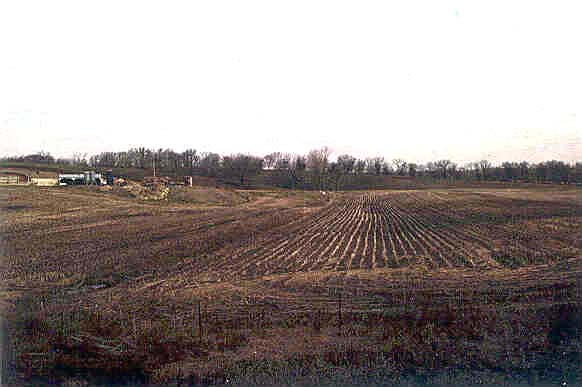
The Elk Creek HBN Basin is located in the Central Lowland physiographic province in southern Iowa in the landform region known as the Southern Iowa Drift Plain (Figure 8. Map showing study area in the Elk Creek Basin and photograph of the North Fork of West Elk Creek). The landscape is formed by a broad loess-covered drift plain strongly incised by streams to form rolling hills and ridges. The HBN basin drains 136 km² of this dissected terrain and ranges in elevation from 282 m at the gaging station to 360 m on the surface of the almost level upland divide. The USGS gaging station is located 9.2 km southwest of Decatur City, Iowa, at latitude 40×43'18'' and longitude 93×56'12''. Elk Creek flows southeast into the Grand River, a tributary of the Missouri River, and has a channel length of about 15.8 km upstream from the gaging station and an average stream gradient of 3.3 m/km. Mean monthly discharge at the gaging station ranges from 0.36 m³/s in August to 1.9 m³/s in April; there are occasional periods of no flow in fall and early winter (September through December). Average annual runoff from the basin was 23 cm from 1968 through 1994 (Southard and others, 1994). The climate is characterized by cold winters and hot summers (DeWitt, 1990). Average daily air temperatures range from -6.6×C in January to 24.6×C in July. Average annual precipitation is 92 cm, of which about two-thirds falls from April through September (DeWitt, 1990). The average seasonal snowfall is 67 cm, and on average, 43 days each year have at least 2 cm of snow on the ground.
 |
The Elk Creek Basin is in the Prairie Parkland ecoregion, which is characterized by intermingled prairie, groves, and strips of deciduous trees (Bailey and others, 1994). Forest vegetation covers about 10 percent of the basin and is concentrated along the flood plains and on steep upland hillslopes. The upland forests consist of white oak, northern red oak, black oak, bur oak, shagbark hickory, bitternut hickory, honeylocust, and eastern red cedar (DeWitt, 1990). The principal species along the flood plain are eastern cottonwood, silver maple, willow, green ash, basswood, and black walnut. Forests in the area are generally of poor quality because of the cumulative effects of selective cutting practices and cattle grazing (DeWitt, 1990). The native prairie grasses are big bluestem, little bluestem, switchgrass, and Indian grass; however, little of this vegetation type exists because most of the basin is cultivated. Soils on the hillslopes and uplands are classified as Alfisols (Hapludalfs) and are mapped in the Gara-Armstrong-Lineville soil association (DeWitt, 1990; Boeckman, 1992). These are moderately well-drained, silty, and loamy soils formed in glacial till and loess. The soil profiles are characterized by a surface layer of dark grayish-brown friable loam that is 15 to 30 cm thick overlying a subsoil of mottled, yellowish-brown firm clay loam or loam that extends to a depth of 150 cm. Soils developed in the flood plain are primarily mapped in the Nottaway-Lawson-Zook association (DeWitt, 1990). These are flat-lying, moderately to poorly drained, silty soils formed in alluvium.
Bedrock in the basin consists of flat-lying marine sediments of the Lansing and Kansas City Groups of Pennsylvanian age (Arey, 1916; Cagle and Heinitz, 1978). The Lansing Group consists of thin-bedded limestones and interbedded red and green shales and overlies the Kansas City Group, which consists of alternating beds of limestone and shale. Limestone beds in the Kansas City Group are quite permeable and form an important aquifer in the area (Cagle and Heinitz, 1978). The topography of the bedrock surface is a result of a complex system of ancient drainages, but is covered almost everywhere by unconsolidated deposits of glacial drift, loess, and alluvium as much as 60 m thick (Cagle, 1973). The drift consists predominantly of sand, pebbly clay, and gravel deposits of varying thickness and extent. Aquifers in the drift are an important source of small water supplies for domestic and livestock use (Cagle, 1967).
 |
The Elk Creek Basin drains parts of Ringgold and Decatur Counties in southern Iowa. Land ownership in the basin is 98 percent private and 2 percent county and State (Kevin Reynolds, U.S. Department of Agriculture Natural Resources Conservation Service, written commun., 1996). Roughly 120 km of paved and gravel roads provide access to most areas of the basin. A 9-km segment of State Highway 2 runs from east to west in the southern one-half of the basin. County and State roads are plowed and salted in winter. Access to waterways is limited to rights-of-way at public road crossings.
Land use in the Elk Creek Basin is 10 percent forest, 55 percent row crops, and 35 percent pasture land (Kevin Reynolds, written commun., 1996). The percentage of agricultural land in the basin has changed very little since the HBN station was established, except for a slight increase in cropland and a decrease in cattle production. The primary row crops are corn and soybeans, and the major hay crops are legume-grass mixtures. Forested areas, which are used for timber harvesting and grazing, are primarily located along the main channel of Elk Creek and along upland tributaries. In addition to agricultural lands, the basin contains several cattle feedlots, hundreds of stockponds, a number of rural residences, and the small community of Beaconsfield (population 27). Most residents use shallow ground water as a domestic water supply. The county land- fill located in the basin was built in the late 1970's. Between 1985 and 1995, about 25 percent of agricultural land in the basin was converted to permanent vegetation types through the Conservation Reserve Program (CRP) (Wayde Ross, written commun., 1996). The U.S. Department of Agriculture instituted the CRP in 1985 as a means of reducing soil erosion from highly erodible croplands. Under the CRP, farmers are paid in exchange for planting permanent vegetation types, such as sod-forming grasses and legumes, and implementing erosion controls, such as creating riparian buffer strips (Wayde Ross, U.S. Department of Agriculture Natural Resources Conservation Service, written commun., 1996).
Historical Water-Quality Data and Time-Series Trends
The data set analyzed for the Elk Creek HBN Station for this report includes 154 water-quality samples that were collected from February 1968 through August 1994. Sampling frequency ranged from bimonthly to monthly from 1968 through 1982 and quarterly from 1983 through 1994. Water-quality samples in the early part of the period of record were probably analyzed at a USGS laboratory in Lincoln, Nebr., that operated until 1973 (Durum, 1978). After the establishment of the central laboratory system, samples were analyzed at a laboratory in Salt Lake City, Utah, from 1973 through 1975 and at the NWQL in Arvada, Colo., from 1976 through 1994. Daily discharge records are available for Elk Creek (station 06897950) from October 1967 through September 1994. The gaging station was moved about 90 m downstream on June 21, 1974, because of serious bank erosion at the upstream location (Joe Gorman, U.S. Geological Survey, oral commun., 1997).
 |
Calculated ion balances for 146 samples with complete major-ion analyses are shown in Figures 9a and 9b. Temporal variation of discharge, field pH, major dissolved constituents, and ion balance at Elk Creek, Iowa. Ion balances ranged from -18 to 23 percent, and more than 95 percent of samples had values within the ±5 percent range, indicating that the analytical measurements were of high quality. The average charge balance for all samples was 1.0 percent, indicating that unmeasured constituents, such as organic anions, do not seem to contribute substantially to the ion balance of stream water at this station. Time-series plots of the major constituents were inspected for evidence of method-related effects (fig. 9). No unusual patterns were apparent, except for a slight decrease in data scatter for most constituents in the later one-half of the period of record. This pattern in data scatter may be related to a change in the distribution of sample discharge values due to a reduction in sampling frequency in 1983. Alternatively, the decrease in data scatter may reflect improvements in analytical methods during the period of record.
Median concentrations and ranges of major constituents in stream water at the Elk Creek Station and VWM concentrations in wet-only deposition measured at the McNay Research Center NADP Station are listed in table 14. Precipitation chemistry at the NADP station, which is located about 57 km east of the HBN station, was dilute and slightly acidic with a VWM pH of 4.9 for 12 years of record. The predominant cations were ammonium, which contributed 39 percent of the total cation charge, and calcium and hydrogen, which accounted for 28 and 22 percent, respectively. Sulfate composed 58 percent of the total anions and nitrate contributed 36 percent. The predominance of strong acid anions at this site indicates that precipitation may be affected by anthropogenic emissions of sulfur and nitrogen compounds, which cause acid rain. In addition, the relatively high ammonium concentrations in precipitation may be linked to the high density of livestock in this region of the country.
Table 14. Minimum, first quartile, median, third quartile, and maximum values of physical properties and major dissolved constituents measured in water-quality samples from Elk Creek, Iowa, February 1968 through August 1994, and volume-weighted mean concentrations in wet precipitation collected at the McNay Research Center Station, Iowa
[Concentrations in units of microequivalents per liter, discharge in cubic meters per second, specific conductance in microsiemens per centimeter at 25 degrees Celsius, pH in standard units, and silica in micromoles per liter; n, number of stream samples; VWM, volume-weighted mean; inst., instantaneous; spec. cond., specific conductance; <, less than; --, not reported]
|
Parameter |
Stream Water |
Precipitation VWMa |
|||||
|
Minimum |
First quartile |
Median |
Third quartile |
Maximum |
n |
||
| Discharge, inst. |
0.0001 |
0.034 |
0.16 |
0.42 |
140 |
152 |
-- |
| Spec. cond., field |
90 |
440 |
500 |
560 |
900 |
151 |
13 |
| pH, field |
6.6 |
7.7 |
7.9 |
8.1 |
8.9 |
151 |
4.9b |
| Calcium |
950 |
3,150 |
3,700 |
4,230 |
6,500 |
154 |
16 |
| Magnesium |
230 |
1,150 |
1,400 |
1,480 |
2,220 |
153 |
2.4 |
| Sodium |
44 |
410 |
480 |
520 |
1,040 |
154 |
2.8 |
| Potassium |
46 |
87 |
110 |
130 |
380 |
151 |
.9 |
| Ammonium |
.6 |
3.3 |
7.2 |
17 |
170 |
37 |
22 |
| Alkalinity, laboratory |
1,040 |
3,415 |
4,200 |
4,710 |
7,300 |
148 |
-- |
| Sulfate |
21 |
830 |
1,060 |
1,330 |
2,290 |
154 |
32 |
| Chloride |
<2.8 |
190 |
230 |
280 |
730 |
153 |
3.1 |
| Nitrite plus nitrate |
<.7 |
5.8 |
25 |
59 |
170 |
100 |
20c |
| Silica |
42 |
150 |
180 |
200 |
370 |
153 |
-- |
a Data are volume-weighted mean concentrations for 1984-95.
b Laboratory pH.
c Nitrate only.
Stream water in Elk Creek is fairly concentrated and strongly buffered; specific conductance ranged from 90 to 900 mS/cm, and the alkalinity was between 1,040 and 7,300 meq/L. Calcium and magnesium were the predominant cations, and bicarbonate was the predominant anion. The high concentrations of these solutes in stream water is attributed to the presence of limestone bedrock and of carbonate minerals in the near-surface till and loess deposits. The median concentration of chloride in stream water was 230 meq/L, which is more than 70 times greater than VWM concentration of 3.1 meq/L in precipitation. This large difference in concentration indicates that most stream-water chloride is derived from sources other than precipitation. Stream-water chloride at this site probably is derived from a combination of natural and human-related sources; however, fertilizer and road salt are probably the largest contributors. Sulfate concentrations also were much higher in stream water than in precipitation. The main source of sulfate, other than atmospheric deposition, probably is dissolution of gypsum and anhydrite minerals present in variable amounts in the limestones and shales (Kross, 1990). Stream water at this site had low, but detectable, concentrations of inorganic nitrogen species. The median stream-water concentrations of nitrate and ammonium were 25 and 7.2 meq/L, respectively, compared to 20 and 22 meq/L, respectively, in precipitation. Although stream-water nitrate concentrations were low compared to the concentration of 3 mg/L (214 meq) considered indicative of human-related pollution in Iowa (Kross, 1990), they were substantially higher than nitrate concentrations at most stations in the HBN, indicating that agricultural activities had a small, but detectable, effect on the stream-water nutrient concentrations at this station.
 |
The solute composition of stream water was further evaluated by analyzing correlations between solutes and stream discharge (table 15). The major weathering constituents had strong correlations with discharge, except for potassium, sulfate, and silica. These inverse correlations are consistent with a hydrologic system where more concentrated ground water, which provides most of the discharge during low-flow conditions, is diluted with water from shallower ground-water sources during periods of increased discharge. In contrast, nitrate was positively correlated with discharge (rho = 0.670), which may be due to surface runoff from agricultural lands and livestock yards. Fertilizer and manure are sources of nitrate that are most likely to be transported to the stream during periods of increased discharge. The lack of correlation between sulfate and discharge (rho = -0.179) was somewhat unexpected because most of the sulfate probably is derived from bedrock sources. A more detailed examination of the data indicated that sulfate concentrations did vary with discharge, but the relation was not monotonic. Sulfate had the expected inverse relation with discharge, but only for discharges greater than 0.03 m³/s. At flows less than 0.03 m³/s, sulfate concentrations generally decreased with decreasing discharge. One explanation for this pattern is variation in ground-water chemistry. Simpkins and Burkart (1996) studied shallow ground water in a small agricultural basin in central Iowa and found that an unoxidized zone existed below about 4 m and that in this zone, much of the sulfate was being removed by sulfate reduction. Because ground water would be an increasingly important component of streamflow during low-flow conditions, the presence of a reducing zone in the ground-water aquifer might explain the decrease in stream-water sulfate concentrations at very low flows.
Table 15. Spearman rank correlation coefficients (rho values) showing the relation among discharge, pH, and major dissolved constituents, Elk Creek, Iowa, 1968-94
[Q, discharge; Ca, calcium; Mg, magnesium; Na, sodium; K, potassium; Alk, alkalinity; SO4, sulfate; Cl, chloride; N, nitrite plus nitrate; Si, silica]
|
|
Q |
pH |
Ca |
Mg |
Na |
K |
Alk |
SO4 |
Cl |
N |
| pH |
0.150 |
|
|
|
|
|
|
|
|
|
| Ca |
-.671 |
-0.159 |
|
|
|
|
|
|
|
|
| Mg |
-.789 |
-.165 |
0.877 |
|
|
|
|
|
|
|
| Na |
-.685 |
-.047 |
.746 |
0.901 |
|
|
|
|
|
|
| K |
-.175 |
-.172 |
-.138 |
-.060 |
-0.125 |
|
|
|
|
|
| Alk |
-.770 |
-.125 |
.904 |
.883 |
.749 |
-0.176 |
|
|
|
|
| SO4 |
-.179 |
-.144 |
.506 |
.512 |
.592 |
-.203 |
0.244 |
|
|
|
| Cl |
-.641 |
-.129 |
.277 |
.438 |
.416 |
.401 |
.296 |
0.141 |
|
|
| N |
.670 |
-.102 |
-.648 |
-.695 |
-.612 |
.185 |
-.755 |
-.101 |
-0.264 |
|
| Si |
.488 |
-.108 |
-.134 |
-.268 |
-.287 |
-.225 |
-.208 |
-.042 |
-.429 |
0.543 |
Results of the seasonal Kendall test for trends in discharge and major dissolved constituents are listed in table 16. No statistically significant trends were observed at the Elk Creek Station at the 0.01 probability level. Downward trends in magnesium and silica and an upward trend in chloride were detected at a slightly less significant level of p £ 0.05. The significance of all three trends increased to p £ 0.02 after the concentrations were adjusted for stream- flow variability. The observed trends in stream chemistry at this station are more likely related to changes in land-use activities rather than to trends in atmospheric deposition, considering that stream water is substantially more concentrated than precipitation. A number of land-use practices could have caused an increase in stream-water chloride, including road salting, fertilizer application, or leaching of the county landfill that was constructed in the early 1970's. The cause of the downward trends in magnesium and silica concentrations is not clear. Because both of these constituents primarily are derived from weathering, one possible explanation is a decrease in sedimentation to streams as a result of reductions in soil erosion from agricultural lands. Although estimates of erosion rates are not available for the Elk Creek Basin, a reduction in soil erosion may have occurred as a result of the CRP, which resulted in the conversion of about 25 percent of cropland in the basin to permanent vegetation types between 1985 and 1995.
Table 16. Results of the seasonal Kendall test for trends in discharge and unadjusted and flow-adjusted pH and major dissolved constituents, Elk Creek, Iowa, February 1968 through August 1994
[Trends in units of microequivalents per liter per year, except discharge in cubic meters per second per year, pH in standard units per year, and silica in micromoles per liter per year; inst., instantaneous; <, less than; --, not calculated]
|
Parameter |
Unadjusted |
Flow adjusted |
||
|
Trend |
p-value |
Trend |
p-value |
|
| Discharge |
0.001 |
0.111 |
-- |
-- |
| pH |
<.01 |
.469 |
(a) |
-- |
| Calcium |
<.1 |
.937 |
1.5 |
0.853 |
| Magnesium |
-5.3 |
.028 |
-5.2 |
.015 |
| Sodium |
<.1 |
.287 |
-1.0 |
.194 |
| Potassium |
-.2 |
.507 |
-.2 |
.579 |
| Alkalinity |
-5.0 |
.701 |
-2.5 |
.820 |
| Sulfate |
-7.0 |
.163 |
-6.3 |
.131 |
| Chloride |
2.6 |
.032 |
2.6 |
.014 |
| Nitrite plus nitrate |
.9b |
.421 |
-- |
-- |
| Silica |
-1.2 |
.043 |
-1.5 |
.020 |
a Flow model not significant at a = 0.10.
b Trend calculated for 1974-94 using a trend test for censored data.
Synoptic Water-Quality Data
Results of the surface-water synoptic sampling in the Elk Creek Basin on April 6 and 7, 1993, are listed in table 17, and the locations of sampling sites are shown in figure 8. During the sampling period, discharge at the gaging station was about 0.4 m³/s compared to the median daily discharge of 0.5 m³/s for April (Lawrence, 1987), indicating that the basin was sampled during normal flow conditions for that time of year. Solute concentrations measured at site 1 during the synoptic sampling were below the median concentrations reported for the HBN station during the entire period of record, except for silica (table 14). The tributary streams were similar in composition to stream water collected at the gaging station (site 1); calcium and magnesium were the predominant cations, and bicarbonate was the predominant anion. Ion balances for all samples were close to zero (range -0.5 to 1.8 percent), indicating that unmeasured ions, such as organic anions, did not seem to be an important component of stream water during the sampling period.
Table 17. Physical properties and major dissolved constituents from surface-water sampling sites in the Elk Creek Basin, Iowa, collected April 6 and 7, 1993
[Site locations shown in fig. 8; Q, discharge in cubic meters per second; SC, specific conductance in microsiemens per centimeters at 25 degrees Celsius; pH in standard units; Ca, calcium; Mg, magnesium; Na, sodium; K, potassium; Alk, alkalinity; SO4, sulfate; Cl, chloride; NO3, nitrate; Si, silica; concentrations in microequivalents per liter, except silica in micromoles per liter; --, not reported; criteria used in selection of sampling sites: MT = major tributary, LU = land use]
|
Site |
Station number |
Q |
SC |
pH |
Ca |
Mg |
Na |
K |
Alk |
SO4 |
Cl |
NO3 |
Si |
Criteria |
Remarks |
|
1 |
6897950 |
0.43 |
480 |
8.2 |
3,400 |
1,200 |
410 |
74 |
3,820 |
1,020 |
170 |
18 |
220 |
-- |
Gaging station |
|
2 |
404337093580900 |
.32 |
490 |
8.1 |
3,500 |
1,200 |
420 |
77 |
3,840 |
1,000 |
160 |
12 |
220 |
MT, LU | Pasture and cropland |
|
3 |
404501094002800 |
-- |
450 |
8.2 |
3,250 |
1,120 |
360 |
51 |
3,580 |
980 |
99 |
2.4 |
200 |
MT, LU | Pasture and cropland |
|
4 |
404504094002600 |
-- |
440 |
8.1 |
3,000 |
1,040 |
360 |
64 |
3,520 |
880 |
100 |
5.6 |
220 |
MT, LU | Pasture and cropland |
|
5 |
404343093573900 |
.0028 |
560 |
8.0 |
4,000 |
1,600 |
650 |
46 |
5,180 |
580 |
450 |
29 |
200 |
LU | Downstream from landfill |
|
6 |
404348093564000 |
.34 |
460 |
8.1 |
3,200 |
1,120 |
430 |
72 |
3,680 |
880 |
180 |
22 |
220 |
MT, LU | Pasture and cropland |
|
7 |
404611093590600 |
.050 |
470 |
8.1 |
3,100 |
1,120 |
430 |
72 |
3,360 |
1,250 |
150 |
13 |
200 |
LU | Pasture land and feedlots |
|
8 |
404723093585800 |
-- |
420 |
8.1 |
2,800 |
1,040 |
390 |
38 |
3,400 |
730 |
150 |
19 |
220 |
LU | Pasture land and feedlots |
|
9 |
404932094005800 |
.11 |
400 |
8.0 |
2,650 |
1,040 |
380 |
59 |
3,260 |
630 |
170 |
21 |
200 |
LU | Pasture land |
In general, concentrations of the major solutes did not vary markedly among the sampled tributary sites. For example, alkalinity ranged from a minimum of 3,260 meq/L at site 9 to a maximum of 5,180 meq/L at site 5 (table 17). Calcium concentrations ranged from 2,650 to 4,000 meq/L, and magnesium ranged from 1,040 to 1,600 meq/L. Sulfate concentrations had a slightly broader range of concentrations from 580 meq/L at site 5 to 1,250 meq/L at site 7. The widespread presence and rapid weathering rates of carbonate minerals in the bedrock and in surfical deposits are the most likely reasons for the lack of much spatial variation in the concentrations of the major solutes. The slightly broader range of sulfate concentrations may reflect local variations in the distribution of evaporite beds in the underlying Pennsylvanian shales and limestones. Chloride and sodium concentrations were fairly uniform across the basin, with the exception of site 5. The chloride concentration at this site was 450 meq/L compared to the average concentration of 150 meq/L for the other eight sampling sites. This stream was sampled just downstream from the county landfill, indicating that the landfill may be a point source of contaminants to surface water. Nitrate concentrations ranged from 2.4 to 29 meq/L and were low, considering the amount of agricultural activity in the basin.
References Cited
Arey, M.F., 1916, Geology of Ringgold County: Iowa Geological Survey Annual Report 1916, p. 33-68.
Bailey, R.G., Avers, P.E., King, T., and McNab, W.H., eds., 1994, Ecoregions and subregions of the United States with supplementary table of map unit descriptions: Washington, D.C., U.S. Department of Agriculture Forest Service, scale 1:7,500,000(also at URL http://www.fs.fed.us/land/ecosysmgmt/ecoreg1_home.html, accessed 1998).
Boeckman, L.E., 1992, Soil survey of Ringgold County, Iowa: U.S. Department of Agriculture Soil Conservation Service, 230 p., 80 folded plates.
Cagle, J.W., 1967, Availability of ground water in Decatur County, Iowa: Iowa Geological Survey Water Atlas 2, 28 p.
Cagle, J.W., 1973, Bedrock topography of south-central Iowa: U.S. Geological Survey Map I-763.
Cagle, J.W., and Heinitz, A.J., 1978, Water resources of south-central Iowa: Iowa Geological Survey Water Atlas 5, 97 p.
DeWitt, T.A., 1990, Soil survey of Decatur County, Iowa: U.S. Department of Agriculture Soil Conservation Service, 224 p., 35 folded plates.
Durum, W.H., 1978, Historical profile of quality of water laboratories and activities, 1879-1973: U.S. Geological Survey Open-File Report 78-432, 235 p.
Kross, B.C., 1990, The Iowa State-wide rural well-water survey, water-quality data-Initial analysis: Iowa Department of Natural Resources Technical Information Series 19, 142 p.
Lawrence, C.L., 1987, Streamflow characteristics at hydrologic benchmark stations: U.S. Geological Survey Circular 941, 123 p.
Simpkins, W.W., and Burkart, M.R., 1996, Hydrogeology and water quality of the Walnut Creek watershed: Iowa Geological Survey Bureau, Guidebook Series 20, p. 69-78.
Southard, R.E., Sneck-Fahrer, D., Anderson, C.J., Goodrich, R.D., and Gorman, J.G., 1994, Water resources data, Iowa, water year 1993: U.S. Geological Survey Water-Data Report IA-93-1, 388 p.
Appendix A. List of Map References
a. U.S. Geological Survey topographic maps:
- Ellston, Iowa (1:24,000), 1981
- Grand River, Iowa (1:24,000), 1981
- Kellerton, Iowa (1:24,000), 1981
- Lamoni North, Iowa (1:24,000), 1981, gaging station on this quadrangle
- Leon, Iowa-Missouri (1:100,000), 1981
- Mount Ayr, Iowa-Missouri (1:100,000), 1985
b. Geologic maps:
- Arey, M.F., 1920, Geology of Ringgold County: Iowa Geological Survey Report, v. 27, p. 33-64, scale 1:125,000.
- Bain, H.F., 1898, Geology of Decatur County: Iowa Geological Survey Report, v. 8, p. 255-314, scale 1:125,000.
- Cagle, J.W., 1975, Bedrock topography of south-central Iowa: U.S. Geological Survey Miscellaneous Geologic Investigations Map I-763, scale 1:250,000.
- Hansen, R.E., 1992, Bedrock topography of southwest Iowa: U.S. Geological Survey Miscellaneous Investigations Series I-2230, scale 1:250,000.
- Hershey, H.G., 1969, Geologic map of Iowa: Iowa Geological Survey, scale 1:500,000.
c. Soil surveys:
- Boeckman, L.E., 1992, Soil survey of Ringgold County, Iowa: U.S. Department of Agriculture Soil Conservation Service, 230 p.
- DeWitt, T.A., 1990, Soil survey of Decatur County, Iowa: U.S. Department of Agriculture Soil Conservation Service, 224 p.
d. Miscellaneous maps:
- Cagle, J.W, and Heinitz, A.J., 1978, Water resources of south-central Iowa: Iowa Geological Survey Water Atlas 5, 97 p.
- Cagle, J.W., and Steinhilber, W.L., 1967, Availability of ground water in Decatur County, Iowa: Iowa Geological Survey Water Atlas 2, 28 p.
Appendix B. NWIS Site-Identification Numbers
Table B-1. NWIS site-identification numbers and site names for water-quality sampling sites.
|
Site |
Identification Number |
Site Name |
|
1 |
06897950 |
ELK CR NR DECATUR CITY IOWA |
|
2 |
404337093580900 |
WEST ELK CR NR DECATUR CITY IOWA |
|
3 |
404501094002800 |
SOUTH FORK WEST ELK CR NR DECATUR CITY IOWA |
|
4 |
404504094002600 |
NORTH FORK WEST ELK CR NR DECATUR CITY IOWA |
|
5 |
404343093573900 |
LANDFILL CR NR DECATUR CITY IOWA |
|
6 |
404348093564000 |
ELK CR AT HWY 2 NR DECATUR CITY IOWA |
|
7 |
404611093590600 |
ELK CR IN SECT 17 NR DECATUR CITY IOWA |
|
8 |
404723093585800 |
ELK CR IN SECT 8 NR DECATUR CITY IOWA |
|
9 |
404932094005800 |
UPPER ELK CR NR DECATUR CITY IOWA |
| Back to 1173-B Contents |
This page maintained by Nichole Bisceglia.
Last updated July 17, 2000.