
Hydrologic Benchmark Network Stations in the Midwestern U.S. 1963-95 (USGS Circular 1173-B)
|
|
|
|
|
Upper Twin Creek at McGaw, Ohio (Station 03237280)
To download a printer friendly PDF version of this information click here.
This report details one of the approximately 50 stations in the Hydrologic Benchmark Network (HBN) described in the four-volume U.S. Geological Survey Circular 1173. The suggested citation for the information on this page is:
|
Mast, M.A., and Turk, J.T., 1999, Environmental characteristics and water quality of Hydrologic Benchmark Network stations in the Midwestern United States, 1963-95: U.S. Geological Survey Circular 1173-B, 130 p. |
All of the tables and figures are numbered as they appear in each circular. Use the navigation bar above to view the abstract, introduction and methods for the entire circular, as well as a map and list of all of the HBN sites. Use the table of contents below to view the information on this particular station.
|
Table of Contents |
| 1. Site Characteristics and Land Use |
| 2. Historical Water Quality Data and Time-Series Trends |
| 3. Synoptic Water Quality Data |
Site Characteristics and Land Use
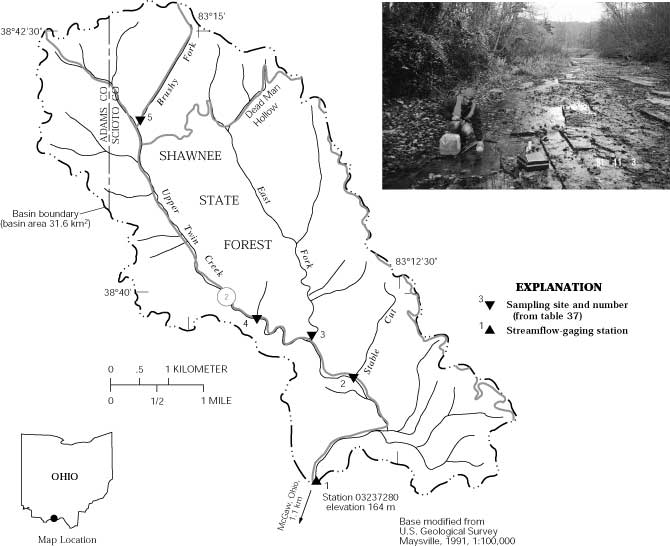
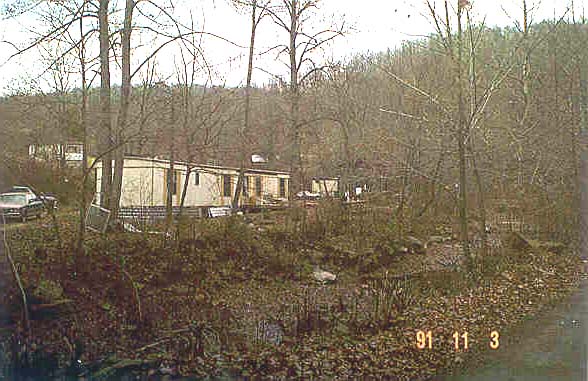
The Upper Twin Creek HBN Basin is in the Allegheny Mountain section of the Appalachian Plateaus physiographic province along the southern border of Ohio (Figure 18. Map showing study area in the Upper Twin Creek Basin and photograph of the main stream channel). The landscape is unglaciated and characterized by narrow ridgetops, steep hill-slopes, and narrow stream valleys. The basin drains 31.6 km² of strongly dissected terrain and ranges in elevation from 164 m at the gaging station to more than 395 m along the northern basin divide. The USGS gaging station is located 1.1 km upstream from McGaw, Ohio, at latitude 38×38'37'' and longitude 83×12'57''. Upper Twin Creek is a southeast-flowing tributary of the Ohio River and has a channel length of 11.1 km upstream from the gaging station and an average stream gradient of 12.7 m/km. Mean monthly discharge varies from 0.07 m³/s in October to 0.83 m³/s in March, and periods of no flow occur most years between October and December. Streamflow generally is highly variable in summer because of severe thundershowers. Average annual runoff from the basin was 38 cm from 1963 through 1995 (Shindel and others, 1996). The climate is characterized by fairly warm summers and cold, snowy winters. Average daily air temperatures range from 0.0×C in January to 24.4×C in July (McCleary and others, 1989). Precipitation averages 105 cm annually and is fairly evenly distributed during the year. Average annual snowfall is 45 cm, but mid-winter thaws preclude the accumulation of a seasonal snow cover.
 |
The basin is in the Eastern Broadleaf Forest (Oceanic) ecoregion, which is characterized by temperate deciduous forests that form a dense, continuous canopy (Bailey and others, 1994). Several species of oaks and hickories, as well as sassafras, pitch pine, and shortleaf pine, populate the drier ridges (Shawnee State Forest, written commun., 1997). Midslope areas are dominated by oaks and hickories, as well as maples, basswoods, yellow poplar, buckeyes, blackgum, white ash, red elm, northern hackberry, and quaking aspen. Sweetgum, American beech, black cherry, black walnut, eastern sycamore, river birch, and bitternut are common in moist areas in bottomlands and coves. Soils in the basin are classified as Ultisols (Hapludults) and mapped in the Shelocta and Brownsville soil associations (McCleary and others, 1989). These are deep, well-drained soils on side slopes and ridgetops that were formed in colluvium and residuum derived from siltstone, sandstone, and shale. A typical soil profile has a surface layer of pale brown silt loam that is about 15 cm thick overlying a subsoil of yellowish-brown silt loam that extends down to 130 cm. Below the subsoil is a 25- to 50-cm layer of yellowish-brown silt loam that contains as much as 15 percent of thin, flat rock fragments of sandstone and shale. Most soils are acidic (pH 3.6 to 5.5) and have an organic-matter content of less than 3 percent in the upper 20 cm (McCleary and others, 1989).
Bedrock in the basin consists of gently dipping marine sedimentary rocks of Lower Mississippian age, including the Berea Sandstone, the Sunbury Shale, and the Cuyahoga and Logan Formations (Hyde, 1953). The Berea Sandstone consists of 70 percent sandstone and 30 percent siltstone and shale and is locally calcareous. The Sunbury Shale is a pyritiferous dark-gray to black carbonaceous fissile shale that generally is less than 10 m thick. The Cuyahoga and Logan Formations crop out on the upper hillslopes and ridges. The Cuyahoga Formation consists of a gray shale interbedded with silty shale and siltstone, and the Logan Formation consists of light-gray siltstone with occasional beds of shale (Sheppard, 1964).
 |
The Upper Twin Creek Basin drains the southwestern corner of Scioto and Adams Counties in Ohio, and most land is in the Shawnee State Forest, which is administered by the Ohio Department of Natural Resources. Land on the west side of Upper Twin Creek, which accounts for about 23 percent of the basin, is designated as a State wilderness area. Privately owned parcels account for about 4 percent of the basin, and most parcels are located along the flood plain just upstream from the gaging station. State Forest Road 2 enters the basin at the gaging station and parallels the entire length of Upper Twin Creek. Forest roads also access Brushy Fork and Dead Man Hollow in the upper one-half of the basin. Roads are surfaced with limestone gravel, except a 2-km stretch of Forest Road 2, which is chipped and sealed upstream from the gaging station. Roads are occasionally plowed in winter but are not salted (Benjamin Hamilton, Shawnee State Forest, written commun., 1997). The wilderness area is accessible by hiking and equestrian trails.
Land cover in the basin is 98 percent forest, 1 percent open, and 1 percent agricultural (Benjamin Hamilton, Shawnee State Forest, written commun., 1997). The principal land-use activity on State-owned lands on the east side of the creek is timber harvesting. State-owned lands on the west side of the creek were designated as wilderness in 1972, and since then, timber harvesting and motorized vehicles have been prohibited. Timber harvesting on State lands is done to the highest standards to minimize the effects on surface water and to improve wildlife habitat (Benjamin Hamilton, written commun., 1997). Timber is harvested on a sustained-yield basis by selective harvesting and clearcutting. Since the 1950's, about 885 ha of timber in the basin have been selectively harvested and 75 ha have been clearcut (Benjamin Hamilton, written commun., 1997). Wildfires are common in the region, and the policy of the Shawnee State Forest is to suppress fires that occur on public and private lands in and surrounding the State forest. Land use on private land is primarily residential, but there is a small amount of agriculture, including corn, tobacco, and livestock. Two groups of trailer homes (five to six each) and accompanying onsite sewage disposal systems and domestic trash dumps are situated along the creek, one just upstream from the gaging station and the other in the headwaters. Very few changes in land use have occurred in the basin since the establishment of the HBN station, the most important change being the designation of the State wilderness area in 1972.
Historical Water-Quality Data and Time-Series Trends
The data set analyzed for the Upper Twin Creek HBN Station for this report includes 299 water-quality samples that were collected from August 1967 through September 1995. Except for a few years, samples were collected monthly during the entire period of record. Water-quality samples in the early part of the period of record were probably analyzed at a USGS laboratory in Columbus, Ohio, that operated until 1973 (Durum, 1978). After establishment of a central laboratory system, samples were analyzed at a laboratory in Atlanta, Ga., from 1973 through 1985 and at the NWQL in Arvada, Colo., from 1986 through 1995. Daily discharge records are available for Upper Twin Creek (station 03237280) beginning in June 1963. Daily records of pH and specific conductance at the gaging station are available from March 1985 through September 1995, and daily water temperature is available from 1963 through 1966, from 1967 through 1970, from 1972 through 1982, and from 1984 through 1995.
 |
Calculated ion balances for 299 samples with complete major-ion analyses are shown in Figures 19a and 19b. Temporal variation of discharge, field pH, major dissolved constituents, and ion balance at Upper Twin Creek, Ohio. Ion balances ranged from -16 to 14 percent, and more than 98 percent of samples had values in the ±10 percent range, indicating that the analytical measurements were of good quality. The average charge balance for all samples was -1.1 percent, indicating that unmeasured constituents, such as organic anions, did not contribute substantially to the ion balance of stream water at this site. Time-series plots of the major dissolved constituents were inspected for evidence of method-related effects (fig. 19). A few questionable patterns are evident in the Upper Twin Creek data, particularly for chloride and field pH. For example, chloride concentrations showed a noticeable decrease in scatter in the early 1970's. This pattern is coincident with a switch from the USGS laboratory in Columbus, Ohio, to the central laboratory in Atlanta, Ga., in 1973 and may reflect a difference in the precision of the chloride analyses reported by these two facilities. The temporal pattern in field pH showed a rather abrupt decrease in pH values in 1973, followed by a gradual increase between 1973 and 1992, and a decrease again around 1992. Although this pattern in pH may have been caused by environmental factors, a change in methods would be more likely to produce abrupt changes in the pH values (Schertz and others, 1994), such as those observed in 1973 and again in 1992.
Median concentrations and ranges of major constituents in stream water at the Upper Twin Creek Station and VWM concentrations in wet-only deposition measured at the Clark State Fish Hatchery NADP Station are listed in table 34. Precipitation chemistry at the NADP station, which is located about 65 km southwest of the HBN station, is dilute and acidic with a VWM pH of 4.4 for 13 years of record. The predominant cations were hydrogen and ammonium, which accounted for 62 and 19 percent of the total cation charge, respectively. The predominant anions were sulfate, which contributed 66 percent of the anion charge, and nitrate, which contributed 29 percent. The predominance of strong acid anions and the low pH indicates that precipitation at the NADP station probably is affected by anthropogenic emissions of sulfur and nitrogen compounds, which cause acid rain.
Table 34. Minimum, first quartile, median, third quartile, and maximum values of physical properties and major dissolved constituents measured in water-quality samples from Upper Twin Creek, Ohio, August 1967 through September 1995, and volume-weighted mean concentrations in wet precipitation collected at the Clark State Fish Hatchery Station
[Concentrations in units of microequivalents per liter, discharge in cubic meters per second, specific conductance in microsiemens per centimeter at 25 degrees Celsius, pH in standard units, and silica in micromoles per liter; n, number of stream samples; VWM, volume-weighted mean; inst., instantaneous; spec. cond., specific conductance; <, less than; --, not reported]
|
Parameter |
Stream Water |
Precipitation VWMa |
|||||
|
Minimum |
First quartile |
Median |
Third quartile |
Maximum |
n |
||
| Discharge, inst. |
0.0003 |
0.017 |
0.12 |
0.34 |
16 |
302 |
-- |
| Spec. cond., field |
60 |
70 |
100 |
120 |
220 |
306 |
20 |
| pH, field |
5.7 |
6.7 |
6.9 |
7.2 |
8.2 |
306 |
4.4b |
| Calcium |
110 |
250 |
300 |
390 |
750 |
306 |
7.0 |
| Magnesium |
200 |
350 |
400 |
490 |
800 |
305 |
1.8 |
| Sodium |
57 |
110 |
140 |
170 |
270 |
306 |
2.7 |
| Potassium |
20 |
41 |
49 |
59 |
90 |
305 |
.8 |
| Ammonium |
<.7 |
<.7 |
<.7 |
1.4 |
10 |
148 |
12 |
| Alkalinity, laboratory |
100 |
190 |
260 |
340 |
600 |
302 |
-- |
| Sulfate |
310 |
480 |
560 |
640 |
1,140 |
306 |
45 |
| Chloride |
8.5 |
45 |
56 |
85 |
280 |
306 |
3.5 |
| Nitrite plus nitrate |
<3.6 |
14 |
14 |
21 |
86 |
231 |
20c |
| Silica |
100 |
150 |
160 |
180 |
230 |
306 |
-- |
a Data are volume-weighted mean concentrations for 1983-95.
b Laboratory pH.
c Nitrate only.
Stream water in Upper Twin Creek is fairly concentrated but only moderately buffered; specific conductance ranged from 60 to 220 mS/cm, and alkalinity was between 100 and 600 meq/L (table 34). The major cations in stream water were magnesium and calcium, and the predominant anion was sulfate. Although the Ohio Valley has some of the highest rates of sulfate deposition in the United States, the high stream-water sulfate concentrations probably are derived primarily from weathering of the sedimentary rocks rather than atmospheric deposition. The two most likely sources of sulfate are oxidation of disseminated pyrite in the Sunbury Shale and Berea Sandstone and dissolution of minor gypsum beds in the marine shales. High
 |
The solute composition of stream water was further evaluated by analyzing correlations between solutes and stream discharge (table 35). All solutes showed strong inverse correlations with discharge (-0.652 > rho > -0.854), with the exception of silica (rho = -0.121). Inverse correlations between solutes and discharge are consistent with a hydrologic system where weathering-enriched base flow is diluted by water from shallow sources during periods of increased discharge. Strong positive correlations were observed among all the weathering-derived constituents, except for silica. The strong correlations between chloride and the weathering solutes provide additional evidence that most stream-water chloride is derived from the dissolution of salts in the sedimentary bedrock. The processes that control silica concentrations in stream water are not clear, particularly because the concentrations varied little for a wide range of streamflows. Weathering of quartz and clay minerals in the sandstones and shales is the most likely source of silica to the stream during low-flow conditions. During high-flow conditions, however, dissolution of amorphous silica phases, biological activity, and sorption reactions in shallow ground-water or soil environments may be the predominant processes that control silica concentrations in the stream (Stoddard and Murdoch, 1991).
Table 35. Spearman rank correlation coefficients (rho values) showing the relation among discharge, pH, and major dissolved constituents, Upper Twin Creek, Ohio, 1967-95
[Q, discharge; Ca, calcium; Mg, magnesium; Na, sodium; K, potassium; Alk, alkalinity; SO4, sulfate; Cl, chloride; Si, silica]
|
|
Q |
pH |
Ca |
Mg |
Na |
K |
Alk |
SO4 |
Cl |
| pH |
0.011 |
|
|
|
|
|
|
|
|
| Ca |
-.864 |
0.113 |
|
|
|
|
|
|
|
| Mg |
-.864 |
.086 |
0.968 |
|
|
|
|
|
|
| Na |
-.785 |
.038 |
.848 |
0.900 |
|
|
|
|
|
| K |
-.653 |
.008 |
.752 |
.715 |
0.632 |
|
|
|
|
| Alk |
-.670 |
.152 |
.821 |
.781 |
.661 |
0.695 |
|
|
|
| SO4 |
-.748 |
.080 |
.777 |
.830 |
.851 |
.536 |
0.570 |
|
|
| Cl |
-.764 |
.011 |
.805 |
.776 |
.632 |
.541 |
.617 |
0.592 |
|
| Si |
-.121 |
-.082 |
.161 |
.178 |
.251 |
.471 |
.236 |
.155 |
-0.099 |
Results of the seasonal Kendall test for trends in discharge and major dissolved constituents are listed in table 36. Statistically significant upward trends were observed for pH, calcium, magnesium, alkalinity, and sulfate at the 0.01 probability level. The results were similar for unadjusted and flow-adjusted concentrations, indicating that the trends were not caused by variations in stream discharge. The LOWESS curves in figure 19 indicate slightly different trend patterns for these five constituents. For example, field pH declined in the early part of the period of record and then increased steadily between 1973 and 1993. The greatest change in calcium and alkalinity concentrations occurred in the later one-half of the period of record. Most of the increase in alkalinity occurred during a short period in the early 1990's, whereas the increase in calcium was more gradual. By contrast, most of the increase in magnesium and sulfate concentrations occurred in the first one-half of the period of record.
Table 36. Results of the seasonal Kendall test for trends in discharge and unadjusted and flow-adjusted pH and major dissolved constituents, Upper Twin Creek, August 1967 through September 1995
[Trends in units of microequivalents per liter per year, except discharge in cubic meters per second per year, pH in standard units per year, and silica in micromoles per liter per year; <, less than; --, not calculated]
|
Parameter |
Unadjusted |
Flow adjusted |
||
|
Trend |
p-value |
Trend |
p-value |
|
| Discharge, inst. |
<-0.01 |
0.206 |
-- |
-- |
| pH, field |
.01 |
.007 |
(a) |
-- |
| Calcium |
1.7 |
.003 |
1.1 |
0.007 |
| Magnesium |
4.1 |
.000 |
3.5 |
.000 |
| Sodium |
<.1 |
.862 |
-.3 |
.134 |
| Potassium |
-.1 |
.302 |
-.3 |
.083 |
| Alkalinity, laboratory |
2.9 |
.000 |
2.4 |
.000 |
| Sulfate |
3.3 |
.000 |
2.9 |
.000 |
| Chloride |
-.5 |
.534 |
-.3 |
.204 |
| Nitrite plus nitrate |
.3b |
.149 |
.3b |
.130 |
| Silica |
<.1 |
.232 |
<.1 |
.506 |
a Flow model not significant at a = 0.10.
b Trend calculated for 1974-95.
Trends in stream chemistry at Upper Twin Creek Station may reflect changes in environmental factors such as precipitation chemistry or land-use activities. Estimates of sulfur emissions indicate that atmospheric sulfate deposition has decreased substantially in the industrialized Midwest since the 1970's (Husar and others, 1991). Lynch and others (1995) reported declines in calcium, magnesium, and sulfate concentrations at NADP stations in the Midwestern United States from 1982 through 1990. The upward trends in stream-water calcium, magnesium, and sulfate at the HBN station are inconsistent with the trends in precipitation chemistry reported by Lynch and others (1995), indicating that the stream-water trends probably were not caused by changes in atmospheric deposition. Trends in stream chemistry at this station may more likely reflect human activities in the basin. Although most of the State-owned land is fairly undisturbed, there are several rural residential areas and small farms along Upper Twin Creek, as well as a network of gravel roads. Landscape disturbance associated with the residential areas and farms has the potential to increase rates of base cation leaching and may result in higher stream-water alkalinity and pH (Stoddard and Murdoch, 1991). Because sulfate also is derived from geologic sources, landscape disturbance may impact stream-water sulfate concentrations as well. Changes in stream-water chemistry also may be related to the network of roads. Most roads in the basin are covered with limestone gravel and should provide a readily soluble source of calcium, magnesium, and alkalinity to the stream, particularly during storms and snowmelt when direct runoff from the roads to the stream channel is more likely.
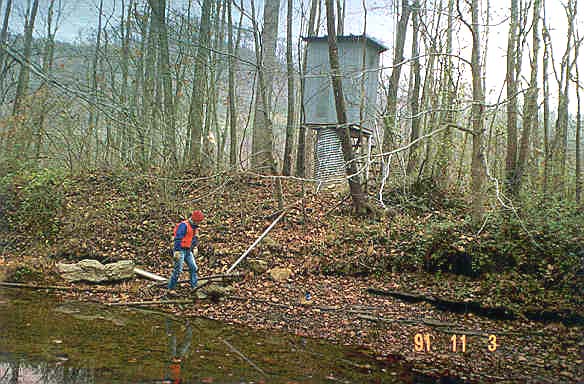
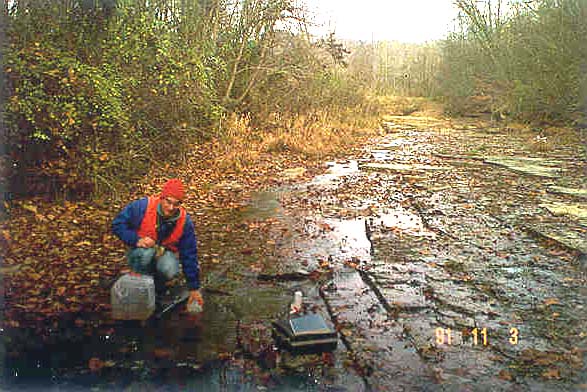
Synoptic Water-Quality Data
Results of the surface-water synoptic sampling in the Upper Twin Creek Basin on November 3, 1991, are listed in table 37, and the locations of the sampling sites are shown in figure 18. During the sampling period, discharge at the gaging station was 0.003 m³/s compared to the median discharge of 0.02 m³/s for October and 0.06 m³/s for November (Lawrence, 1987), indicating that the basin was sampled during low-flow conditions for that time of year. Because of the low-flow conditions, solute concentrations measured at site 1 were greater than the third-quartile concentrations reported for the HBN station during the entire period of record (table 34). The tributary streams were similar in composition to stream water collected at the gaging station (site 1); magnesium and calcium were the predominant cations, and sulfate and bicarbonate were the predominant anions. Ion balances were negative for all samples and ranged from -3.1 to -5.8 percent. This result was somewhat unexpected because of the high solute concentrations at this station and may indicate a bias in one of the analytical measurements.
Table 37. Physical properties and major dissolved constituents from surface-water sampling sites in the Upper Twin Creek Basin, Ohio, collected November 3, 1991
[Site locations shown in fig. 18; Q, discharge in cubic meters per second; SC, specific conductance in microsiemens per centimeters at 25 degrees Celsius; pH in standard units; Ca, calcium; Mg, magnesium; Na, sodium; K, potassium; Alk, alkalinity; SO4, sulfate; Cl, chloride; NO3, nitrate; Si, silica; concentrations in microequivalents per liter, except silica in micromoles per liter; <, less than; --, not reported; criteria used in selection of sampling sites: MT = major tributary, LU = land use]
|
Site |
Station number |
Q |
SC |
pH |
Ca |
Mg |
Na |
K |
Alk |
SO4 |
Cl |
NO3 |
Si |
Criteria |
Remarks |
|
1 |
3237280 |
0.0034 |
160 |
7.3 |
430 |
640 |
200 |
54 |
520 |
790 |
150 |
7.9 |
150 |
-- |
Gaging station |
|
2 |
383911083130000 |
-- |
140 |
7.1 |
420 |
580 |
160 |
54 |
660 |
560 |
110 |
<3.6 |
180 |
MT |
|
|
3 |
383935083133200 |
-- |
100 |
6.4 |
250 |
420 |
150 |
56 |
320 |
540 |
85 |
<3.6 |
170 |
MT, LU | Undeveloped |
|
4 |
383941083135600 |
-- |
250 |
7.8 |
900 |
1,040 |
210 |
54 |
1,660 |
650 |
160 |
5.0 |
130 |
MT, LU | Residential development |
|
5 |
384137083154100 |
-- |
280 |
7.1 |
1,200 |
1,280 |
170 |
82 |
2,280 |
540 |
79 |
<3.6 |
180 |
LU | Undeveloped, headwaters |
Most of the spatial variability in stream chemistry in the Upper Twin Creek Basin was measured in the weathering-derived constituents. For example, alkalinity ranged from 320 meq/L in the East Fork (site 3) to 2,280 meq/L in Brushy Fork (site 5) (table 37). Similar spatial patterns were measured in the magnesium and calcium concentrations. Magnesium ranged from 420 to 1,280 meq/L and calcium ranged from 250 to 1,200 meq/L. These differences in stream chemistry may reflect differences in the mineralogy of the underlying sedimentary rocks. For example, the shales and siltstones, which are more common in the upper part of the basin, contain a greater percentage of carbonate minerals and marine clays than the sandstones that underlie the lower one-half of the basin. The concentrations of the remaining solutes did not vary markedly among the sampling sites. For example, sulfate concentrations ranged 540 to 790 meq/L, and silica ranged from 130 to 180 mmol/L. Because both of these solutes also are derived from weathering, these results may reflect uniformity in the mineralogic sources for these solutes. Chloride concentrations also varied over a narrow range but seemed to be elevated in streams draining residential or agricultural development (sites 1, 2, and 4) compared to streams where there was little or no development (sites 3 and 5). Nitrate concentrations were low at all the sampling sites (range <3.6 to 7.9 meq/L), indicating that human activities had a minor effect on the nutrient concentrations of surface water during the sampling period.
References Cited
Bailey, R.G., Avers, P.E., King, T., and McNab, W.H., eds., 1994, Ecoregions and subregions of the United States with supplementary table of map unit descriptions: Washington, D.C., U.S. Department of Agriculture Forest Service, scale 1:7,500,000(also at URL http://www.fs.fed.us/land/ecosysmgmt/ecoreg1_home.html, accessed 1998).
Durum, W.H., 1978, Historical profile of quality of water laboratories and activities, 1879-1973: U.S. Geological Survey Open-File Report 78-432, 235 p.
Husar, R.B., Sullivan, T.J., and Charles, D.F., 1991, Historical trends in atmospheric sulfur deposition and methods for assessing long-term trends in surface water chemistry, in Charles, D.F., ed., Acidic deposition and aquatic ecosystems-Regional case studies: New York, Springer-Verlag, p. 48-92.
Hyde, J.E., 1953, Mississippian formations of central and southern Ohio: Ohio Division of Geological Survey Bulletin 51, 355 p.
Lawrence, C.L., 1987, Streamflow characteristics at hydrologic benchmark stations: U.S. Geological Survey Circular 941, 123 p.
Lynch, J.A., Grimm, J.W., and Bowersox, V.C., 1995, Trends in precipitation chemistry in the United States-A national perspective, 1980-1992:Atmospheric Environment, v. 29, no. 11, p. 1231-1246.
McCleary, F.E., Feusner, M.M., and Hamilton, S.J., 1989, Soil survey of Scioto County, Ohio: U.S. Department of Agriculture Soil Conservation Service, 207 p., 78 folded plates.
Schertz, T.L., Wells, F.C., and Ohe, D.J., 1994, Sources of trends in water-quality data for selected streams in Texas, 1975-89 water years: U.S. Geological Survey Water-Resources Investigations Report 94-4213, 49 p.
Sheppard, R.A., 1964, Geology of the Portsmouth quadrangle, Kentucky-Ohio and parts of the Wheelsburg and New Boston quadrangles: U.S. Geological Survey Geologic Quadrangle Maps of the United States Map GQ-213, scale 1:24,000.
Shindel, H.L., Mangus, J.P., and Trimble, L.E., 1996, Water resources data, Ohio, water year 1995-v. 1, Ohio River Basin excluding project data: U.S. Geological Survey Water-Data Report OH-95-1, 285 p.
Stoddard, J.L., and Murdoch, P.A., 1991, Catskill Mountains, in Charles, D.F., Acidic deposition and aquatic ecosystems-Regional case studies: New York, Springer-Verlag, p. 237-272.
Appendix A. List of Map References
- Buena Vista, Ohio-Kentucky (1:24,000), 1967
- Pond Run, Ohio-Kentucky (1:24,000), 1967, gaging station on this quadrangle
b. Geologic maps:
- Sheppard, R.A., 1964, Geology of the Portsmouth quadrangle, Kentucky-Ohio and parts of the Wheelersburg and New Boston quadrangles: U.S. Geological Survey Geologic Quadrangle Map GQ-312, scale 1:24,000.
c. Soil surveys:
- McCleary, F.E., Feusner, M.M., and Hamilton, S.J., 1989, Soil survey of Scioto County, Ohio: U.S. Department of Agriculture Soil Conservation Service, 207 p.
d. Miscellaneous maps:
- Ohio Department of Natural Resources, 1995, Map of Shawnee State Forest and Backpack Trail: Columbus, Ohio, Department of Natural Resources Division of Forestry, scale 1.5 inches = 2 miles.
Appendix B. NWIS Site-Identification Numbers
Table B-1. NWIS site-identification numbers and site names for water-quality sampling sites.
|
Site |
Identification Number |
Site Name |
|
1 |
03237280 |
UPPER TWIN CR AT MCGAW OHIO |
|
2 |
383911083130000 |
UPPER TWIN CR BLW STABLE CUT NR MCGAW OHIO |
|
3 |
383935083133200 |
EAST FORK NR MCGAW OHIO |
|
4 |
383941083135600 |
UPPER TWIN CR AB EAST FORK NR MCGAW OHIO |
|
5 |
384137083154100 |
BRUSHY FORK NR MCGAW OHIO |