
Hydrologic Benchmark Network Stations in the Midwestern U.S. 1963-95 (USGS Circular 1173-B)
|
|
|
|
|
Blue Beaver Creek near Cache, Oklahoma (Station 07311200)
To download a printer friendly PDF version of this information click here.
This report details one of the approximately 50 stations in the Hydrologic Benchmark Network (HBN) described in the four-volume U.S. Geological Survey Circular 1173. The suggested citation for the information on this page is:
|
Mast, M.A., and Turk, J.T., 1999, Environmental characteristics and water quality of Hydrologic Benchmark Network stations in the Midwestern United States, 1963-95: U.S. Geological Survey Circular 1173-B, 130 p. |
All of the tables and figures are numbered as they appear in each circular. Use the navigation bar above to view the abstract, introduction and methods for the entire circular, as well as a map and list of all of the HBN sites. Use the table of contents below to view the information on this particular station.
|
Table of Contents |
| 1. Site Characteristics and Land Use |
| 2. Historical Water Quality Data and Time-Series Trends |
| 3. Synoptic Water Quality Data |
Site Characteristics and Land Use
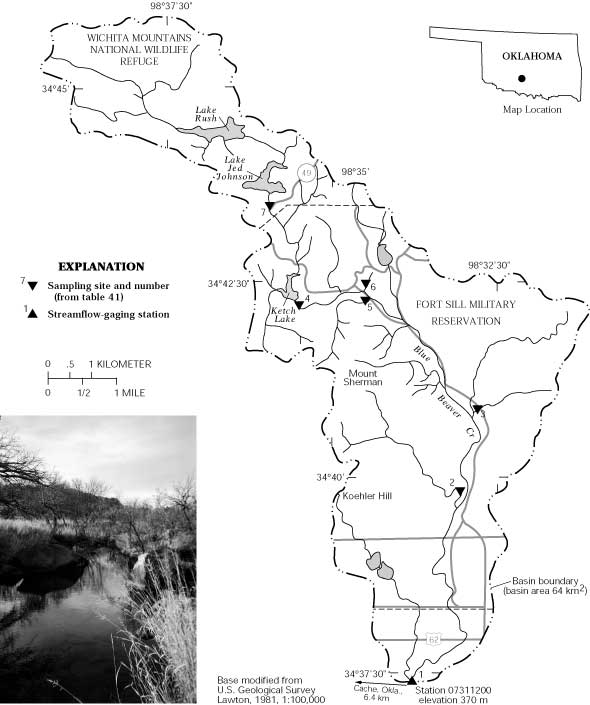
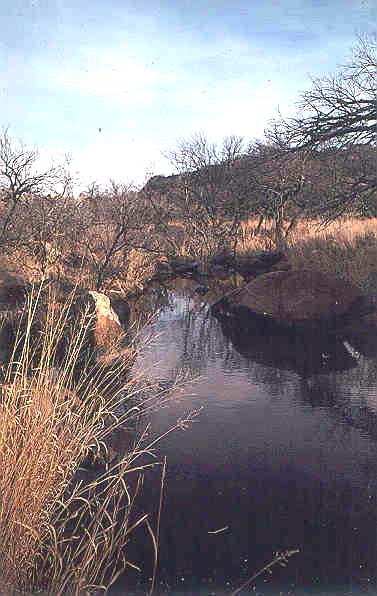
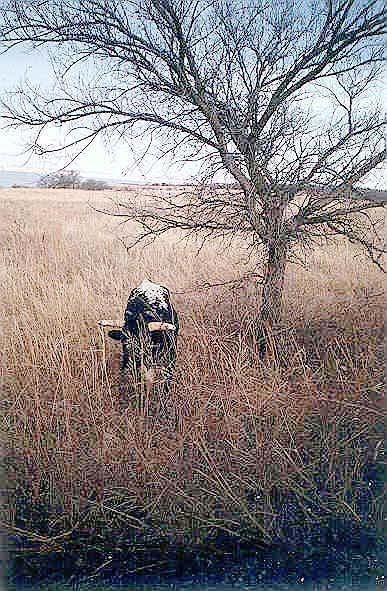
The Blue Beaver Creek HBN Basin is in the Wichita Mountains section of the Central Lowland physiographic province in southwestern Oklahoma (Figure 20. Map showing study area in the Blue Beaver Creek Basin and photograph of the main stream channel below Lake Jed Johnson). The 64-km² basin ranges in elevation from 370 to 732 m and drains a landscape of smooth rounded hills flanked by a broad, gently rolling plain. The USGS gaging station is located 6.4 km east of the town of Cache, Okla., at latitude 34×37'24'' and longitude 98×33'48''. Blue Beaver Creek flows south into Cache Creek, a tributary of the Red River, and has a channel length of about 26 km upstream from the gaging station and an average stream gradient of 6.9 m/km. Mean monthly discharge varied from 0.04m³/s in July to 1.1 m³/s in May, and annual runoff from the basin was 19 cm from 1964 through 1995 (Blazs and others, 1996). In most years, there are periods of no flow at the gaging station, particularly during July through October. The climate is temperate continental with long, hot summers and short, mild winters. Average monthly air temperatures range from 3.0×C in January to 27.8×C in July (National Climatic Data Center, 1997). Precipitation averages 77 cm annually and is greatest in May (13.1 cm) and least in January (2.9 cm). Snowfall averages 12 cm annually and normally melts within a few days of falling.
 |
The Blue Beaver Creek Basin is in the Great Plains Steppe and Shrub ecoregion (Bailey and others, 1994) and is covered by short- and mixed-grass prairies with oak savanna communities usually along the drainages. Common grass species include bluestem, indian grass, switchgrass, blue grama, and side-oats grama, and the predominant woody species are live oak, post oak, blackjack oak, and bigtooth maple. Most soils in the basin are classified as Mollisols and are mapped in the Lawton soil series (Mobley, 1967). The Lawton series consists of deep, loamy soils that formed in old alluvium of mixed rock type derived from the Wichita Mountains. A typical profile has a surface layer of brown loam to a depth of 35 cm overlying a subsoil of reddish-brown clay loam and yellowish-red sandy clay loam that extends to a depth of 150 cm. In most places, the soils have granitic sand and pebbles throughout the profile. The Stony Rock Land-Cobble Rock Land association is mapped on the slopes of the Wichita Mountains and includes a combination of exposed bedrock, shallow soils over bedrock, and cobble land, which consists of deep reddish-brown loams with between 25 and 70 percent cobblestones (Mobley, 1967).
The headwaters of Blue Beaver Creek originate in the Wichita Mountains, which are a series of igneous knobs of Cambrian age that protrude through sedimentary rocks of Permian age (Gilbert, 1982). The Cambrian rocks in the basin belong to the Carlton Rhyolite Group, which includes highly silicified rhyolitic lavas, consisting of phenocrysts of perthite and quartz in a groundmass of quartz and orthoclase. The main channel of Blue Beaver Creek cuts across the Post Oak Conglomerate and Garber Sandstone of Permian age, which were derived from sediment and debris eroded from the core of the Wichita Mountains (Havens, 1983). The Post Oak Conglomerate contains rounded boulders and cobbles of igneous rock types and fragments of limestone, dolomite, and shale eroded from older sedimentary rocks. Farther from the mountain flanks, the Post Oak Conglomerate becomes increasingly finer and eventually grades into red-brown, fine-grained sandstones and mudstones typical of the Garber Sandstone (Havens, 1983). Recent alluvium consisting of unconsolidated sand, silt, and clay was deposited along the flood plain. This alluvium ranges from 1 to 15 m in thickness and is the main source of water for domestic wells and stock supplies in the Wichita Mountains (Havens, 1983).
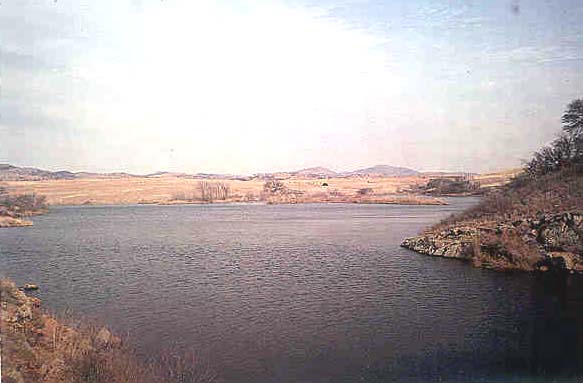
The Blue Beaver Creek Basin drains the western part of Comanche County in Oklahoma, and all land in the basin is publicly owned. The lower 75 percent of the basin is in the Fort Sill Military Reservation and the upper 25 percent is in the Wichita Mountains Wildlife Refuge. Land in the refuge in managed by the U.S. Fish and Wildlife Service to provide prairie grassland habitat for herds of buffalo, longhorn cattle, elk, and deer. The part of the wildlife refuge north of Lake Rush is set aside for wildlife use and is closed to the general public. Visitor use is concentrated near Lake Rush and Lake Jed Johnson where fishing and small motorized boats are permitted. These two small reservoirs and Ketch Lake to the south have a combined surface area of 53 ha. Land in the military reservation is used by the U.S. Army for tactical maneuvers (moving heavy equipment across the landscape) and foot patrols. Fort Sill uses standard erosion control and revegetation techniques to minimize the effects of intensive military training on the environment (Toni Hodgkins, U.S. Department of the Army, written commun., 1996). Since 1990, several roads in the basin have been improved, and more than 15 stream crossings have been constructed using limestone riprap to reduce erosion (Toni Hodgkins, written commun., 1996).
Historical Water-Quality Data and Time-Series Trends
The data set for the Blue Beaver Creek HBN Station analyzed for this report includes 138 water- quality samples that were collected from April 1967 through July 1995. Samples were collected monthly from 1968 through 1973 and quarterly from 1971 through 1995. Samples in the early part of the period of record were probably analyzed at a USGS laboratory in Oklahoma City, Okla., that operated until 1973 (Durum, 1978). After establishment of the central laboratory system, samples were analyzed at a laboratory in Salt Lake City, Utah, from 1973 through 1975 and at the NWQL in Arvada, Colo., from 1976 through 1995. Daily discharge records for Blue Beaver Creek (station 07311200) are available beginning in July 1964.
 |
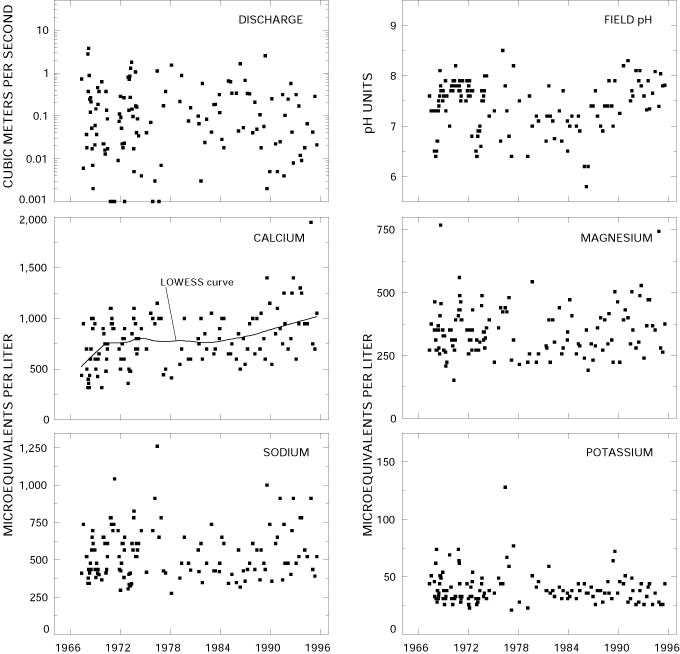
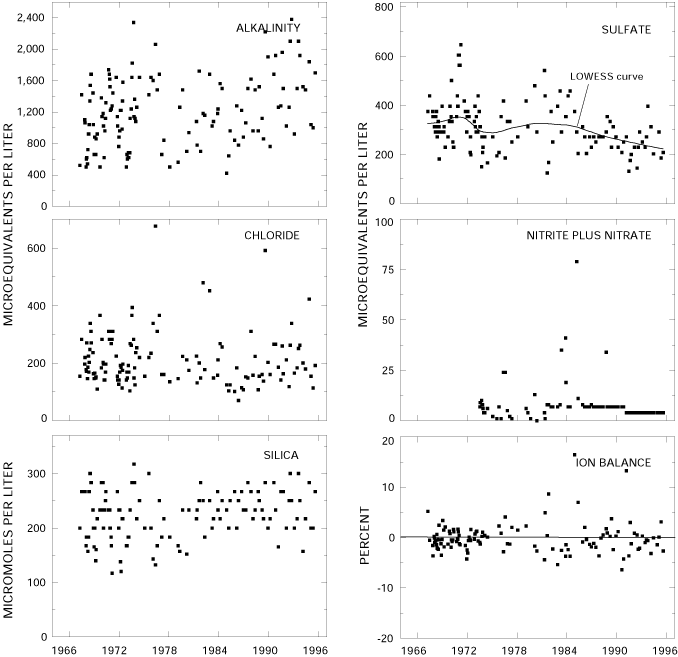
Calculated ion balances for 120 samples with complete major-ion analyses are shown in Figures 21a and 21b. Temporal variation of discharge, field pH, major dissolved constituents, and ion balance at Blue Beaver Creek, Oklahoma. Ion balances ranged from -6.4 to 16 percent, and 95 percent of samples had values within the ±5 percent range, indicating that the analytical results are of high quality. The average ion balance was -0.1 percent, indicating that unmeasured constituents, such as organic anions, do not seem to contribute substantially to the ion balance of stream water at this site. Time-series plots of the major dissolved constituents were inspected for evidence of method-related effects (fig. 21). The only notable pattern was the presence of several elevated potassium concentrations in the mid-1970's. Although there are no documented changes in field or laboratory methods during this period, the possibility of a method-related bias cannot be completely ruled out.
Median concentrations and ranges of major constituents in stream water at the Blue Beaver Creek Station and VWM concentrations in wet-only deposition measured at the Great Plains Apiaries NADP Station are listed in table 38. Precipitation chemistry at the NADP station, which is about 100 km northeast of the HBN station, is dilute and slightly acidic with a VWM pH of 5.0 for 13 years of record. The predominant cations were calcium and ammonium, which accounted for 31 and 29 percent of the total cation charge, respectively. Sulfate and nitrate were the predominant anions, contributing 53 and 35 percent of the total anion charge, respectively. The predominance of strong acid anions indicates that precipitation at the NADP station may be affected by anthropogenic emissions of sulfur and nitrogen compounds, which cause acid rain.
Table 38. Minimum, first quartile, median, third quartile, and maximum values of physical properties and major dissolved constituents measured in water-quality samples from Blue Beaver Creek, Oklahoma, April 1967 through July 1995, and volume-weighted mean concentrations in wet precipitation collected at the Great Plains Apiaries Station, Oklahoma
[Concentrations in units of microequivalents per liter, discharge in cubic meters per second, specific conductance in microsiemens per centimeter at 25 degrees Celsius, and silica in micromoles per liter; n, number of stream samples; VWM, volume-weighted mean; inst., instantaneous; spec. cond., specific conductance; <, less than, --, not reported]
|
Parameter |
Stream Water |
Precipitation VWMa |
|||||
|
Minimum |
First quartile |
Median |
Third quartile |
Maximum |
n |
||
| Discharge, inst. |
0.0006 |
0.018 |
0.075 |
0.28 |
3.8 |
136 |
-- |
| Spec. cond., field |
89 |
130 |
160 |
220 |
400 |
135 |
10 |
| pH, field |
5.8 |
7.0 |
7.5 |
7.8 |
8.6 |
135 |
5.0b |
| Calcium |
320 |
600 |
750 |
950 |
1,950 |
131 |
15 |
| Magnesium |
150 |
270 |
340 |
400 |
770 |
131 |
2.8 |
| Sodium |
270 |
420 |
520 |
650 |
1,260 |
134 |
5.0 |
| Potassium |
20 |
31 |
37 |
44 |
130 |
127 |
1.5 |
| Ammonium |
<.7 |
<1.1 |
2.1 |
4.3 |
15 |
53 |
14 |
| Alkalinity, laboratory |
420 |
880 |
1,170 |
1,510 |
2,380 |
137 |
-- |
| Sulfate |
130 |
250 |
290 |
350 |
650 |
135 |
23 |
| Chloride |
70 |
150 |
190 |
260 |
680 |
136 |
5.3 |
| Nitrite plus nitrate |
<.7 |
3.6 |
7.1 |
7.3 |
78 |
75 |
15c |
| Silica |
120 |
200 |
230 |
270 |
320 |
128 |
-- |
a Data are volume-weighted mean concentrations for 1983-95.
b Laboratory pH.
c Nitrate only.
Stream water in Blue Beaver Creek is moderately concentrated and well buffered; specific conductance ranged from 89 to 400 mS/cm,
 |
The solute composition of stream water was further evaluated by analyzing correlations between solutes and stream discharge (table 39). The weathering-derived constituents had strong inverse correlations with discharge, except for silica (rho = -0.180). These results are consistent with a hydrologic system where weathering-enriched base flow is diluted by water from shallow or surficial sources during periods of increased discharge. Strong positive correlations were found among calcium, magnesium, and alkalinity (0.911 < rho < 0.946), which is consistent with weathering of carbonate minerals in the Permian conglomerates. The strong positive correlation between sodium and chloride (rho = 0.847) may indicate that the primary source of chloride is weathering of halite in the sedimentary bedrock. Sulfate and silica were not correlated with discharge or other dissolved constituents, despite the fact that both solutes are presumably derived from weathering.
Table 39. Spearman rank correlation coefficients (rho values) showing the relation among discharge, pH, and major dissolved constituents, Blue Beaver Creek, Oklahoma, October 1967-95
[Q, discharge; Ca, calcium; Mg, magnesium; Na, sodium; K, potassium; Alk, alkalinity; SO4, sulfate; Cl, chloride; N, nitrite plus nitrate; Si, silica]
|
|
Q |
pH |
Ca |
Mg |
Na |
K |
Alk |
SO4 |
Cl |
| pH |
-0.347 |
|
|
|
|
|
|
|
|
| Ca |
-.827 |
0.397 |
|
|
|
|
|
|
|
| Mg |
-.837 |
.353 |
0.962 |
|
|
|
|
|
|
| Na |
-.825 |
.339 |
.854 |
0.868 |
|
|
|
|
|
| K |
-.204 |
-.051 |
.211 |
.212 |
0.250 |
|
|
|
|
| Alk |
-.783 |
.469 |
.945 |
.912 |
.843 |
0.229 |
|
|
|
| SO4 |
-.176 |
-.386 |
.052 |
.077 |
.205 |
.004 |
-0.086 |
|
|
| Cl |
-.715 |
.124 |
.666 |
.682 |
.847 |
.204 |
.671 |
0.322 |
|
| Si |
-.180 |
.130 |
.397 |
.379 |
.103 |
.386 |
.386 |
-.174 |
0.097 |
Results of the seasonal Kendall test for trends in discharge and major dissolved constituents are listed in table 40. Statistically significant trends were detected in the unadjusted calcium and sulfate concentrations at the 0.01 probability level. Results were similar for the flow-adjusted concentrations, indicating that trends in calcium and sulfate were not driven by variations in stream discharge. After flow adjustment, a statistically significant upward trend also was detected in stream-water alkalinity. The LOWESS curves in figure 21 show that the downward trend in sulfate and the upward trend in calcium are primarily due to changes in concentrations since the mid-1980's. Although not shown in figure 21, the pattern in flow-adjusted alkalinity was similar to the pattern for unadjusted calcium concentrations. Trends in stream chemistry at the Blue Beaver Creek Station may reflect changes in environmental factors, such as precipitation chemistry or land-use activities. Lynch and others (1995) reported a decline in the sulfate concentration of precipitation at a nearby NADP station in Arkansas from 1982 through 1990. Although the direction of the trend in sulfate deposition is consistent with the stream-water trend, the precipitation trend [-0.3 (meq/L)/yr] is an order of magnitude smaller than the stream-water trend [-3.2 (meq/L)/yr], indicating that atmospheric deposition alone cannot account for the trend in stream-water sulfate. The large increases in stream-water calcium [9.5 (meq/L)/yr] and alkalinity [14.1 (meq/L)/yr] also cannot be accounted for by trends in atmospheric deposition and may be linked to land-use activities in the basin. Military training exercises, particularly those involving the movement of heavy vehicles, have caused serious land damage and have caused increased sedimentation to some streams on the military reservation (Toni Hodgkins, U.S. Department of the Army, written commun., 1996). Since 1990, however, Fort Sill has implemented techniques to control erosion, such as revegetation, road improvements, and construction of hardened stream crossings. Although most of these measures might be expected to decrease land-use effects on streams, the hardened crossings are constructed of limestone riprap, which could provide a readily soluble source of dissolved calcium and alkalinity to the stream.
Table 40. Results of the seasonal Kendall test for trends in discharge and unadjusted and flow-adjusted pH and major dissolved constituents, Blue Beaver Creek, Oklahoma, April 1967 through July 1995
[Trends in units of microequivalents per liter per year, except discharge in cubic meters per second per year, pH in standard units per year, and silica in micromoles per liter per year; inst., instantaneous --, not calculated]
|
Parameter |
Unadjusted |
Flow adjusted |
||
|
Trend |
p-value |
Trend |
p-value |
|
| Discharge, inst. |
<0.01 |
0.634 |
-- |
-- |
| pH, field |
.01 |
.230 |
0.01 |
0.066 |
| Calcium |
7.1 |
.009 |
9.5 |
.000 |
| Magnesium |
<.1 |
.957 |
1.1 |
.175 |
| Sodium |
<.1 |
.706 |
1.1 |
.325 |
| Potassium |
-.2 |
.037 |
-.2 |
.247 |
| Alkalinity, laboratory |
7.2 |
.088 |
14.1 |
.000 |
| Sulfate |
-3.5 |
.002 |
-3.2 |
.004 |
| Chloride |
-1.5 |
.097 |
-.7 |
.365 |
| Nitrite plus nitrate |
<.1a |
.759 |
-- |
-- |
| Silica |
<.1 |
.880 |
<.1 |
.999 |
a Trend calculated for 1973—95 using a trend test for censored data.
Synoptic Water-Quality Data
 |
Results of the surface-water synoptic sampling in the Blue Beaver Creek Basin on February 2 and 3, 1991, are listed in table 41, and the locations of the sampling sites are shown in figure 20. During the sampling period, discharge at the gaging station was about 0.07 m³/s compared to the median daily discharge of about 0.06 m³/s for February (Lawrence, 1987), indicating that the basin was sampled during normal flow conditions for that time of year. The concentrations of most solutes measured at site 1 during the synoptic sampling were similar to the first-quartile concentrations reported for the HBN station during the entire period of record (table 38). The composition of the tributary streams was similar to stream water collected at site 1, with calcium and sodium the dominant cations and bicarbonate and sulfate the dominant anions. Ion balances for all the synoptic samples were positive (range 0.4 to 6.1 percent), indicating that unmeasured constituents, such as organic anions, may have been an important component of stream water during the sampling period. Stream-water chemistry in the basin was quite variable, particularly for the weathering-derived constituents. For example, calcium ranged from a minimum of 140 meq/L at site 5 to 650 meq/L at site 1 and alkalinity, which ranged from 140 meq/L at site 5 to 950 meq/L at site 1. This pattern in stream chemistry seems to reflect the distribution of bedrock types in the basin. Sites with higher concentrations (sites 1 and 3) drain areas underlain by the Permian conglomerates, whereas the more dilute sites (sites 2, 4, 5, and 7) drain large areas of Carlton Rhyolite. Spatial patterns in sulfate and chloride concentrations also seemed to be related to bedrock type; higher concentrations were at sites 1 and 3, and lower concentrations were at sites 2, 4, 5, and 7. Site 6 was the one tributary that did not fit the general pattern by having a low alkalinity similar to streams draining igneous rocks, but having elevated sulfate and chloride similar to streams draining sedimentary rocks. The low silica concentration at site 4 compared to site 7 was somewhat unexpected and may indicate silica removal by diatoms in Ketch Lake. The effect of military activities on water quality in the basin was difficult to evaluate because the sedimentary rocks underlie the same part of the basin that is used for military training. Therefore, it was not possible to determine if differences in water quality between site 7 (upstream from military activities) and site 1 (basin outlet) predominantly reflected the influence of geology or the effect of military activities in the basin.
Table 41. Physical properties and major dissolved constituents from surface-water sampling sites in the Blue Beaver Creek Basin, Oklahoma, collected February 2-3, 1991
[Site locations shown in fig. 20; Q, discharge in cubic meters per second; SC, specific conductance in microsiemens per centimeter at 25 degrees Celsius; pH in standard units; Ca, calcium; Mg, magnesium; Na, sodium; K, potassium; Alk, alkalinity; SO4, sulfate; Cl, chloride; NO3, nitrate; Si, silica; concentrations in microequivalents per liter, except silica in micromoles per liter; <, less than; --, not reported; criteria used in selection of sampling sites: BG = bedrock geology, LU = land use]
|
Site |
Station number |
Q |
SC |
pH |
Ca |
Mg |
Na |
K |
Alk |
SO4 |
Cl |
NO3 |
Si |
Criteria |
Remarks |
|
1 |
7311200 |
0.065 |
130 |
7.8 |
650 |
260 |
390 |
22 |
950 |
230 |
120 |
<4.1 |
180 |
BG, LU | Downstream from Fort Sill |
|
2 |
343946098330200 |
-- |
77 |
6.9 |
320 |
170 |
250 |
17 |
500 |
170 |
70 |
.7 |
230 |
BG | Mixed lithology |
|
3 |
344050098325000 |
.0003 |
120 |
6.9 |
420 |
190 |
480 |
22 |
700 |
250 |
140 |
<5.5 |
250 |
BG | Mixed lithology |
|
4 |
344214098353300 |
.017 |
71 |
7.8 |
350 |
150 |
200 |
31 |
430 |
140 |
70 |
1.4 |
80 |
BG, LU | Rhyolite, below reservoirs |
|
5 |
344216098342700 |
-- |
38 |
6.6 |
140 |
74 |
150 |
9 |
140 |
180 |
42 |
.7 |
250 |
BG | Rhyolite |
|
6 |
344224098342700 |
-- |
77 |
7.1 |
340 |
160 |
220 |
13 |
230 |
310 |
140 |
1.4 |
170 |
BG | Rhyolite |
|
7 |
344327098355700 |
.0042 |
65 |
7.3 |
320 |
140 |
170 |
26 |
450 |
110 |
48 |
2.1 |
140 |
BG, LU | Rhyolite, upstream from Fort Sill |
References Cited
Bailey, R.G., Avers, P.E., King, T., and McNab, W.H., eds., 1994, Ecoregions and subregions of the United States with supplementary table of map unit descriptions: Washington, D.C., U.S. Department of Agriculture Forest Service, scale 1:7,500,000(also at URL http://www.fs.fed.us/land/ecosysmgmt/ecoreg1_home.html, accessed 1998).
Blazs, R.L., Walters, D.M., Coffey, T.E., White, D.K., Boyle, D.L., and Kerestes, J.F., 1996, Water resources data, Oklahoma, water year 1995-v. 2, Red River Basin and ground water wells: U.S. Geological Survey Water- Data Report OK-2, 242 p.
Durum, W.H., 1978, Historical profile of quality of water laboratories and activities, 1879-1973: U.S. Geological Survey Open-File Report 78-432, 235 p.
Gilbert, M.G., 1982, Geologic setting of the eastern Wichita Mountains with a brief discussion of unresolved problems, in Gilbert, M.G., and Donovan, R.N., eds., Geology of the eastern Wichita Mountains, southwestern Oklahoma: Oklahoma Geological Survey Guidebook 21, p. 1-30.
Havens, J.S., 1983, Reconnaissance of groundwater in vicinity of Wichita Mountains, southwestern Oklahoma: Oklahoma Geological Survey Circular 85, 13 p.
Lawrence, C.L., 1987, Streamflow characteristics at hydrologic benchmark stations: U.S. Geological Survey Circular 941, 123 p.
Lynch, J.A., Grimm, J.W., and Bowersox, V.C., 1995, Trends in precipitation chemistry in the United States-A national perspective, 1980-1992:Atmospheric Environment, v. 29, no. 11, p. 1231-1246.
Mobley, H.L., 1967, Soil survey of Comanche County, Oklahoma: U.S. Department of Agriculture, Soil Conservation Service, 58 p.
National Climatic Data Center, 1996, Summary of the day: Boulder, Colorado, EarthInfo Incorporated, CD-ROM.
Appendix A. List of Map References
a. U.S. Geological Survey topographic maps:
- Meers, Oklahoma (1:24,000), 1975
- Mount Scott, Oklahoma (1:24,000), 1975
- Quanah, Oklahoma (1:24,000), 1975
- Saddle Mountain, Oklahoma (1:24,000), 1956
- Taupa, Oklahoma (1:24,000), 1970, gaging station on this quadrangle
- Lawton, Oklahoma (1:100,000), 1981
b. Geologic maps:
- Hoffman, M.G., 1930, Geology and petrology of the Wichita Mountains: Oklahoma Geological Survey Bulletin 52, 83 p., scale 1:63,360.
c. Soil surveys:
- Mobley, H.L., 1967, Soil survey, Comanche County, Oklahoma: U.S. Department of Agriculture Soil Conservation Service, 58 p.
d. Miscellaneous maps:
- Havens, J.S., 1977, Reconnaissance of the water resources of the Lawton quadrangle, southwestern Oklahoma: Oklahoma Geological Survey Hydrologic Atlas HA-6, 4 sheets, scale 1:250,000.
- Havens, J.S., 1983, Reconnaissance of groundwater in vicinity of Wichita Mountains, southwestern Oklahoma: Oklahoma Geological Survey Circular 85, 13 p., sheet 1 of 2, geologic map, scale 1:250,000.
Appendix B. NWIS Site-Identification Numbers
Table B-1. NWIS site-identification numbers and site names for water-quality sampling sites.
|
|
Identification Number |
Site Name |
|
1 |
07311200 |
BLUE BEAVER CR NR CACHE OKLAHOMA |
|
2 |
343946098330200 |
KOEHLER HILL TRIB NR CACHE OKLAHOMA |
|
3 |
344050098325000 |
NEWT JONES HILL TRIB NR MEDICINE PK OKLAHOMA |
|
4 |
344214098353300 |
BLUE BEAVER CR BELOW KETCH L NR THE HOLY CITY OKLAHOMA |
|
5 |
344216098342700 |
MT SHERMAN TRIB NR THE HOLY CITY OKLAHOMA |
|
6 |
344224098342700 |
KETCH RD TRIB NR THE HOLY CITY OKLAHOMA |
|
7 |
344327098355700 |
BLUE BEAVER CR BELOW JED JOHNSON L OKLAHOMA |