
Hydrologic Benchmark Network Stations in the Midwestern U.S. 1963-95 (USGS Circular 1173-B)
|
|
|
|
|
Kiamichi River near Big Cedar, Oklahoma (Station 07335700)
To download a printer friendly PDF version of this information click here.
This report details one of the approximately 50 stations in the Hydrologic Benchmark Network (HBN) described in the four-volume U.S. Geological Survey Circular 1173. The suggested citation for the information on this page is:
|
Mast, M.A., and Turk, J.T., 1999, Environmental characteristics and water quality of Hydrologic Benchmark Network stations in the Midwestern United States, 1963-95: U.S. Geological Survey Circular 1173-B, 130 p. |
All of the tables and figures are numbered as they appear in each circular. Use the navigation bar above to view the abstract, introduction and methods for the entire circular, as well as a map and list of all of the HBN sites. Use the table of contents below to view the information on this particular station.
|
Table of Contents |
| 1. Site Characteristics and Land Use |
| 2. Historical Water Quality Data and Time-Series Trends |
| 3. Synoptic Water Quality Data |
Site Characteristics and Land Use
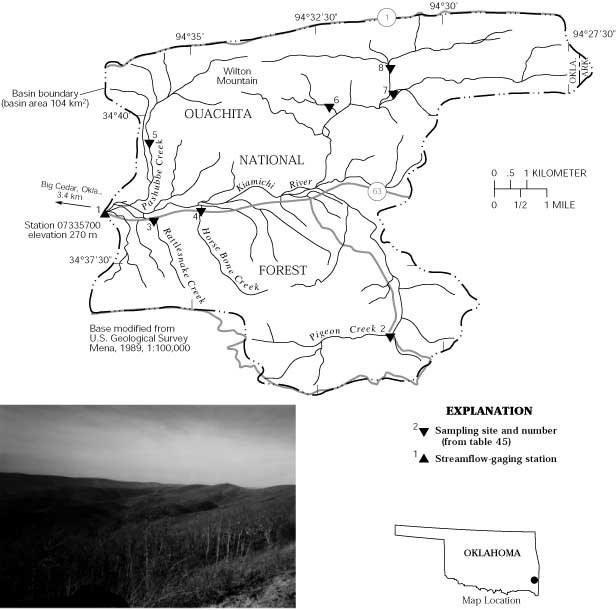
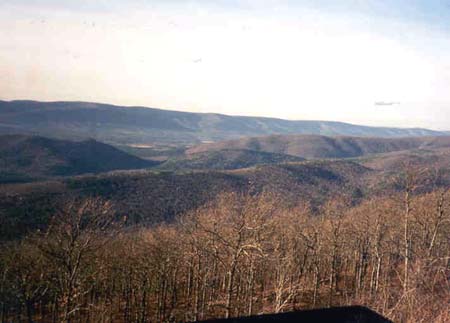
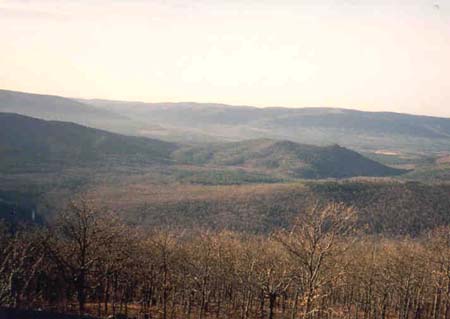
The Kiamichi River HBN Basin is located in the Ouachita Mountains section of the Ouachita physiographic province in southeastern Oklahoma (Figure 22. Map showing study area in the Kamichi River Basin and photograph of the landscape of the basin). The 104-km² basin ranges in elevation from 270 to 810 m and drains an area of steep east-west-trending ridges separated by a broad, flat-bottomed stream valley. The USGS gaging station is located 3.4 km east of the town of Big Cedar, Okla., at latitude 34×38'18'' and longitude 94×36'45''. The Kiamichi River is an east-flowing tributary of the Red River and has a channel length of about 19 km upstream from the gaging station and an average stream gradient of 11.1 m/km. Mean monthly discharge varies from 0.22 m³/s in August to 4.2 m³/s in March, although periods of no flow occur during most years in August and September. Average annual runoff from the basin was 74 cm from 1966 through 1995 (Blazs and others, 1996). The climate is characterized as subtropical with hot, humid summers and mild winters (U.S. Department of Agriculture, 1990c). Average daily air temperatures range from 4.9×C in January to 27.2×C in July (Abernathy and Olszewski, 1983). Precipitation averages 130 cm annually with October, November, and December generally the driest months (National Climatic Data Center, 1997).
The Kiamichi River Basin is in the Ouachita Mixed Forest-Meadow ecoregion (Bailey and others, 1994), and forests are dominated by second growth (50 to 70 years old) oak, hickory, and pine vegetation types (U.S. Department of Agriculture, 1990b). Drier south- and west-facing slopes are dominated by shortleaf pine and minor amounts of loblolly pine. Pines and hardwoods grow together on wetter north- and east-facing slopes. The predominant hardwood species in these areas are white oak, black oak, post oak, blackjack oak, black hickory, pignut hickory, and mockernut hickory. Hardwoods predominant on the rich bottomlands of the stream valleys. Soils in the basin are classified as Ultisols and are mapped in the Carnaswa-Octavia-Pirum and Neff-Kenn-Ceda soil associations (Abernathy and Olszewski, 1983). The Carnaswa-Octavia-Pirum soils are mapped along the ridges and hillslopes and include well-drained, moderately deep soils developed in sandstone and shale. A typical soil profile has a surface layer of brown stony loam up to 20 cm thick overlying a subsoil of red clay loam and clay that extends to 150 cm. These soils are generally acidic (4.5 to 5.5), have a low organic-matter content (0.2 to 2 percent), and contain as much as 40 percent cobbles and gravel of sandstone and shale (Abernathy and Olszewski, 1983). The Neff-Kenn-Ceda soils are mapped along the flood plain of the Kiamichi River and are primarily level soils that have developed in loamy alluvium and are subject to flooding. A typical profile has a 20-cm surface layer of dark brown silt loam overlying a subsoil of dark yellowish-brown silty clay loam that extends to depths of 150 to 200 cm.
 |
The Ouachita Mountains are composed of sedimentary rocks of Paleozoic age that have been intensely deformed into a series of east-west-trending, tightly folded anticlines and synclines that strongly control the local topography (Seeley, 1963; Briggs, 1973). The Paleozoic formations underlying the basin include the Tenmile Creek Formation of Mississippian age and Jackfork Group of Pennsylvanian age. The Tenmile Creek Formation consists of dark gray shales and interbedded siltstone and sandstone layers; it is easily weathered and forms the floor of the Kiamichi River Valley. The Jackfork Group consists of alternating layers of sandstone and shale, of which sandstones account for more than 60 percent (Briggs, 1973). Rocks in the Jackfork Group are more resistant to weathering than the shales of the Tenmile Creek Formation and form the long, narrow ridges of the Kiamichi River Valley. Bedrock along the flood plain of the river is covered by recent alluvial deposits consisting of unconsolidated sand, silt, and clay that reach as much as 10 m thick (Abernathy and Olszewski, 1983).
The Kiamichi River drains the southeastern part of Le Flore County in Oklahoma and is entirely in the boundaries of the Kiamichi Ranger District of the Ouachita National Forest. About 35 percent of land in the northwestern part of the basin is in the Upper Kiamichi River Wilderness, which is accessible by several foot trails (Frank Yerby, U.S. Department of Agriculture Forest Service, written commun., 1996). Privately owned lands, which are concentrated along the main channel of the Kiamichi River, account for 9 percent of land in the National Forest boundary. Several paved and gravel roads traverse the basin, including a section of State Highway 63 that parallels the lower reach of the main river channel. Because of the infrequent occurrence of snow or ice events, there is no salting or plowing of roads in the basin.
Land cover in the basin is 98 percent forest and 2 percent pasture (Frank Yerby, U.S. Department of Agriculture Forest Service, written commun., 1996). Land-use activities in the basin include timber harvesting, recreation, and a small amount of cattle grazing. National Forest land in the basin is divided into two management areas, wilderness and general forest (Frank Yerby, written commun., 1996). The management policy for Upper Kiamichi River Wilderness is to preserve or enhance the wilderness resource for the protection and perpetuation of natural conditions. In the wilderness, motorized travel is prohibited and the forests are unavailable for harvesting. The remainder of National Forest land in the basin is classified as suitable for timber production (U.S. Department of Agriculture, 1990b). These forests are managed as southern yellow pine and mixed pine-hardwood types, using a combination of even-aged and uneven-aged silvicultural systems. During the past 10 years, about 600 ha of forest land in the basin have been harvested using a combination of thinning cuts, uneven-aged cuts, clearcuts, and seed-tree cuts (Frank Yerby, written commun., 1996). Most privately owned land is located along the lower reaches of the river and includes permanent rural residences and recreation retreats owned by absentee landowners. About 200 ha, or 25 percent, of private land is open pasture, which is used for cattle grazing. The only major change in land use in the basin during the past 30 years was the designation of the Upper Kiamichi River Wilderness in 1988 (U.S. Department of Agriculture, 1990b).
Historical Water-Quality Data and Time-Series Trends
The data set for the Kiamichi River HBN Station analyzed for this report includes 226 water-quality samples that were collected from January 1966 through August 1995. Sampling frequency ranged from 8 to 12 samples per year from 1966 through 1982, and then was quarterly from 1983 through 1995. Samples in the early part of the period of record were probably analyzed at a USGS laboratory in Oklahoma City, Okla., that operated until 1973 (Durum, 1978). After the establishment of the central laboratory system, samples were analyzed at a laboratory in Salt Lake City, Utah, from 1973 through 1975 and at the NWQL in Arvada, Colo., from 1976 through 1995. Daily discharge records for the Kiamichi River (station 07335700) are available beginning in October 1965, and precipitation amount at the gaging station is available beginning in October 1993.
Calculated ion balances for 198 samples with complete major-ion analyses are shown in Figures 23a and 23b. Temporal variation of discharge, field pH, major dissolved constituents, and ion balance at Kiamichi River, Oklahoma. Ion balances ranged from -35 to 28 percent, and only 70 percent of samples had values within the ±10 percent range. This wide range of values was not unexpected and reflects the difficulties of making precise analytical measurements at the low solute concentrations typical of this station. The average ion balance was -4.3 percent, and 70 percent of the samples had negative balances, indicating a slight excess of measured anions over cations in solution. Natural waters commonly have an excess of cations in solution owing to the presence of unmeasured organic anions. An anion excess is more difficult to explain than a cation excess and may indicate a bias in one of the analytical measurements. One possibility is a positive bias in the laboratory alkalinity measurements, which were determined by fixed endpoint titration to pH 4.5. In low ionic-strength water, the endpoint is often closer to pH 5.0, which can result in an overestimation of alkalinity by as much as 25 meq/L (Barnes, 1964). Time-series plots of the major dissolved constituents were inspected for evidence of other method-related effects (fig. 23). The most notable pattern was observed in the sulfate concentrations, which had a period of elevated concentrations during the 1980's, followed by a period of low concentrations at the end of the period of record. The elevated sulfate concentrations coincided with the use of a turbidimetric titration method at the NWQL between 1983 and 1989 (Fishman and others, 1994). Sulfate concentrations were later determined to be frequently overestimated by this method, and the bias was most pronounced in dilute waters, although the bias was not consistent among samples and appeared to be affected by factors such as color and turbidity (Schertz and others, 1994). The sulfate method was changed to ion chromatography in 1990 (Office of Water Quality Technical Memorandum No. 90.04, Turbidimetric Sulfate Method, issued December 21, 1989, at URL http://water.usgs.gov/admin/memo/, accessed 1997), which is coincident with the low concentrations observed during the last 6 years of record.
 |
Median concentrations and ranges of major constituents in stream water at the Kiamichi River Station and VWM concentrations in wet-only deposition measured at the Caddo Valley NADP Station are listed in table 42. Precipitation chemistry at the NADP station, which is located 150 km east of the gaging station, is dilute and slightly acidic with a VWM pH of 4.7 for 12 years of record. The predominant cations in precipitation were hydrogen and ammonium, which contributed 44 and 22 percent of the total cation charge, respectively. The predominant anions were sulfate and nitrate, which accounted for 56 and 30 percent of the total anion charge, respectively. The predominance of strong acid anions indicates that precipitation at the NADP station may be affected by anthropogenic emissions of sulfur and nitrogen compounds, which cause acid rain.
Table 42. Minimum, first quartile, median, third quartile, and maximum values of physical properties and major dissolved constituents measured in water-quality samples from the Kiamichi River, Oklahoma, January 1966 through August 1995, and volume-weighted mean concentrations in wet precipitation collected at the Caddo Valley Station, Arkansas
[Concentrations in units of microequivalents per liter, discharge in cubic meters per second, specific conductance in microsiemens per centimeter at 25 degrees Celsius, and silica in micromoles per liter; n, number of stream samples; VWM, volume-weighted mean; inst., instantaneous; spec. cond., specific conductance; <, less than; --, not reported]
|
Parameter |
Stream Water |
Precipitation VWMa |
|||||
|
Minimum |
First quartile |
Median |
Third quartile |
Maximum |
n |
||
| Discharge, inst. |
0.0003 |
0.26 |
0.88 |
2.28 |
170 |
223 |
-- |
| Spec. cond., field |
12 |
21 |
25 |
29 |
58 |
208 |
13 |
| pH, field |
4.7 |
6.5 |
6.8 |
7.1 |
9.0 |
208 |
4.7b |
| Calcium |
5.0 |
50 |
60 |
85 |
220 |
217 |
5.9 |
| Magnesium |
<8.0 |
48 |
56 |
72 |
190 |
219 |
2.1 |
| Sodium |
48 |
78 |
87 |
100 |
370 |
221 |
6.4 |
| Potassium |
10 |
15 |
18 |
23 |
46 |
216 |
.8 |
| Ammonium |
<.7 |
1.4 |
2.1 |
4.3 |
11 |
68 |
10 |
| Alkalinity, laboratory |
20 |
100 |
120 |
160 |
320 |
219 |
-- |
| Sulfate |
17 |
50 |
71 |
96 |
230 |
225 |
26 |
| Chloride |
<2.8 |
48 |
59 |
73 |
190 |
223 |
6.6 |
| Nitrite plus nitrate |
<.7 |
2.3 |
3.6 |
7.1 |
34 |
146 |
14c |
| Silica |
12 |
120 |
130 |
140 |
180 |
224 |
-- |
a Data are volume-weighted mean concentrations for 1984-95.
b Laboratory pH.
c Nitrate only.
Stream water in the Kiamichi River is dilute and weakly buffered; specific conductance ranged from 12 to 58 mS/cm, and alkalinity was between 20 and 320 meq/L (table 42). The major cations in stream water were sodium, calcium, and magnesium, and alkalinity was the predominant anion. The low stream-water concentrations of weathering-derived constituents, particularly alkalinity, are attributed to the lack of weatherable minerals in the underlying sandstone and shale bedrock. The median concentration of chloride in stream water was 59 meq/L, which is about nine times the VWM concentration of 6.6 meq/L in precipitation. On the basis of the difference between annual precipitation and runoff, evapotranspiration can account for roughly a twofold increase in the chloride concentration of precipitation, indicating that most stream-water chloride is derived from sources other than precipitation. The most likely source of additional stream-water chloride is weathering of salts in the underlying marine sedimentary rocks, although some chloride may be derived from rural residences and pasture land along the lower reach of the river channel. The median concentration of sulfate in stream water was 71 µmeq/L compared to 26 meq/L in precipitation, which is slightly larger than would be expected from the effects of evapotranspiration. Additional sources of stream-water sulfate include dry deposition from the atmosphere and weathering of small amounts of pyrite in the underlying shales. The low concentrations of nitrate and ammonium in stream water compared to precipitation indicate that nitrogen is strongly retained by soils and vegetation in the basin. The low stream-water nitrogen concentrations also indicate that strips of grazing land bordering the stream do not seem to greatly affect the nutrient composition of stream water at the HBN station.
The solute composition of stream water was further evaluated by analyzing correlations between solutes and stream discharge (table 43). Most of the weathering-derived constituents had weak inverse correlations with discharge, except for silica (rho = -0.008). Most solutes had weak positive correlations; the strongest correlations were between calcium and magnesium (rho = 0.641) and magnesium and potassium (rho = 0.607). The positive correlations between calcium and magnesium and magnesium and potassium are consistent with the weathering of carbonate minerals and clays in the sandstone and shale bedrock. The moderate correlation between sodium and chloride (rho = 0.525) provides additional evidence that chloride is derived from weathering of salts in the underlying sedimentary rocks.
Table 43. Spearman rank correlation coefficients (rho values) showing the relation among discharge, pH, and major dissolved constituents, Kiamichi River, Oklahoma, 1966-95
[Q, discharge; Ca, calcium; Mg, magnesium; Na, sodium; K, potassium; Alk, alkalinity; SO4, sulfate; Cl, chloride; N, nitrite plus nitrate; Si, silica]
|
|
Q |
pH |
Ca |
Mg |
Na |
K |
Alk |
SO4 |
Cl |
| pH |
0.005 |
|
|
|
|
|
|
|
|
| Ca |
-.483 |
0.012 |
|
|
|
|
|
|
|
| Mg |
-.609 |
.032 |
0.641 |
|
|
|
|
|
|
| Na |
-.460 |
-.006 |
.556 |
0.563 |
|
|
|
|
|
| K |
-.500 |
-.094 |
.560 |
.607 |
0.517 |
|
|
|
|
| Alk |
-.484 |
-.284 |
.381 |
.453 |
.282 |
0.373 |
|
|
|
| SO4 |
.191 |
-.146 |
-.030 |
-.153 |
.118 |
.139 |
-0.217 |
|
|
| Cl |
-.261 |
.125 |
.352 |
.191 |
.525 |
.342 |
.005 |
0.272 |
|
| Si |
-.008 |
-.008 |
.031 |
.083 |
.251 |
.177 |
-.016 |
.104 |
0.087 |
Results of the seasonal Kendall test for trends in discharge and major dissolved constituents are listed in table 44. Statistically significant trends were detected in the unadjusted sulfate and chloride concentrations at the 0.01 probability level. Results for the flow-adjusted chloride concentrations were similar to the unadjusted concentrations, indicating that the trend was not caused by variations in stream discharge. The trend in sulfate, however, was not statistically significant after the concentrations were adjusted for flow. The LOWESS curve for chloride shows a gradual decrease in concentrations beginning in the mid-1970's (fig. 23). It is unlikely that human activities caused the trend in stream-water chloride because there were few changes in land use during the period of record. Trends in atmospheric deposition at this site are difficult to confirm because no long-term records of precipitation chemistry are available for the area. Lynch and others (1995) reported significant declines in calcium, magnesium, and sulfate concentrations in precipitation at a nearby NADP station in Arkansas from 1982 through 1990, but detected no trend in chloride. Alternatively, the trend in stream-water chloride may have been caused by laboratory bias introduced by improvements and changes in analytical method for chloride during the 30-year period of record (Fishman and others, 1994).
Table 44. Results of the seasonal Kendall test for trends in discharge and unadjusted and flow-adjusted pH and major dissolved constituents, Kiamichi River, Oklahoma, January 1966 through August 1995
[Trends in units of microequivalents per liter per year, except discharge in cubic meters per second per year, pH in standard units per year, and silica in micromoles per liter per year; inst., instantaneous; <, less than; --, not calculated]
|
Parameter |
Unadjusted |
Flow adjusted |
||
|
Trend |
p-value |
Trend |
p-value |
|
| Discharge, inst. |
<0.01 |
0.068 |
-- |
-- |
| pH, field |
<.01 |
.558 |
<0.01 |
0.728 |
| Calcium |
-.7 |
.011 |
-.7 |
.011 |
| Magnesium |
<.1 |
.406 |
.2 |
.234 |
| Sodium |
-.5 |
.011 |
-.4 |
.021 |
| Potassium |
<.1 |
.963 |
<.1 |
.505 |
| Alkalinity, laboratory |
<.1 |
.343 |
.6 |
.162 |
| Sulfate |
-.8 |
.004 |
-.6 |
.037 |
| Chloride |
-1.0 |
.000 |
-.9 |
.000 |
| Nitrite plus nitrate |
(a) |
-- |
-- |
-- |
| Silica |
.3 |
.047 |
.4 |
.071 |
a Insufficient data to calculate trend.
Synoptic Water-Quality Data
Results of the surface-water synoptic sampling in the Kiamichi River Basin on January 31 and February 1, 1991, are listed in table 45, and the locations of the sampling sites are shown in figure 22. During the sampling period, discharge at the gaging station was about 0.8 m³/s compared to the median daily discharge of about 1.3 m³/s for January and February (Lawrence, 1987), indicating that the basin was sampled during low-flow conditions for that time of year. The concentrations of most solutes measured at site 1 were less than the first-quartile concentrations reported for the HBN station during the entire period of record (table 42). The tributary streams were similar in composition to stream water collected at the gaging station (site 1); sodium was the predominant cation, and bicarbonate and sulfate were the predominant anions. Ion balances for the synoptic samples ranged -5.5 to 2.8 percent, indicating that unmeasured constituents, such as organic anions, did not seem to be an important component of stream water during the sampling period.
Table 45. Physical properties and major dissolved constituents from surface-water sampling sites in the Kiamichi River Basin, Oklahoma, collected January 31-February 1, 1991
[Site locations shown in fig. 22; Q, discharge in cubic meters per second; SC, specific conductance in microsiemens per centimeter at 25 degrees Celsius; pH in standard units; Ca, calcium; Mg, magnesium; Na, sodium; K, potassium; Alk, alkalinity; SO4, sulfate; Cl, chloride; NO3, nitrate; Si, silica; concentrations in microequivalents per liter, except silica in micromoles per liter; develop., development; <, less than; --, not reported; criteria used in selection of sampling sites: BG = bedrock geology, LU = land use]
|
Site |
Station number |
Q |
SC |
pH |
Ca |
Mg |
Na |
K |
Alk |
SO4 |
Cl |
NO3 |
Si |
Criteria |
Remarks |
|
1 |
7335700 |
0.82 |
19 |
6.8 |
36 |
46 |
70 |
13 |
73 |
58 |
39 |
2.1 |
120 |
LU | Downstream from develop. |
|
2 |
343623094310200 |
.062 |
16 |
6.7 |
24 |
46 |
52 |
11 |
46 |
46 |
34 |
1.4 |
110 |
BG | Mixed lithology |
|
3 |
343813094354800 |
.0084 |
24 |
6.4 |
50 |
64 |
96 |
14 |
120 |
60 |
48 |
1.4 |
170 |
BG | Predominantly shale |
|
4 |
343822094344700 |
.011 |
18 |
6.3 |
33 |
45 |
74 |
12 |
70 |
52 |
39 |
4.3 |
140 |
BG | Predominantly shale |
|
5 |
343929094355100 |
-- |
16 |
5.8 |
21 |
36 |
52 |
12 |
23 |
60 |
34 |
<.7 |
110 |
BG | Sandstone |
|
6 |
344004094320900 |
-- |
15 |
6.5 |
22 |
31 |
52 |
12 |
45 |
40 |
39 |
<.7 |
110 |
BG | Sandstone |
|
7 |
344020094305800 |
.042 |
13 |
6.4 |
19 |
31 |
43 |
10 |
33 |
48 |
34 |
<.7 |
92 |
BG, LU | Sandstone, above develop. |
|
8 |
344045094310500 |
.11 |
13 |
6.1 |
19 |
37 |
48 |
11 |
23 |
50 |
34 |
<.7 |
90 |
BG | Sandstone |
In general, stream chemistry did not vary markedly among the sampling sites, although the weathering-derived solutes had the widest range of concentrations. For example, sodium ranged from 43 to 96 meq/L, silica ranged from 90 to 170 mmol/L, and alkalinity ranged from 23 to 120 meq/L. Although small, this variability in surface-water chemistry seems to be related to the distribution of the sedimentary units in the basin. For example, the highest concentrations of cations, alkalinity, and silica were measured at sites 3 and 4, which are downstream from areas underlain by the Tenmile Creek Formation, and the lowest concentrations were measured at sites 7 and 8, which are in areas underlain by rocks of the Jackfork Group. Both of these formations consist of sandstones, shales, and mudstones; however, the Jackfork Group is predominantly shale and the Tenmile Creek Formation is predominantly sandstone. Concentrations of the remaining solutes showed less variability among the sampling sites. For example, sulfate concentrations ranged from 40 to 60 meq/L, chloride ranged from 34 to 48 meq/L, and nitrate concentrations at all sites were less than 5 meq/L. Neither chloride nor nitrate concentrations were elevated at site 1 compared to the upstream sites, indicating that pasture land and rural residential areas that are concentrated along the lower reaches of the Kiamichi River did not affect stream chemistry at the gaging station during the sampling period.
References Cited
Abernathy, E.J., and Olszewski, K.M., 1983, Soil survey of LeFlore County, Oklahoma: U.S. Department of Agriculture Soil Conservation Service p. 211.
Bailey, R.G., Avers, P.E., King, T., and McNab, W.H., eds., 1994, Ecoregions and subregions of the United States with supplementary table of map unit descriptions: Washington, D.C., U.S. Department of Agriculture Forest Service, scale 1:7,500,000(also at URL http://www.fs.fed.us/land/ecosysmgmt/ecoreg1_home.html, accessed 1998).
Blazs, R.L., Walters, D.M., Coffey, T.E., White, D.K., Boyle, D.L., and Kerestes, J.F., 1996, Water resources data, Oklahoma, water year 1995-v. 2, Red River Basin and ground water wells: U.S. Geological Survey Water- Data Report OK-95-2, 242 p.
Briggs, Garrett, 1973, Geology of the eastern part of the Lynn Mountain Syncline, Le Flore County, Oklahoma: Oklahoma Geological Survey Circular 75, 31 p.
Durum, W.H., 1978, Historical profile of quality of water laboratories and activities, 1879-1973: U.S. Geological Survey Open-File Report 78-432, 235 p.
Fishman, M.J., Raese, J.W., Gerlitz, C.N., and Husband, R.A., 1994, U.S. Geological Survey approved inorganic and organic methods for the analysis of water and fluvial sediment, 1954-94: U.S. Geological Survey Open-File Report 94-351, 55 p.
Lawrence, C.L., 1987, Streamflow characteristics at hydrologic benchmark stations: U.S. Geological Survey Circular 941, 123 p.
Lynch, J.A., Grimm, J.W., and Bowersox, V.C., 1995, Trends in precipitation chemistry in the United States-A national perspective, 1980-1992:Atmospheric Environment, v. 29, no. 11, p. 1231-1246.
National Climatic Data Center, 1996, Summary of the day: Boulder, Colorado, EarthInfo Incorporated, CD-ROM.
Seeley, D.R., 1963, Structure and stratigraphy Rich Mountain area: Oklahoma Geological Survey Bulletin 101, 173 p.
U.S. Department of Agriculture, 1990b, Land and resource management plan, Ouachita National Forest: U.S. Department of Agriculture Forest Service, Southern Region.
U.S. Department of Agriculture, 1990c, Vegetation management in the Ozark/Ouachita Mountains, Final Environmental Impact Statement: U.S. Department of Agriculture Forest Service, Southern Region, Management Bulletin R8-MB 45.
Appendix A. List of Map References
a. U.S. Geological Survey topographic maps:
- Lynn Mountain, Oklahoma (1:24,000), 1981
- Mountain Fork, Arkansas-Oklahoma (1:24,000), 1979
- Page, Oklahoma (1:24,000), 1981, gaging station on this quadrangle,
- Zafra, Oklahoma-Arkansas (1:24,000), 1979
- Mena, Oklahoma (1:100,000), 1975
b. Geologic maps:
- Briggs, Garrett, 1973, Geology of the eastern part of the Lynn Mountain Syncline, Le Flore County, Oklahoma: Oklahoma Geological Survey Circular 75, scale 1:42,240.
- Seely, D.R., 1963, Structure and stratigraphy Rich Mountain area: Oklahoma Geological Survey Bulletin 101, scale 1:50,000.
c. Soil surveys:
- Abernathy, E.J., and Olszewski, K.M., 1983, Soil survey of Le Flore County, Oklahoma: U.S. Department of Agriculture Soil Conservation Service, 211 p.
d. Miscellaneous maps:
- U.S. Department of Agriculture, 1978, Ouachita National Forest, Kiamichi Division, Oklahoma: Atlanta, Georgia, U.S. Department of Agriculture Forest Service, Southern Region, scale 1:126,720.
- U.S. Department of Agriculture, 1994, Map of Ouachita National Forest, Arkansas- Oklahoma: Atlanta, Georgia, U.S. Department of Agriculture Forest Service, Southern Region, scale 1:500,000.
Appendix B. NWIS Site-Identification Numbers
Table B-1.NWIS site-identification numbers and site names for water-quality sampling sites.
|
|
Identification Number |
Site Name |
|
1 |
07335700 |
KIAMICHI R NR BIG CEDAR OKLAHOMA |
|
2 |
343623094310200 |
PIGEON CR AT FR 6026 NR MTN FORK ARKANSAS |
|
3 |
343813094354800 |
RATTLESNAKE CR NR BIG CEDAR OKLAHOMA |
|
4 |
343822094344700 |
HORSE BONE CR NR BIG CEDAR OKLAHOMA |
|
5 |
343929094355100 |
PASHUBBE CR NR BIG CEDAR OKLAHOMA |
|
6 |
344004094320900 |
PIDDLY CR NR MTN FORK ARKANSAS |
|
7 |
344020094305800 |
KIAMICHI R ABOVE SCENIC DR TRIB NR MTN FORK ARKANSAS |
|
8 |
344045094310500 |
SCENIC DR TRIB NR MTN FORK ARKANSAS |
| Back to 1173-B Contents |
This page maintained by Nichole Bisceglia.
Last updated July 17, 2000.