
Hydrologic Benchmark Network Stations in the Midwestern U.S. 1963-95 (USGS Circular 1173-B)
|
|
|
|
|
Devils River at Pafford Crossing near Comstock, Texas (Station 08449400)
To download a printer friendly PDF version of this information click here.
This report details one of the approximately 50 stations in the Hydrologic Benchmark Network (HBN) described in the four-volume U.S. Geological Survey Circular 1173. The suggested citation for the information on this page is:
|
Mast, M.A., and Turk, J.T., 1999, Environmental characteristics and water quality of Hydrologic Benchmark Network stations in the Midwestern United States, 1963-95: U.S. Geological Survey Circular 1173-B, 130 p. |
All of the tables and figures are numbered as they appear in each circular. Use the navigation bar above to view the abstract, introduction and methods for the entire circular, as well as a map and list of all of the HBN sites. Use the table of contents below to view the information on this particular station.
|
Table of Contents |
| 1. Site Characteristics and Land Use |
| 2. Historical Water Quality Data and Time-Series Trends |
| 3. Synoptic Water Quality Data |
Site Characteristics and Land Use
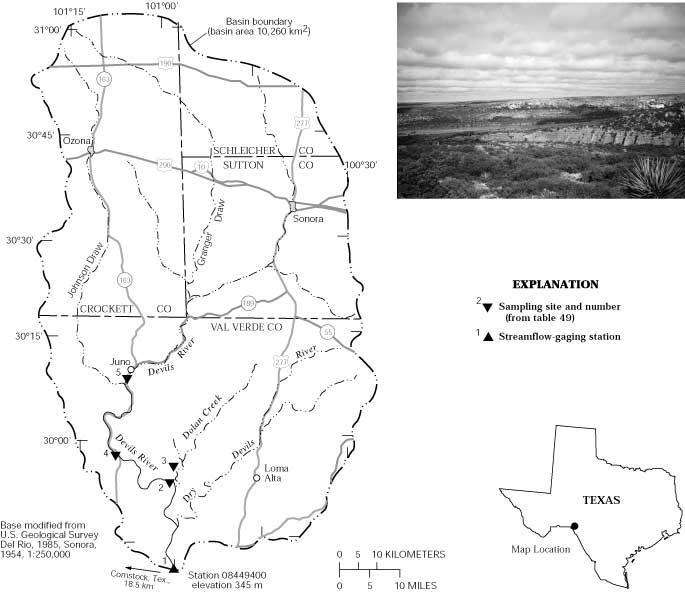
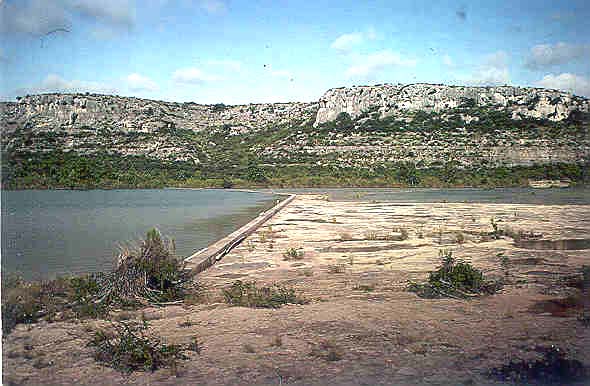
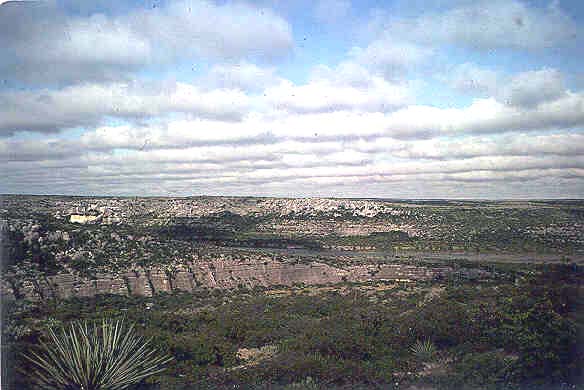
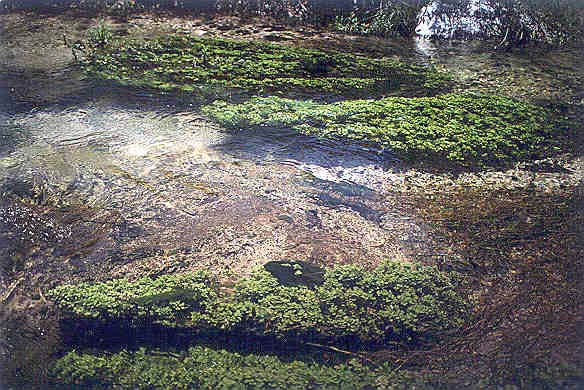
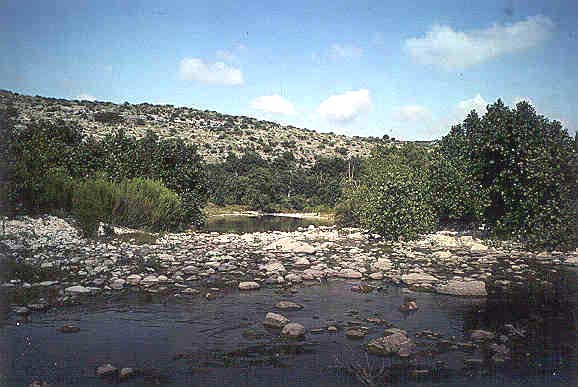
The Devils River HBN Basin is in the Great Plains physiographic province in southwestern Texas (Figure 24. Map showing study area in the Devils River Basin and photograph of the landscape of the basin). The 10,260-km² basin ranges in elevation from 345 to more than 820 m and drains the southern part of the Edwards Plateau, an arid upland of rough and broken limestone topography cut by narrow, steep-walled canyons (Barker and others, 1994). The gaging station on the Devils River is located 18.5 km east of Comstock, Tex., at latitude 29×40'35'' and longitude 101×00'00''. The Devils River is a south-flowing tributary of the Rio Grande and discharges into the Amistad Reservoir just downstream from the gaging station. Perennial streamflow occurs in the main channel of the Devils River south of Juno because of ground-water discharge from several springs in the lower part of the basin (fig. 24). The perennial reach of the river has a channel length of about 65 km and an average stream gradient of 2.1 m/km. Discharge at the gaging station is uniform throughout the year, with average monthly discharges that range from of 7.3 m³/s in February to 20.4 m³/s in September (International Boundary and Water Commission, 1995). Major floods occur periodically that transport enormous quantities of gravel and rock in the channel and strip most vegetation from the banks (Texas Water Commission, 1992). Average annual runoff from the basin was 32 cm from 1960 through 1995. The climate is classified as semiarid, continental with dry winters and hot summers. Average daily air temperatures range from 10.4×C in January to 30.4×C in July (Golden and others, 1982). The average annual rainfall is 53 cm, and May and September generally are the months of greatest precipitation (International Boundary and Water Commission, 1995).
 |
The Devils River Basin is in the Chihuahuan Desert ecoregion, which is characterized by extensive arid grasslands and thorny shrubs that frequently grow in open stands (Bailey and others, 1994). The predominant grasses are sideoats grama and hairy grama, which, when heavily grazed, are replaced by woody shrubs and red grama, fall witchgrass, and perennial three-awn (Golden and others, 1982). Some of the predominant woody plants are juniper, Texas persimmon, live oak, mesquite, catclaw, ocotillo, yucca, and cactus. Most soils in the basin are classified as Aridisols and are mapped in the Ector-Rock Outcrop association (Golden and others, 1982). This association consists of limestone outcrops interspersed with shallow, well-drained Ector soils on upland side slopes and ridges. A typical soil profile has a surface layer of alkaline, grayish-brown stony loam that is 20 to 30 cm thick overlying as much as 15 cm of highly fractured and indurated limestone with coatings of calcium carbonate on cracks and crevices. More than one-half of the soil surface is generally covered with limestone gravel and cobbles. Deep, loamy and clayey soils belonging to the Dev-Rio Diablo association are mapped on flood plains and terraces along the river (Golden and others, 1982).
The basin is underlain by marine sedimentary rocks of Cretaceous age, including the Segovia Member of the Edwards Limestone, the Devils River Limestone, and the Buda Limestone (Barnes, 1981). The aerially most extensive unit is the Segovia Member, consisting of beds of cherty limestone, dolomite, and marl. The Buda Limestone is primarily mapped in the northern part of the basin and forms a resistant cap over much of the plateau surface. The Devils River Limestone crops out south of Dolan Springs and includes limestone and dolomite units. The Devils River Formation is very permeable and porous (Barker and others, 1994) and probably is an important source of water to springs recharging the Devils River.
The Devils River Basin drains parts of Crockett, Sutton, Schleicher, and Val Verde Counties in Texas, and land ownership is predominantly private. The Devils River State Natural Area, located near the mouth of Dolan Creek, is managed by the Texas Parks and Wildlife Division and provides habitat for several rare endemic or peripheral species of fish that live in the Devils River (Texas Water Commission, 1992). The 2-km reach of the main channel upstream from the gaging station is in the boundaries of the Amistad National Recreation Area. A few State and Federal highways traverse the basin, although most of the basin is inaccessible because of private land ownership. The basin is sparsely populated, and the major land-use activity is ranching. The average ranch size is about 3,000 ha, and most of the income is generated from sheep, Angora goats, and cattle (Golden and others, 1982). The towns of Ozono (population 3,181) and Sonora (population 2,751), as well as several oil and gas fields, are located in the upper part of the basin more than 100 km north of the HBN station.
Historical Water-Quality Data and Time-Series Trends
The data set for the Devils River HBN Station analyzed for this report includes 104 water-quality samples that were collected from January 1978 through August 1995. Sampling frequency was monthly from 1978 through 1980, bimonthly from 1981 through 1986, and quarterly from 1987 through 1995. Water-quality samples were analyzed at the NWQL in Arvada, Colo., for the entire period of record. Daily discharge records are available for the Devils River (station 08449400) beginning in 1960. The gaging station is operated by the International Boundary and Water Commission (IBWC) as part of the 1944 Water Treaty requiring that the IBWC keep a record of the Rio Grande waters belonging to the United States and Mexico (http://www.ibwc.state.gov). Data from gaging stations and records of rainfall and evaporation stations operated by the IBWC are published annually.
 |
Calculated ion balances for 100 samples with complete major-ion analyses are shown in Figures 25a and 25b. Temporal variation of discharge, field pH, major dissolved constituents, and ion balance at Devils River, Texas. Ion balances ranged from -5.6 to 9.6 percent, and more than 95 percent of the samples had values in the ±5 percent range, indicating that the analyses are of high quality. The average ion balance for all samples was slightly positive (1.4 percent), which probably is due to the fact that the nitrite-plus-nitrate concentrations were not included in the ion balance calculation. The average nitrite-plus-nitrate concentration was 110 meq/L, or 1.3 percent of the total ionic charge, which accounts for the average charge imbalance of 1.4 percent. Time-series plots of the major dissolved constituents were inspected for evidence of other method-related effects (fig. 25). The temporal pattern in field pH shows a period of low pH values in the first part of the period of record and high pH values in the later part. Although this trend in pH may have been caused by environmental factors, a change in analytical methods may provide a more reasonable explanation, particularly considering the sudden decrease in pH in 1980 and the subsequent increase in 1987. Similar trends in field pH measurements were reported at a number of streams throughout Texas during the same period of record (Schertz and others, 1994). Schertz and others determined the pH trends were probably caused by method-related factors because a single environmental change was unlikely to have caused a State-wide change in stream chemistry. Sulfate concentrations also had a few unusual patterns, including a period of high scatter and several elevated concentrations before 1982, followed by a period of less data scatter and low concentrations. Although natural variations in stream chemistry cannot be completely ruled out, these patterns probably were caused by changes in analytical methods used by the NWQL in Arvada, Colo. Two documented changes occurred during this period of record, the replacement of a colorimetric method by a turbidimetric method in 1982, followed by the replacement of the turbidimetric method by ion chromatography in 1990 (Fishman and others, 1994). Another notable pattern in figure 25 is the apparent increase in ion balance beginning in the mid-1980's. The cause of this increase could not be identified, although it is coincident with the change in analytical method for sulfate that occurred in 1982.
Median concentrations and ranges of major constituents in stream water at the Devils River Station and VWM concentrations in wet-only deposition measured at the Sonora NADP Station are listed in table 46. Precipitation chemistry at the NADP station, which is located about 75 km northeast of the gaging station, is dilute and only slightly acidic with a VWM pH of 5.2 for 12 years of record. The predominant cations were calcium and ammonium, which contributed 34 and 29 percent of the total cation charge, respectively. Sulfate and nitrate were the predominant anions and accounted for 55 and 29 percent of the total anion charge, respectively.
Table 46. Minimum, first quartile, median, third quartile, and maximum values of physical properties and major dissolved constituents measured in water-quality samples from the Devils River, Texas, January 1978 through August 1995, and volume-weighted mean concentrations in wet precipitation collected at the Sonora Station, Texas
[Concentrations in units of microequivalents per liter, discharge in cubic meters per second, specific conductance in microsiemens per centimeter at 25 degrees Celsius, and silica in micromoles per liter; n, number of stream samples; VWM, volume-weighted mean; inst., instantaneous; spec. cond.,specific conductance; <, less than; --, not reported]
|
Parameter |
Stream Water |
Precipitation VWMa |
|||||
|
Minimum |
First quartile |
Median |
Third quartile |
Maximum |
n |
||
| Discharge, inst. |
4.0 |
6.6 |
8.7 |
10 |
22 |
104 |
-- |
| Spec. cond., field |
250 |
370 |
390 |
410 |
460 |
104 |
8.2 |
| pH, field |
7.0 |
7.7 |
7.9 |
8.2 |
8.4 |
104 |
5.2b |
| Calcium |
1,900 |
2,450 |
2,650 |
2,800 |
3,150 |
104 |
14 |
| Magnesium |
470 |
1,040 |
1,120 |
1,150 |
1,200 |
104 |
2.2 |
| Sodium |
140 |
340 |
360 |
370 |
430 |
104 |
6.2 |
| Potassium |
26 |
33 |
33 |
38 |
67 |
103 |
.7 |
| Ammonium |
<.7 |
1.4 |
2.1 |
3.6 |
10 |
83 |
12 |
| Alkalinity, laboratory |
1,800 |
3,000 |
3,260 |
3,440 |
4,760 |
101 |
-- |
| Sulfate |
100 |
170 |
190 |
210 |
310 |
104 |
21 |
| Chloride |
190 |
390 |
420 |
450 |
730 |
104 |
6.2 |
| Nitrite plus nitrate |
7.1 |
89 |
110 |
120 |
160 |
103 |
11c |
| Silica |
130 |
220 |
230 |
250 |
300 |
104 |
-- |
a Data are volume-weighted mean concentrations for 1984-95.
b Laboratory pH.
c Nitrate only.
Stream water in the Devils River is fairly concentrated and well buffered; specific conductance ranged from 250 to 460 mS/cm, and alkalinity was between 1,800 and 4,760 meq/L. The major cations in stream water were calcium and magnesium, and bicarbonate was the predominant anion. The predominance of these solutes in stream water is attributed to the weathering of carbonate minerals in the underlying limestone and dolomite bedrock. The median
 |
The solute composition of stream water was further evaluated by analyzing correlations between solutes and stream discharge (table 47). Most solutes were poorly correlated with discharge, except for weak inverse correlations with magnesium (rho = -0.611) and sodium (rho = -0.554). The solutes also were poorly correlated with each other, except for weak positive correlations between magnesium and sodium (rho = 0.698) and calcium and nitrite plus nitrate (rho = 0.691). The weak correlations between discharge and the major solutes reflect the importance of ground-water discharge, which maintains relatively constant flow rates and stream-water compositions in the Devils River throughout the year.
Table 47. Spearman rank correlation coefficients (rho values) showing the relation among discharge, pH, and major dissolved constituents, Devils River, Texas, 1978-95
[Q, discharge; Ca, calcium; Mg, magnesium; Na, sodium; K, potassium; Alk, alkalinity; SO4, sulfate; Cl, chloride; N, nitrite plus nitrate; Si, silica]
|
|
Q |
pH |
Ca |
Mg |
Na |
K |
Alk |
SO4 |
Cl |
N |
| pH |
0.272 |
|
|
|
|
|
|
|
|
|
| Ca |
.390 |
0.324 |
|
|
|
|
|
|
|
|
| Mg |
-.611 |
-.124 |
-0.059 |
|
|
|
|
|
|
|
| Na |
-.554 |
.011 |
-.090 |
0.698 |
|
|
|
|
|
|
| K |
-.004 |
-.243 |
-.174 |
-.234 |
-0.183 |
|
|
|
|
|
| Alk |
.242 |
.005 |
.414 |
.070 |
.052 |
-0.195 |
|
|
|
|
| Cl |
.194 |
-.052 |
.205 |
.145 |
.002 |
-.124 |
0.138 |
|
|
|
| SO4 |
-.241 |
-.312 |
.115 |
.212 |
.134 |
.213 |
.092 |
0.098 |
|
|
| N |
.263 |
.036 |
.691 |
.051 |
-.091 |
-.083 |
.349 |
.230 |
0.189 |
|
| Si |
.089 |
.163 |
-.421 |
-.159 |
-.058 |
.028 |
-.345 |
-.416 |
-.060 |
-0.379 |
 |
Results of the seasonal Kendall test for trends in discharge and major dissolved constituents are listed in table 48. Statistically significant trends were detected in the unadjusted calcium, sulfate, and nitrite-plus-nitrate concentrations at the 0.01 probability level. Trend results for the flow-adjusted sulfate and nitrite-plus-nitrate concentrations were similar to those for the unadjusted concentrations. The trend in flow-adjusted calcium concentrations was not statistically significant; however, the trend in sodium became significant after correcting for flow. The LOWESS curves in figure 25 show slightly different trend patterns for sulfate and nitrite plus nitrate. The downward trend in sulfate was largely driven by high concentrations at the beginning of the period of record and low concentrations at the end. Nitrite-plus-nitrate concentrations declined in the early part of the period of record, then remained fairly constant after 1984. The cause of trends in stream chemistry at the Devils River Station is not known. Lynch and others (1995) found no statistically significant trends in precipitation chemistry at the Sonora NADP station from 1980-92, indicating that changes in atmospheric deposition probably were not an important factor. Land-use changes in the basin also have been minor, although the effect of human activities in the northern part of the basin is unknown. Method-related factors are another possible cause of stream-water trends, particularly for sulfate. As discussed previously, sulfate concentrations at the beginning and end of the period of record probably were biased by several changes in the analytical method for sulfate that occurred over the period of record.
Table 48. Results of the seasonal Kendall test for trends in discharge and unadjusted and flow-adjusted pH and major dissolved constituents, Devils River, Texas, January 1978 through August 1995
[Trends in units of microequivalents per liter per year, except discharge in cubic meters per second per year, pH in standard units per year, and silica in micromoles per liter per year; inst., instantaneous; <, less than; --, not calculated]
|
Parameter |
Unadjusted |
Flow adjusted |
||
|
Trend |
p-value |
Trend |
p-value |
|
| Discharge, inst. |
0.11 |
0.129 |
-- |
-- |
| pH, field |
<.01 |
.838 |
(a) |
-- |
| Calcium |
12.6 |
.002 |
7.4 |
0.014 |
| Magnesium |
<.1 |
.324 |
1.6 |
.174 |
| Sodium |
.3 |
.475 |
1.0 |
.004 |
| Potassium |
<.1 |
.082 |
-.2 |
.014 |
| Alkalinity, laboratory |
3.8 |
.594 |
1.3 |
.999 |
| Sulfate |
-2.1 |
.000 |
-1.8 |
.001 |
| Chloride |
<.1 |
.808 |
(a) |
-- |
| Nitrite plus nitrate |
-1.2 |
.004 |
-1.7 |
.000 |
| Silica |
<.1 |
.396 |
(a) |
-- |
a Flow model not significant at a = 0.10.
Synoptic Water-Quality Data
Results of the surface-water synoptic sampling in the Devils River Basin on June 10 and 11, 1992, are listed in table 49, and the locations of sampling sites are shown in figure 24. During the sampling period, discharge at the gaging station was around 16 m³/s compared to the median daily discharge of 8.7 m³/s for June, indicating that the basin was sampled during above-normal flow conditions for that time of year. The solute concentrations measured at site 1 during the synoptic sampling were generally between the first- and third-quartile concentrations reported for the HBN station during the entire period of record (table 46). Stream chemistry did not vary markedly among the sampling sites, which was not unexpected considering the uniform geology of the basin and the large percentage of streamflow derived from ground water. For example, calcium ranged from 2,500 meq/L at an upstream site on the main channel (site 5) to 3,800 meq/L at the Jose Maria spring near Dolan Creek (site 3). A similar range of concentrations was measured for alkalinity, which ranged from 3,420 meq/L at site 1 to 4,680 meq/L at site 3. Comparison of samples along the main channel (sites 1, 2, 4, and 5) showed no substantial changes in chemistry along the transect, except for a slight decrease in magnesium, sodium, and chloride concentrations in the downstream direction. As was observed in the historical data records, fairly high concentrations of nitrate were measured at all the sampling sites (range 53 to 160 meq/L). Although no anthropogenic sources of nitrogen could be identified in the basin, the sample collected at site 3 at the mouth of a large spring indicates that ground water is the primary source of nitrogen in stream water at the gaging station.
Table 49. Physical properties and major dissolved constituents from surface-water sampling sites in the Devils River Basin, Texas, collected June 10-11, 1992
[Site locations shown in fig. 24; Q, discharge in cubic meters per second; SC, specific conductance in microsiemens per centimeter at 25 degrees Celsius; pH in standard units; Ca, calcium; Mg, magnesium; Na, sodium; K, potassium; Alk, alkalinity; SO4, sulfate; Cl, chloride; NO3, nitrate; Si, silica; concentrations in microequivalents per liter, except silica in micromoles per liter; --, not reported]
|
Site |
Station number |
Q |
SC |
pH |
Ca |
Mg |
Na |
K |
Alk |
SO4 |
Cl |
NO3 |
Si |
|
1 |
8449400 |
16 |
390 |
8.2 |
2,750 |
1,040 |
350 |
36 |
3,420 |
180 |
510 |
86 |
250 |
|
2 |
295341100594100 |
-- |
430 |
8.1 |
3,000 |
1,040 |
400 |
38 |
3,700 |
160 |
560 |
110 |
270 |
|
3 |
295543100591600 |
-- |
520 |
7.5 |
3,800 |
1,200 |
410 |
38 |
4,680 |
190 |
650 |
160 |
250 |
|
4 |
295755101085000 |
-- |
490 |
8.0 |
3,550 |
1,120 |
400 |
41 |
4,140 |
210 |
560 |
110 |
270 |
|
5 |
300824101071100 |
-- |
430 |
8.1 |
2,500 |
1,360 |
480 |
51 |
3,640 |
400 |
680 |
53 |
370 |
References Cited
Bailey, R.G., Avers, P.E., King, T., and McNab, W.H., eds., 1994, Ecoregions and subregions of the United States with supplementary table of map unit descriptions: Washington, D.C., U.S. Department of Agriculture Forest Service, scale 1:7,500,000(also at URL http://www.fs.fed.us/land/ecosysmgmt/ecoreg1_home.html, accessed 1998).
Barker, R.A., Bush, P.W., and Baker, E.T., Jr., 1994, Geologic history and hydrogeologic setting of the Edwards-Trinity aquifer system, west-central Texas: U.S. Geological Survey Water-Resources Investigations Report 94-4039, 51 p.
Barnes, V.E., 1981, Geologic atlas of Texas, Sonora sheet: The University of Texas at Austin, Bureau of Economic Geology, scale 1:250,000.
Fishman, M.J., Raese, J.W., Gerlitz, C.N., and Husband, R.A., 1994, U.S. Geological Survey approved inorganic and organic methods for the analysis of water and fluvial sediment, 1954-94: U.S. Geological Survey Open-File Report 94-351, 55 p.
Golden, M.L., Gabriel, W.J., and Stevens, J.W., 1982, Soil survey of Val Verde County, Texas: U.S. Department of Agriculture Soil Conservation Service, 138 p.
International Boundary and Water Commission, 1995, Flow of the Rio Grande and tributaries and related data: International Boundary and Water Commission Water Bulletin 65, 129 p.
Lynch, J.A., Grimm, J.W., and Bowersox, V.C., 1995, Trends in precipitation chemistry in the United States-A national perspective, 1980-1992:Atmospheric Environment, v. 29, no. 11, p. 1231-1246.
Schertz, T.L., Wells, F.C., and Ohe, D.J., 1994, Sources of trends in water-quality data for selected streams in Texas, 1975-89 water years: U.S. Geological Survey Water-Resources Investigations Report 94-4213, 49 p.
Texas Water Commission, 1992, Regional assessment of water quality in the Rio Grande Basin: Austin, Texas Water Commission, Standards and Assessments Division, variously paged.
Appendix A. List of Map References
a. U.S. Geological Survey topographic maps:
- Big Lake, Texas (1:100,000), 1985
- Camp Wood, Texas (1:100,000), 1985
- Comstock, Texas (1:100,000), 1985, gaging station on this quadrangle
- Devils Draw, Texas (1:100,000), 1985
- Ozona, Texas (1:100,000), 1985
- Rocksprings, Texas (1:100,000), 1985
- San Angelo, Texas (1:100,000), 1985
- Sonora, Texas (1:100,000), 1985
- Del Rio, Texas (1:250,000), 1969
- Sonora, Texas (1:250,000), 1978
b. Geologic maps:
- Barnes, V.E., 1977, Geologic atlas of Texas, Del Rio sheet: The University of Texas at Austin, Bureau of Economic Geology, scale 1:250,000.
- Barnes, V.E., 1981, Geologic atlas of Texas, Sonora sheet: The University of Texas at Austin, Bureau of Economic Geology, scale 1:250,000.
- Freeman, V.L., 1965, Geologic map of the Barkers Crossing quadrangle, Val Verde County, Texas: U.S. Geological Survey Miscellaneous Geologic Investigations Map I-440, scale 1:62,500.
- Sharps, J.A., and Freeman, V.L., 1965, Geologic map of the Mouth of Pecos and Feely quadrangles, Val Verde County, Texas: U.S. Geological Survey Miscellaneous Geologic Investigations Map I-434, scale 1:62,500.
c. Soil surveys:
- Golden, M.L., Gabriel, W.J., and Stevens, J.W., 1982, Soil survey of Val Verde County, Texas: U.S. Department of Agriculture Soil Conservation Service, 138 p.
- Wiedenfeld, C.C., and McAndrew, J.D., 1968, Soil survey of Sutton County, Texas: U.S. Department of Agriculture Soil Conservation Service, 33 p.
d. Miscellaneous maps:
- U.S. Geological Survey, 1985, Land-use series, Sonora, Texas: U.S. Geological Survey Open-File Report 85- 65, scale 1:250,000.
Appendix B. NWIS Site-Identification Numbers
Table B-1. NWIS site-identification numbers and site names for water-quality sampling sites.
|
Site |
Identification Number |
Site Name |
|
1 |
08449400 |
DEVILS R AT PAFFORD CROSSING NR COMSTOCK TEXAS |
|
2 |
295341100594100 |
DEVILS R AB DOLAN FALLS NR COMSTOCK TEXAS |
|
3 |
295543100591600 |
JOSE MARIA SPRING NR COMSTOCK TEXAS |
|
4 |
295755101085000 |
DEVILS R AT BAKER CROSSING NR COMSTOCK TEXAS |
|
5 |
300824101071100 |
DEVILS R AT JUNO TEXAS |