
Hydrologic Benchmark Network Stations in the Midwestern U.S. 1963-95 (USGS Circular 1173-B)
|
|
|
|
|
South Fork Rocky Creek near Briggs, Texas (Station 08103900)
To download a printer friendly PDF version of this information click here.
This report details one of the approximately 50 stations in the Hydrologic Benchmark Network (HBN) described in the four-volume U.S. Geological Survey Circular 1173. The suggested citation for the information on this page is:
|
Mast, M.A., and Turk, J.T., 1999, Environmental characteristics and water quality of Hydrologic Benchmark Network stations in the Midwestern United States, 1963-95: U.S. Geological Survey Circular 1173-B, 130 p. |
All of the tables and figures are numbered as they appear in each circular. Use the navigation bar above to view the abstract, introduction and methods for the entire circular, as well as a map and list of all of the HBN sites. Use the table of contents below to view the information on this particular station.
|
Table of Contents |
| 1. Site Characteristics and Land Use |
| 2. Historical Water Quality Data and Time-Series Trends |
| 3. Synoptic Water Quality Data |
Site Characteristics and Land Use
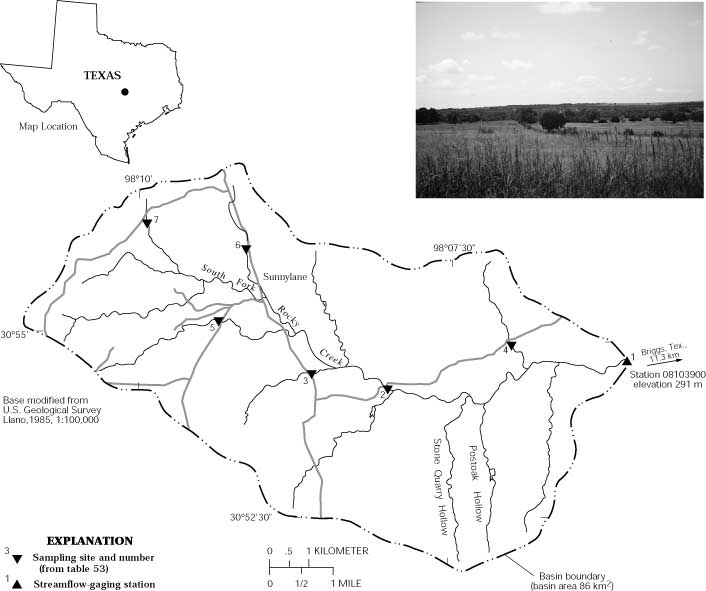
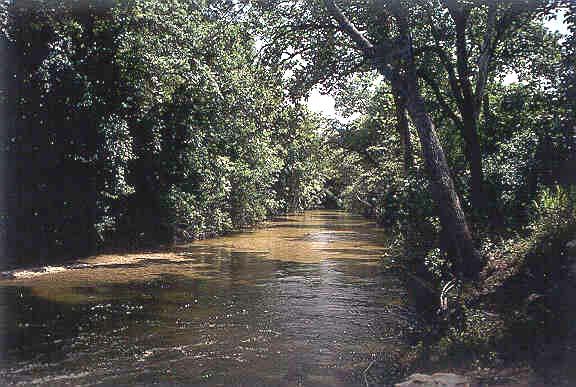
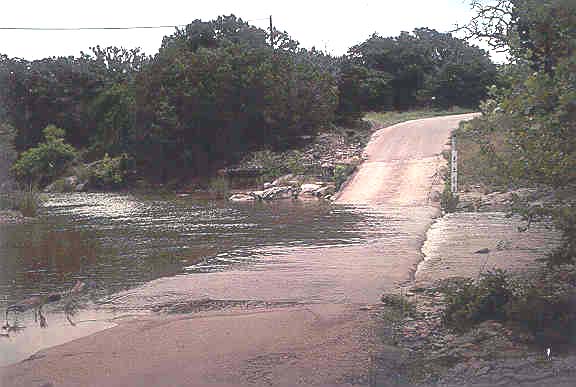
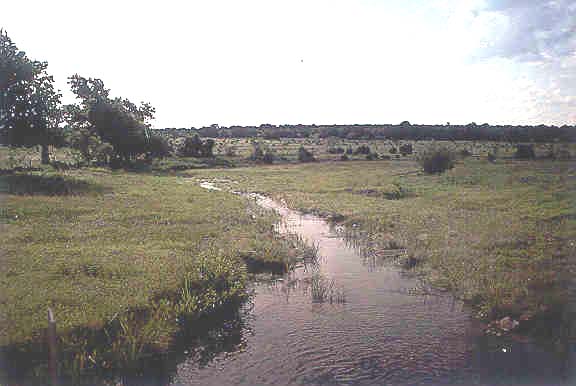
The South Fork Rocky Creek HBN Basin is in the Great Plains physiographic province in south-central Texas (Figure 26. Map showing study area in the South Fork Rocky Creek Basin and photograph of the landscape of the basin). The 86-km² basin ranges in elevation from 291 to 435 m and drains a hilly topography that has a stairstepped or benched appearance. The USGS gaging station is located 11.3 km west of the town of Briggs, Tex., at latitude 30×54'41'' and longitude 98×02'12''. South Fork Rocky Creek flows east into the San Gabriel River, a tributary of the Colorado River, and has a channel length of about 18.8 km upstream from the gaging station and an average stream gradient of 5.9 m/km. Mean monthly discharge at the gaging station ranged from 0.06 m³/s in August to 0.66 m³/s in May, and average annual runoff was 11 cm from 1963 through 1995 (Gandara and others, 1996). The main channel is ephemeral, and periods of no flow occur most years during August, September, and October. The climate is humid, subtropical with long, hot summers and short, mild winters. Precipitation averages 75 cm annually and is greatest in May and September (National Climatic Data Center, 1997). Potential evaporation is about twice the precipitation from May to October (Bailey and others, 1994). Average monthly air temperatures range from 8.4×C in January to 28.2×C in July.
 |
The South Fork Rocky Creek Basin is in the Southwest Plateau ecoregion, which is characterized by arid grasslands in which shrubs and low trees grow singly or in bunches (Bailey and others, 1994). Native vegetation includes little bluestem, sideoats grama, and tall grama with scattered groves of live oak and Texas oak growing along the stream channels. Most soils in the basin are classified as Alfisols and are mapped in the Bracket series (Dittemore and Allison, 1979). These soils are shallow loamy soils on low rounded hills with exposed ledges of limestone and marl. A typical profile has a surface layer of brown clay loam that is 10 cm thick overlying a subsoil of yellowish-brown clay loam that extends to a depth of 30 cm.
Bedrock in the basin consists of sedimentary rocks of Cretaceous age that include the Glen Rose Limestone at lower elevations in the basin and the Paluxy Sand and Walnut Formation along the basin divide (Texas Geological Survey, 1981). The Glen Rose Limestone is characterized by alternating beds of limestone, dolomite, and marl that weather unevenly to form the characteristic stairstepped topography of the area.
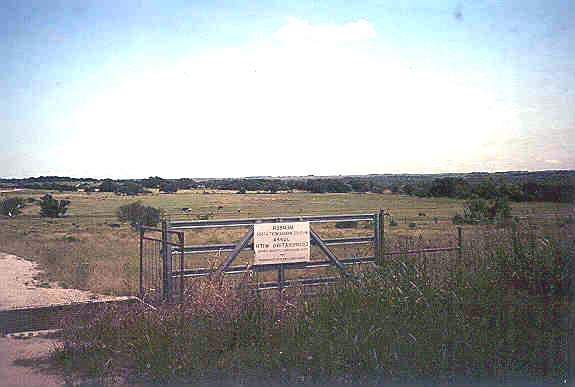
South Fork Rocky Creek drains the northeastern part of Burnet County in Texas, and land ownership is more than 98 percent private. Several kilometers of paved and gravel roads cross the basin, but access to streams is limited to public rights-of-way at road crossings. The basin is sparsely populated, and the major land-use activity is cattle ranching. Land cover is primarily native rangeland with less than 5 percent crop-land, much of which has been revegetated with pasture grasses, such as coastal bermuda grass and Kleingrass, over the past 10 years (R.K. Ellis, U.S. Department of Agriculture Natural Resources Conservation Service, written commun., 1996). No major changes in land-use activities have occurred during the past 30 years, except for a slight decrease in cropland and construction of a few rural residential structures (R.K. Ellis, written commun., 1996). Several gravel pits, ranch houses, and stock ponds are scattered throughout the basin.
Historical Water-Quality Data and Time-Series Trends
The data set for the South Fork Rocky Creek HBN Station analyzed for this report includes 113 water-quality samples that were collected from January 1968 through June 1995. Sampling was scheduled for bimonthly from 1968 through 1982 and quarterly from 1983 through 1995, although fewer samples were collected in most years because of periods of no flow. Water-quality samples in the early part of the period of record were analyzed at a USGS laboratory in Austin, Tex., that operated until 1973 (Durum, 1978). After establishment of the central laboratory system, samples were analyzed at a laboratory in Salt Lake City, Utah, from 1973 through 1975 and at the NWQL in Arvada, Colo., from 1976 through 1995. Daily discharge records at the South Fork Rocky Creek (station 08103900) are available beginning in April 1963.
 |
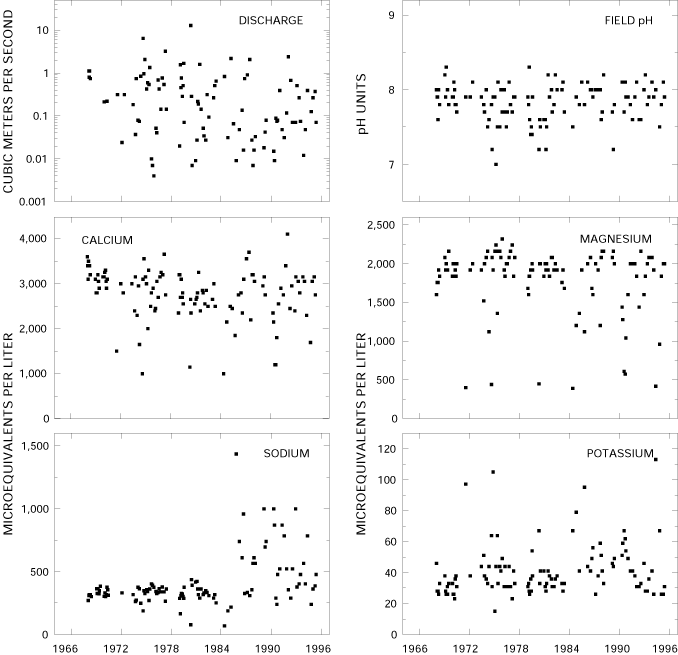
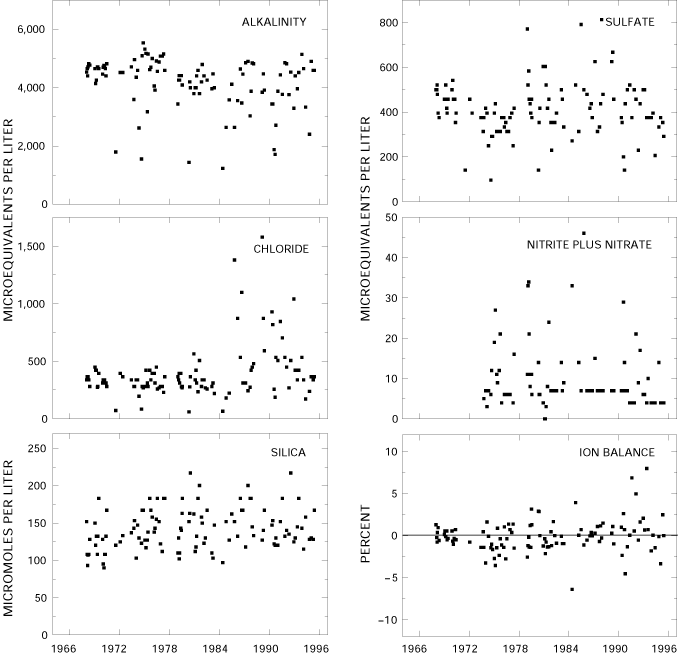
Calculated ion balances for 106 samples with complete major-ion analyses are shown in Figures 27a and 27b. Temporal variation of discharge, field pH, major dissolved constituents, and ion balance at South Fork Rocky Creek, Texas. Ion balances ranged from -6.4 to 8.0 percent, and more than 90 percent of samples had values within the ±5 percent range, indicating that the analytical measurements are of high quality. The average ion balance was -0.1 percent, indicating that unmeasured constituents, such as organic anions, do not contribute substantially to the ionic composition of stream water at this station. Time-series plots of the major dissolved constituents were inspected for evidence of method-related effects (fig. 27). The most notable patterns are for sodium and chloride, which had elevated concentrations in samples that were collected after 1985. A more detailed analysis of the data revealed that samples with elevated sodium concentrations also had elevated chloride concentrations, indicating that analytical bias probably was not the cause. It also is unlikely that samples were contaminated during collection and processing procedures in the field (Frank Wells, U.S. Geological Survey, written commun., 1998), indicating that the elevated concentrations probably were caused by environmental change in the basin rather than a method-related factor.
 |
Median concentrations and ranges of major constituents in stream water at the South Fork Rocky Creek Station and VWM concentrations in wet-only deposition measured at the L.B.J. National Grasslands NADP Station are listed in table 50. Precipitation chemistry at the NADP station, which is located about 275 km north of the HBN station, is dilute and slightly acidic with a VWM pH of 5.1 for 2 years of record. The predominant cations in precipitation were calcium and ammonium, which contributed 33 and 31 percent of the total cation charge, respectively. Sulfate and nitrate were the predominant anions in precipitation and accounted for 53 and 34 percent of the total anion charge, respectively. Stream water in South Fork Rocky Creek is fairly concentrated and well buffered; specific conductance ranged from 140 to 570 mS/cm, and alkalinity was between 1,240 and 5,540 meq/L. The major cations in stream water were calcium and magnesium, and bicarbonate was the predominant anion. The predominance of these solutes in stream water is attributed to the weathering of carbonate minerals in the limestone and dolomite bedrock. The median concentration of chloride in stream water was 340 meq/L, which is considerably higher than the VWM concentration of 5.5 meq/L in precipitation. This large difference in concentration indicates that most stream-water chloride is derived from sources in the basin, such as weathering of the sedimentary rocks, discharge from rural septic systems, runoff from agricultural land, or oil-field activities. The high concentrations of sulfate in stream water (median of 400 meq/L) compared to precipitation (23 meq/L) also indicate that most sulfate is derived from internal sources, the most likely being dissolution of sulfate- bearing minerals in the bedrock. The median concentrations of inorganic nitrogen species in stream water were less than the VWM concentrations in precipitation, indicating that, overall, there was a net loss of nitrogen in the basin. However, about 25 percent of stream samples had nitrite-plus-nitrate concentrations greater than the VWM concentration in precipitation, which may indicate that upstream agricultural activities affect nutrient concentrations at the HBN station during some times of the year.
Table 50. Minimum, first quartile, median, third quartile, and maximum values of physical properties and major dissolved constituents measured in water-quality samples from the South Fork Rocky Creek, Texas, January 1968 through June 1995, and volume-weighted mean concentrations in wet precipitation collected at the L.B.J. National Grasslands Station, Texas
[Concentrations in units of microequivalents per liter, discharge in cubic meters per second, specific conductance in microsiemens per centimeter at 25 degrees Celsius, and silica in micromoles per liter; n, number of stream samples; VWM, volume-weighted mean; inst., instantaneous; spec. cond., specific conductance; <, less than; --, not reported]
|
Parameter |
Stream Water |
Precipitation VWMa |
|||||
|
Minimum |
First quartile |
Median |
Third quartile |
Maximum |
n |
||
| Discharge, inst. |
0.0003 |
0.043 |
0.18 |
0.65 |
13 |
101 |
-- |
| Spec. cond., field |
140 |
450 |
490 |
510 |
570 |
112 |
9.2 |
| pH, field |
7.0 |
7.7 |
7.9 |
8.0 |
8.3 |
113 |
5.1b |
| Calcium |
1,000 |
2,500 |
2,850 |
3,150 |
4,100 |
113 |
16 |
| Magnesium |
400 |
1,810 |
1,980 |
2,060 |
2,320 |
113 |
2.3 |
| Sodium |
70 |
310 |
340 |
400 |
1440 |
110 |
5.6 |
| Potassium |
15 |
31 |
36 |
44 |
110 |
111 |
.9 |
| Ammonium |
<.7 |
<.7 |
<1.1 |
3.9 |
11 |
55 |
15 |
| Alkalinity, laboratory |
1,240 |
3,880 |
4,420 |
4,720 |
5,540 |
112 |
-- |
| Sulfate |
96 |
330 |
400 |
460 |
810 |
113 |
23 |
| Chloride |
62 |
280 |
340 |
420 |
1,580 |
112 |
5.5 |
| Nitrite plus nitrate |
<.7 |
5.7 |
7.1 |
12 |
46 |
85 |
15c |
| Silica |
90 |
120 |
140 |
160 |
220 |
113 |
-- |
a Data are volume-weighted mean concentrations for 1988-89.
b Laboratory pH.
c Nitrate only.
The solute composition of stream water was further evaluated by analyzing correlations between solutes and stream discharge (table 51). Most solutes were poorly correlated with discharge, except for weak inverse correlations with sodium (rho = -0.591) and chloride (rho = -0.557). Among the solutes, the strongest correlations were found between calcium and alkalinity (rho = 0.842) and sodium and chloride (rho = 0.832). The lack of correlation between solutes and stream discharge may reflect the high carbonate content of soils and bedrock in the basin, which produces soil and ground water of similar composition. The correlations among solutes are consistent with the assumption that carbonate minerals and salts are the major sources of solutes in stream water.
Table 51. Spearman rank correlation coefficients (rho values) showing the relation among discharge, pH, and major dissolved constituents, South Fork Rocky Creek, Texas, 1968-95
[Q, discharge; Ca, calcium; Mg, magnesium; Na, sodium; K, potassium; Alk, alkalinity; SO4, sulfate; Cl, chloride; N, nitrite plus nitrate; Si, silica]
|
|
Q |
pH |
Ca |
Mg |
Na |
K |
Alk |
SO4 |
Cl |
| pH |
-0.003 |
|
|
|
|
|
|
|
|
| Ca |
.219 |
0.175 |
|
|
|
|
|
|
|
| Mg |
-.262 |
-.064 |
0.649 |
|
|
|
|
|
|
| Na |
-.591 |
.178 |
.091 |
0.374 |
|
|
|
|
|
| K |
-.266 |
-.028 |
-.529 |
-.375 |
0.195 |
|
|
|
|
| Alk |
.170 |
.174 |
.842 |
.673 |
.085 |
-0.617 |
|
|
|
| SO4 |
-.211 |
-.004 |
.317 |
.286 |
.304 |
-.129 |
0.178 |
|
|
| Cl |
-.557 |
.125 |
.179 |
.344 |
.832 |
.068 |
.117 |
0.554 |
|
| Si |
-.218 |
-.039 |
.012 |
.259 |
.282 |
.325 |
.082 |
-.209 |
0.118 |
Results of the seasonal Kendall test for trends in discharge and major dissolved constituents are listed in table 52. The only statistically significant trend was detected in the flow-adjusted sodium concentrations at the 0.01 probability level. Other than sodium, the trend analysis indicates that stream chemistry at this station has been fairly stable during the period of record, which is consistent with the sparse population of the basin and minimal change in land use during the period of record. In addition, there have been no detectable changes in atmospheric deposition since at least 1982 (Lynch and others, 1995). The upward trend in flow-adjusted sodium concentrations is largely driven by the elevated sodium concentrations observed beginning in 1985. As discussed previously, the elevated sodium and chloride concentrations at this station probably were caused by an environmental change in the basin rather than method-related factors. One possible explanation for the increase in stream-water sodium concentrations is leakage of brine water associated with oil-well activity. Although drilling activity in the basin in the mid-1980's could not be confirmed, contamination of surface waters by oil field brines is a common water-quality problem in many areas of Texas (Frank Wells, U.S. Geological Survey, written commun., 1998).
Table 52. Results of the seasonal Kendall test for trends in discharge and unadjusted and flow-adjusted pH and major dissolved constituents, South Fork Rocky Creek, Texas, January 1965 through June 1995
[Trends in units of microequivalents per liter per year, except discharge in cubic meters per second per year, pH in standard units per year, and silica in micromoles per liter per year; inst., instantaneous; <, less than; --, not calculated]
|
Parameter |
Unadjusted |
Flow adjusted |
||
|
Trend |
p-value |
Trend |
p-value |
|
| Discharge, inst. |
<0.01 |
0.916 |
-- |
-- |
| pH, field |
<.01 |
.247 |
(a) |
-- |
| Calcium |
<.1 |
.842 |
(a) |
-- |
| Magnesium |
-3.9 |
.279 |
-2.2 |
0.490 |
| Sodium |
3.7 |
.040 |
7.7 |
.008 |
| Potassium |
<.1 |
.585 |
-.1 |
.455 |
| Alkalinity, laboratory |
-19.9 |
.103 |
-14.9 |
.173 |
| Sulfate |
<.1 |
.785 |
1.2 |
.513 |
| Chloride |
3.0 |
.283 |
8.0 |
.046 |
| Nitrite plus nitrate |
-.3b |
.266 |
-- |
-- |
| Silica |
.1 |
.340 |
.5 |
.239 |
a Flow model not significant at a = -0.10.
b Trend test calculated for 1974-95 using a trend test for censored data.
Synoptic Water-Quality Data
 |
Results of the surface-water synoptic sampling in the South Fork Rocky Creek Basin on June 8, 1992, are listed in table 53, and the locations of the sampling sites are shown in figure 26. During the sampling period, discharge at the gaging station was about 2.0 m³/s compared to the median daily discharge of 0.3 m³/s for May and 0.1 m³/s for June (Lawrence, 1987), indicating that the basin was sampled during higher than normal flow conditions for that time of year. The solute concentrations measured at site 1 during the synoptic sampling were generally between the first- and third-quartile concentrations reported for the HBN station during the entire period of record (table 50). The tributary streams were similar in composition to stream water collected at the gaging station (site 1); calcium and magnesium were the predominant cations, and bicarbonate was the predominant anion. Ion balances for the synoptic samples ranged from -3.4 to 2.5 percent, indicating that unmeasured constituents, such as organic anions, did not seem to be an important component of stream water during the sampling period. The results presented in table 53 show relatively little variation in the stream chemistry among the sampling sites, particularly for the weathering-derived solutes. For example, calcium ranged from 3,500 to 5,000 meq/L, magnesium ranged from 1,120 to 2,080 meq/L, and alkalinity ranged from 4,880 to 5,740 meq/L. This similarity in stream chemistry is probably largely due to the high carbonate content of soils and bedrock in the basin. The remaining solutes: sodium, potassium, sulfate, chloride, nitrate, and silica, did not vary markedly among the tributaries, except for nitrate, which was elevated at site 7. This tributary was sampled just downstream from a stock pond, indicating that livestock waste was probably the source of stream-water nitrate at this site.
Table 53. Physical properties and major dissolved constituents from surface-water sampling sites in the South Fork Rocky Creek Basin, Texas, collected June 8, 1992
[Site locations shown in fig. 26; Q, discharge in cubic meters per second; SC, specific conductance in microsiemens per centimeter at 25 degrees Celsius; pH in standard units; Ca, calcium; Mg, magnesium; Na, sodium; K, potassium; Alk, alkalinity; SO4, sulfate; Cl, chloride; NO3, nitrate; Si, silica; concentrations in microequivalents per liter, except silica in micromoles per liter; --, not reported; criteria used in selection of sampling sites: MT = major tributary, LU = land use]
|
Site |
Station number |
Q |
SC |
pH |
Ca |
Mg |
Na |
K |
Alk |
SO4 |
Cl |
NO3 |
Si |
Criteria |
Remarks |
|
1 |
8103900 |
2.0 |
560 |
8.2 |
3,700 |
1,920 |
310 |
31 |
5,200 |
270 |
450 |
15 |
170 |
-- |
Gaging station |
|
2 |
305420098060200 |
.89 |
540 |
8.1 |
3,500 |
1,840 |
310 |
25 |
5,160 |
310 |
340 |
12 |
180 |
MT |
-- |
|
3 |
305431098071100 |
.12 |
540 |
8.1 |
3,550 |
2,080 |
280 |
33 |
5,260 |
230 |
260 |
1.4 |
180 |
LU |
Pasture land |
|
4 |
305459098040500 |
.094 |
510 |
8.3 |
3,500 |
1,840 |
230 |
25 |
5,400 |
330 |
260 |
3.7 |
140 |
LU |
Pasture land |
|
5 |
305509098084300 |
.094 |
530 |
8.0 |
4,300 |
1,120 |
340 |
20 |
4,880 |
290 |
310 |
19 |
180 |
LU |
Pasture land |
|
6 |
305611098081600 |
.042 |
560 |
8.3 |
3,650 |
1,680 |
410 |
16 |
5,480 |
230 |
480 |
2.1 |
160 |
LU |
Pasture land |
|
7 |
305631098095800 |
-- |
630 |
7.9 |
5,000 |
1,120 |
330 |
12 |
5,740 |
210 |
540 |
230 |
250 |
LU |
Stock ponds |
References Cited
Bailey, R.G., Avers, P.E., King, T., and McNab, W.H., eds., 1994, Ecoregions and subregions of the United States with supplementary table of map unit descriptions: Washington, D.C., U.S. Department of Agriculture Forest Service, scale 1:7,500,000(also at URL http://www.fs.fed.us/land/ecosysmgmt/ecoreg1_home.html, accessed 1998).
Dittemore, W.H., Jr., and Allison, J.E., 1979, Soil survey of Plano and Burnet Counties, Texas: U.S. Department of Agriculture Soil Conservation Service, 116 p.
Durum, W.H., 1978, Historical profile of quality of water laboratories and activities, 1879-1973: U.S. Geological Survey Open-File Report 78-432, 235 p.
Gandara, S.C., Gibbons, W.J., Andrews, F.L., Fisher, J.C., Hinds, B.A., and Jones, R.E., 1996, Water resources data, Texas, water year 1995-v. 2, San Jacinto River Basin, Brazos River Basin, San Bernard River Basin, and intervening coastal basins: U.S. Geological Survey Water-Data Report TX-95, 2, 373 p.
Lawrence, C.L., 1987, Streamflow characteristics at hydrologic bench-mark stations: U.S. Geological Survey Circular 941, 123 p.
Lynch, J.A., Grimm, J.W., and Bowersox, V.C., 1995, Trends in precipitation chemistry in the United States-A national perspective, 1980-1992:Atmospheric Environment, v. 29, no. 11, p. 1231-1246.
National Climatic Data Center, 1996, Summary of the day: Boulder, Colorado, EarthInfo Incorporated, CD-ROM.
Texas Geological Survey, 1981, Geologic atlas of Texas, Llano Sheet: The University of Texas at Austin, Bureau of Economic Geology, scale 1:250,000.
Appendix A. List of Map References
a. U.S. Geological Survey topographic maps:
- Bachelor Peak, Texas (1:24,000), 1967, gaging station on this quadrangle
- Joppa, Texas (1:24,000), 1967
- Lake Victor, Texas (1:24,000), 1967
- Llano, Texas (1:100,000), 1985
b. Geologic maps:
- Texas Geological Survey, 1981, Geologic atlas of Texas, Llano sheet: The University of Texas at Austin, Bureau of Economic Geology, scale 1:250,000.
c. Soil surveys:
- Dittemore, W.H., Jr., and Allison, J.E., 1979, Soil survey of Blanco and Burnet Counties, Texas: U.S. Department of Agriculture Soil Conservation Service, 116 p.
Appendix B. NWIS Site-Identification Numbers
NWIS site-identification numbers and site names for water-quality sampling sites.
|
Site |
Identification Number |
Site Name |
|
1 |
08103900 |
S FORK ROCKY CR NR BRIGGS TEXAS |
|
2 |
305420098060200 |
S FORK ROCKY CR AT MAIN RD NR BRIGGS TEXAS |
|
3 |
305431098071100 |
FENCE CR NR BRIGGS TEXAS |
|
4 |
305459098040500 |
OVER ROAD TRIB NR BRIGGS TEXAS |
|
5 |
305509098084300 |
GRAVEL PIT TRIB NR BRIGGS TEXAS |
|
6 |
305611098081600 |
SUNNYLANE CR NR BRIGGS TEXAS |
|
7 |
305631098095800 |
COUBLE CR NR BRIGGS TEXAS |