
Hydrologic Benchmark Network Stations in the Midwestern U.S. 1963-95 (USGS Circular 1173-B)
|
|
|
|
|
Popple River near Fence, Wisconsin (Station 04063700)
To download a printer friendly PDF version of this information click here.
This report details one of the approximately 50 stations in the Hydrologic Benchmark Network (HBN) described in the four-volume U.S. Geological Survey Circular 1173. The suggested citation for the information on this page is:
|
Mast, M.A., and Turk, J.T., 1999, Environmental characteristics and water quality of Hydrologic Benchmark Network stations in the Midwestern United States, 1963-95: U.S. Geological Survey Circular 1173-B, 130 p. |
All of the tables and figures are numbered as they appear in each circular. Use the navigation bar above to view the abstract, introduction and methods for the entire circular, as well as a map and list of all of the HBN sites. Use the table of contents below to view the information on this particular station.
|
Table of Contents |
| 1. Site Characteristics and Land Use |
| 2. Historical Water Quality Data and Time-Series Trends |
| 3. Synoptic Water Quality Data |
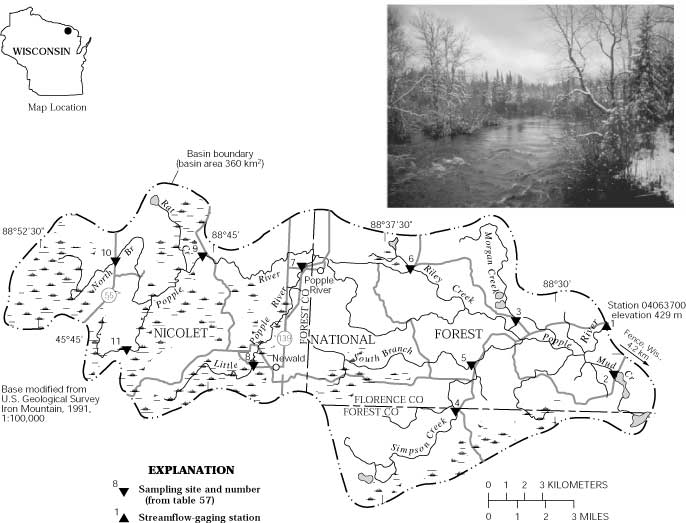
The Popple River HBN Basin is located in the Superior Upland physiographic province in the northeast corner of Wisconsin (Figure 28. Map showing study area in the Popple River Basin and photograph of the main river channel). The 360-km² basin ranges in elevation from 429 to 658 m and drains a hummocky landscape covered by forests, lakes, and wetlands (Oakes and others, 1973). The USGS gaging station is located 4.2 km northwest of Fence, Wis., at latitude 45×45"1'49'' and longitude 88×27'47''. The Popple River flows east into the Pine River, a tributary of the Menominee River, and has a channel length of 52 km upstream from the gaging station and an average stream gradient of 1.35 m/km. The river is slow moving along much of its reach, although bedrock outcrops form numerous riffles and small waterfalls (Sullivan and others, 1995). The main river channel is perennial, and mean monthly discharge varies from 1.3 m³/s under ice cover in January and February to 8.6 m³/s during snowmelt in April. Average annual runoff from the basin was 29 cm from 1964 through 1995 (Holmstrom and others, 1996). The climate is classified as humid continental, with short summers and long, snowy winters. Average monthly air temperatures range from -17.1×C in January to 20.9×C in July (National Climatic Data Center, 1997). Precipitation averages 78 cm annually with September being the wettest month (10.7 cm) and February the driest (2.3 cm). Average annual snowfall is 138 cm, and the ground generally remains snow covered from mid-November to mid-April (Oakes and others, 1973).
The Popple River Basin is in the Laurentian Mixed Forest ecoregion, which lies between the boreal forest and the broadleaf deciduous forest zones (Bailey and others, 1994). Northern hardwoods, conifers, and aspen stands cover about 57 percent of the basin in areas where the water table is generally more than 1 m below the ground surface. Common hardwood species include sugar maple, red oak, white ash, basswood, and yellow birch; the conifer species are hemlock, white spruce, balsam fir, and white pine. Aspen is a common post-fire species that tends to grow on sandier soils than the soils dominated by hardwoods. Swamps and open bogs cover about 30 percent of the basin. In these areas, the water table is at or near the surface most of the year, and vegetation is dominated by black spruce, white cedar, black ash, tamarack, grass, sedge, and moss. Soils in the uplands are classified as Spodosols and are mapped in the Stambaugh and Goodman series (Hole and others, 1962). These series include well-drained acidic soils that range from 60 to 100 cm in depth. The Stambaugh soils are developed in loamy and sandy fluvial deposits, whereas the Goodman soils are developed in loamy glacial till. A typical soil profile has a thin organic horizon overlying a dark brown to reddish-brown layer of silt loam overlying a subsoil of coarse sand and gravel (Stambaugh) or loamy till (Goodman). The clay mineralogy of the loamy soils is dominated by illite and kaolinite with minor amounts of vermiculite and smectite (Simpkins and others, 1987). Wetland soils are scattered throughout the basin and consist largely of peat and muck that is typically a few meters thick.
The basin lies in the southern part of the Canadian Shield, which consists of crystalline rocks of Precambrian age covered by Pleistocene glacial deposits. Most of the bedrock consists of light-gray or pinkish-gray, medium-grained granite and granitoid gneiss that is composed of plagioclase, quartz, potassium feldspar, and biotite (Sims, 1990; Sims and others, 1992). Along the southern boundary, a small area of the basin is underlain by the Quinnesec Formation of Proterozoic age, which consists of thick metagabbro sills and thin interbeds of biotite schist and quartzite (Sims and others, 1992). The bedrock surface is irregular and, consequently, is covered by an uneven layer of glacial deposits that range in thickness from 0 to 50 m (Clayton, 1986). The glacial deposits consist of reddish-brown till and fluvial sands and gravels deposited by glacial meltwater streams. Pebbles and cobbles in the till consist of 95 percent igneous and metamorphic rock fragments and 5 percent sedimentary fragments, primarily dolomite (Clayton, 1986). The till is slightly calcareous but is generally leached of carbonates to a depth of 1 m. The fluvial sediments are similar in composition to the till, except that carbonates are leached to greater depths (Clayton, 1986).
The Popple River drains parts of Florence and Forest Counties in Wisconsin and is in the boundaries of the Florence District of the Nicolet National Forest. Approximately 40 percent of land in the National Forest is privately owned (D. Olson, U.S. Department of Agriculture Forest Service, written commun., 1996). Land cover in the basin is 61.1 percent forest, 35.1 percent wetland, 3.0 percent agricultural, 0.6 percent lakes, and 0.1 percent residential (Sullivan and others, 1995). The major land-use activities on publicly owned lands are timber harvesting and recreation. About 30 km² of forest land in the basin have been harvested during the last 10 years by using a combination of thinning, selection, shelterwood, and clearcuts (D. Olsen, U.S. Department of Agriculture Forest Service, written commun., 1996). The Forest Service maintains an 18-unit campground on Morgan Lake. Privately owned lands are mostly forested and have some abandoned agricultural fields. The primary land use on private land is residential, including two small towns, Popple River (population 42) and Newald, and a number of seasonal homes and hunting cabins. More than 100 km of paved and dirt roads traverse the basin, including State Highways 55 and 139, which are plowed and salted in winter, and a railroad line that parallels State Highway 139. The section of the Popple River downstream from Morgan Creek has State designation as a wild river. The river generally is accessible by canoe downstream from State Highway 139 from late April to early June.
The data set for the Popple River HBN Station analyzed for this report includes 262 water-quality samples that were collected from October 1965 through September 1995. Sampling frequency was monthly from 1968 and 1982 and quarterly from 1983 through 1995. Additional samples were collected from March 1993 through May 1995 as part of the National Water-Quality Assessment Program in the Western Lake Michigan Drainages study unit (Sullivan and others, 1995). Water-quality samples in the early part of the record were analyzed at a USGS laboratory in Columbus, Ohio, that operated until 1973 (Durum, 1978). After establishment of the central laboratory system, samples were analyzed at a laboratory in Atlanta, Ga., from 1973 through 1985 and at the NWQL in Arvada, Colo., from 1986 through 1995. Daily discharge records are available for the Popple River (station 04063700) beginning in October 1963. Records of daily water temperature at the gaging station are available from March 1994 through December 1995.
Calculated ion balances for 256 samples with complete major-ion analyses are shown in Figures 29a and 29b. Temporal variation of discharge, field pH, major dissolved constituents, and ion balance at Popple River, Wisconsin. Ion balances ranged from -8.5 to 15 percent, and almost 90 percent of samples had values within the ±5 percent range, indicating that the analyses are of high quality. The average ion balance for all samples was 1.4 percent, and 65 percent of samples had positive ion balances, indicating that unmeasured constituents, such as organic anions, probably contributed to the ion balance of stream water at this station. Time-series plots of the major dissolved constituents were inspected for evidence of method-related effects (fig. 29). The most notable patterns are observed in the chloride and sulfate concentrations. For example, chloride concentrations had a high degree of scatter in the early part of the period of record, which was coincident with the period that samples were analyzed at the USGS laboratory in Columbus, Ohio (Durum, 1978). Sulfate had alternating periods of high and low concentrations that were not observed for the other major solutes. Sources of analytical bias in the early part of the period of record are difficult to confirm, although several different analytical methods were used for sulfate before 1985 (Fishman and others, 1994). The turbidimetric method, which was used at the NWQL between March 1986 and December 1989, often introduced a substantial positive bias in sulfate concentrations, particularly in dilute or colored waters (Office of Water Quality Technical Memorandum No. 90.04, Turbidimetric Sulfate Method, issued December 21, 1989, at URL http://water.usgs.gov/admin/memo/, accessed 1997). Ion chromatography replaced the turbidimetric method in 1990, which seems to correlate with the low sulfate concentrations measured at the end of the period of record.
Median concentrations and ranges of major constituents in stream water at the Popple River HBN Station and VWM concentrations in wet-only deposition measured at the Popple River NADP Station are listed in table 54. Precipitation chemistry at the NADP station, which is located about 6 km northeast of the HBN station, is dilute and slightly acidic with a VWM pH of 4.7 for 10 years of record. The predominant cations were hydrogen and ammonium, which each contributed 37 percent of the total cation charge. Sulfate and nitrate were the predominant anions and accounted for 56 and 39 percent of the total anion charge, respectively. The predominance of strong acid anions indicates that precipitation at the NADP station may be affected by anthropogenic emissions of sulfur and nitrogen compounds, which cause acid rain. The fairly high concentrations of ammonium at this NADP station may be linked to the high density of livestock in the Midwestern region of the country.
[Concentrations in units of microequivalents per liter, discharge in cubic meters per second, specific conductance in microsiemens per centimeter at 25 degrees Celsius, and silica in micromoles per liter; n, number of stream samples; VWM, volume-weighted mean; inst., instantaneous; spec. cond., specific conductance; <, less than; --, not reported]
|
Parameter |
Stream Water |
Precipitation VWMa |
|||||
|
Minimum |
First quartile |
Median |
Third quartile |
Maximum |
n |
||
| Discharge, inst. |
0.62 |
1.3 |
2.1 |
4.1 |
24 |
260 |
-- |
| Spec. cond., field |
25 |
120 |
170 |
210 |
330 |
261 |
14 |
| pH, field |
5.8 |
7.2 |
7.5 |
7.8 |
8.7 |
261 |
4.7b |
| Calcium |
280 |
700 |
950 |
1,200 |
1,500 |
261 |
9.1 |
| Magnesium |
200 |
540 |
760 |
960 |
1,280 |
261 |
2.4 |
| Sodium |
17 |
57 |
65 |
74 |
130 |
260 |
2.1 |
| Potassium |
5.1 |
15 |
20 |
23 |
69 |
260 |
.6 |
| Ammonium |
<.7 |
1.4 |
2.9 |
5.0 |
12 |
109 |
20 |
| Alkalinity, laboratory |
400 |
1,060 |
1,540 |
2,060 |
2,700 |
259 |
-- |
| Sulfate |
4.1 |
100 |
140 |
190 |
460 |
262 |
30 |
| Chloride |
<2.8 |
31 |
45 |
59 |
170 |
258 |
2.4 |
| Nitrite plus nitrate |
<.7 |
3.5 |
7.1 |
12 |
39 |
187 |
21c |
| Silica |
33 |
120 |
160 |
220 |
330 |
261 |
-- |
a Data are volume-weighted mean concentrations for 1986-95.
b Laboratory pH.
c Nitrate only.
Stream water in the Popple River is moderately concentrated and well buffered; specific conductance ranged from 25 to 330 mS/cm, and alkalinity was between 400 and 2,700 meq/L. Stream water at this station also has a tealike color owing to the leaching of tannins from the numerous wetlands in the basin (Sullivan and others, 1995). The major cations in stream water were calcium and magnesium, and bicarbonate was the predominant anion. The predominance of these solutes in stream water is attributed to the weathering of calcite and dolomite in the glacial deposits. The median concentration of chloride in stream water was 45 meq/L, which is considerably higher than the VWM concentration of 2.4 meq/L in precipitation. On the basis of the difference between annual precipitation and runoff, evapotranspiration can account for no more than a threefold increase in the chloride concentration of precipitation, indicating that most stream-water chloride is derived from sources other than precipitation. The most likely source of additional stream-water chloride is from deicing salts applied to roads in winter, although small amounts of chloride also might be contributed by septic systems in rural residential areas. The median concentration of sulfate in stream water was 140 meq/L compared to 30 meq/L in precipitation, which is slightly larger than would be expected from the effects of evapotranspiration. Assuming geologic sources are small, most of the additional stream-water sulfate probably is derived from dry deposition from the atmosphere. Baker (1991) estimated that dry deposition was about 27 percent of total sulfate deposition in the region, which seems to be consistent with sulfate concentrations in the stream. The low concentrations of nitrate and ammonium in stream water compared to precipitation indicate that atmospherically deposited nitrogen is strongly retained by soils and vegetation in the basin. The low stream-water nitrogen concentrations also indicate that rural residences in the basin do not seem to affect the nutrient composition of stream water at the HBN station.
The solute composition of stream water was further evaluated by analyzing correlations between solutes and stream discharge (table 55). The weathering-derived constituents, particularly calcium, magnesium, and alkalinity, had strong inverse correlations with discharge. These results are consistent with a hydrologic system where weathering-enriched base flow is diluted by water from shallow or surficial sources during periods of increased discharge, particularly spring snowmelt. Among the solutes, the strongest correlations were among calcium, magnesium, and alkalinity (0.971 < rho < 0.983), which is consistent with the weathering stoichiometry of carbonate minerals. In contrast, sulfate and chloride were weakly correlated with the other dissolved constituents, as well as discharge. The weak correlation between chloride and sodium (rho = 0.140) was somewhat unexpected because sodium also is a major component of deicing salts, indicating that some of the sodium from road salt may be exchanged for calcium and magnesium in the soils (Shanley, 1993). The poor correlations between sulfate and the carbonate solutes are consistent with the assumption that sulfate is derived primarily from atmospheric sources.
[Q, discharge; Ca, calcium; Mg, magnesium; Na, sodium; K, potassium; Alk, alkalinity; SO4, sulfate; Cl, chloride; N, nitrite plus nitrate; Si, silica]
|
|
Q |
pH |
Ca |
Mg |
Na |
K |
Alk |
SO4 |
Cl |
| pH |
-0.363 |
|
|
|
|
|
|
|
|
| Ca |
-.913 |
0.345 |
|
|
|
|
|
|
|
| Mg |
-.910 |
.314 |
0.982 |
|
|
|
|
|
|
| Na |
-.760 |
.198 |
.803 |
0.818 |
|
|
|
|
|
| K |
-.308 |
-.035 |
.338 |
.366 |
0.351 |
|
|
|
|
| Alk |
-.913 |
.353 |
.974 |
.972 |
.792 |
0.357 |
|
|
|
| SO4 |
-.338 |
-.008 |
.390 |
.437 |
.436 |
.412 |
0.356 |
|
|
| Cl |
.010 |
-.157 |
-.034 |
.011 |
.140 |
.186 |
-.045 |
0.359 |
|
| Si |
-.531 |
-.077 |
.629 |
.686 |
.570 |
.389 |
.651 |
.491 |
0.253 |
Results of the seasonal Kendall test for trends in discharge and major dissolved constituents are listed in table 56. A statistically significant upward trend of 0.02 units per year was detected in the unadjusted field pH at the 0.01 probability level. The trend result was similar for the flow-adjusted pH values, indicating that the trend was not caused by variations in stream discharge. The LOWESS curve in figure 29 indicates that the trend in pH has occurred over the entire period of record, although the rate of increase was slightly higher before 1984. Trends in stream-water pH at this site may reflect changes in environmental factors such as land use and precipitation chemistry. The effect of land use on stream chemistry at this site probably is minimal because the Popple River Basin is primarily forested, and there have been no changes in land use during the period of record, except for a slight decrease in timber harvesting (D. Olsen, U.S. Department of Agriculture Forest Service, written commun., 1996). Trends in precipitation chemistry at this site are difficult to confirm because no long-term records are available near this station. Husar and others (1991) estimated little change in sulfate deposition rates in the upper Midwest during the past 30 years, based on historical SO2 emissions. Lynch and others (1995) reported declines in hydrogen ion [0.9 (meq/L)/yr] and sulfate [1.0 (meq/L)/yr] concentrations in precipitation at the Popple River NADP station from 1980 through 1992. Although the trend in precipitation acidity seems to be consistent with the upward trend in stream-water pH, a small change in the hydrogen ion concentration probably would not be detectable in the highly buffered water of the Popple River. The effect of decreasing sulfate deposition on stream-water sulfate probably also would be difficult to detect at this HBN station because of the large variations in stream-water sulfate concentrations that were caused by analytical bias. Method-related factors, particularly changes in field instruments and pH probes, also provide a possible explanation for the upward trend in stream-water pH. However, changes in field methods are not well documented for most stations in the HBN, particularly for the early part of the record.
[Trends in units of microequivalents per liter per year, except discharge in cubic meters per second per year, pH in standard units per year, and silica in micromoles per liter per year; inst., instantaneous; <, less than; --, not calculated]
|
Parameter |
Unadjusted |
Flow adjusted |
||
|
Trend |
p-value |
Trend |
p-value |
|
| Discharge, inst. |
-0.010 |
0.296 |
-- |
-- |
| pH, field |
.02 |
.001 |
0.02 |
0.001 |
| Calcium |
2.0 |
.205 |
.5 |
.647 |
| Magnesium |
2.1 |
.059 |
.2 |
.866 |
| Sodium |
<.1 |
.333 |
<.1 |
.827 |
| Potassium |
<.1 |
.223 |
<.1 |
.202 |
| Chloride |
<.1 |
.566 |
(a) |
-- |
| Sulfate |
-.9 |
.170 |
(a) |
-- |
| Nitrite plus nitrate |
(b) |
-- |
-- |
-- |
| Alkalinity, laboratory |
8.0 |
.018 |
2.0 |
.259 |
| Silica |
-.5 |
.018 |
-.8 |
.045 |
a Flow model not significant at a = 0.10.
b Insufficient data to calculate trend.
Results of the surface-water synoptic sampling in the Popple River Basin on September 23 and 24, 1992, are listed in table 57, and the locations of the sampling sites are shown in figure 28. During the sampling period, discharge at the gaging station was about 4.2 m³/s compared to the median daily discharge of 2.0 m³/s for September and 2.3 m³/s for October (Lawrence, 1987), indicating that the basin was sampled during higher than normal flow conditions for that time of year. The solute concentrations measured at site 1 during the synoptic sampling were close to the first-quartile concentrations reported for the HBN station during the entire period of record, except for sulfate, which was lower, and chloride, which was higher (table 54). The tributary streams spanned a wide range of concentrations that bracketed the concentrations in stream water collected at the gaging station (site 1). The average ion balance for all synoptic samples was 9.3 percent (range -3.7 to 37 percent), indicating that unmeasured constituents, probably organic anions, were an important component of stream water during the sampling period
[Site locations shown in fig. 28; Q, discharge in cubic meters per second; SC, specific conductance in microsiemens per centimeters at 25° Celsius; pH in standard units; Ca, calcium; Mg, magnesium; Na, sodium; K, potassium; Alk, alkalinity; SO4, sulfate; Cl, chloride; NO3, nitrate; Si, silica; concentrations in microequivalents per liter, except silica in micromoles per liter; <, less than; --, not reported; criteria used in selection of sampling sites: BG = bedrock geology, LC = land cover, LU = land use]
|
Site |
Station number |
Q |
SC |
pH |
Ca |
Mg |
Na |
K |
Alk |
SO4 |
Cl |
NO3 |
Si |
Criteria |
Remarks |
|
1 |
4063700 |
4.2 |
120 |
7.4 |
750 |
580 |
57 |
16 |
1,140 |
52 |
59 |
0.4 |
150 |
-- |
Gaging station |
|
2 |
454440088281100 |
.13 |
260 |
8.1 |
1,250 |
1,200 |
74 |
20 |
2,580 |
75 |
85 |
1.0 |
87 |
LC | Upland forest |
|
3 |
454558088314300 |
.092 |
160 |
7.4 |
850 |
720 |
48 |
16 |
1,600 |
46 |
28 |
.4 |
200 |
BG, LC | Felsic bedrock, upland forest |
|
4 |
454312088341600 |
.19 |
130 |
7.6 |
800 |
630 |
52 |
16 |
1340 |
67 |
25 |
<.4 |
140 |
BG, LC | Mafic bedrock, upland forest |
|
5 |
454439088353200 |
.17 |
210 |
7.7 |
1,150 |
960 |
65 |
19 |
2,300 |
100 |
34 |
.8 |
200 |
LC | Upland forest |
|
6 |
454734088362200 |
.044 |
230 |
7.5 |
1,250 |
1,040 |
52 |
18 |
2,280 |
50 |
62 |
.6 |
180 |
BG, LC | Felsic bedrock, upland forest |
|
7 |
454729088405500 |
.31 |
96 |
7.5 |
600 |
450 |
57 |
16 |
860 |
31 |
48 |
.4 |
130 |
LU | Downstream from Newald |
|
8 |
454426088425900 |
-- |
72 |
6.9 |
480 |
360 |
52 |
13 |
620 |
35 |
42 |
.4 |
130 |
BG, LC | Mafic bedrock, wetland |
|
9 |
454743088452300 |
-- |
62 |
6.5 |
450 |
330 |
52 |
7.4 |
540 |
31 |
34 |
.9 |
130 |
LC | Wetland |
|
10 |
454727088491100 |
.43 |
46 |
6.2 |
350 |
270 |
39 |
2.1 |
260 |
27 |
14 |
.4 |
110 |
BG, LC | Felsic bedrock, wetland |
|
11 |
454449088483100 |
.0037 |
39 |
5.7 |
270 |
200 |
43 |
2.1 |
200 |
25 |
51 |
.6 |
150 |
BG, LC | Mafic bedrock, wetland |
The data presented in table 57 indicate that stream chemistry varied markedly in the Popple River Basin, particularly for the weathering-derived constituents. For example, calcium ranged from 270 meq/L at site 11 to 1,250 meq/L at sites 2 and 6. A similar pattern was observed for alkalinity, which ranged from 200 meq/L at site 11 to 2,580 meq/L at site 2. This variation in stream chemistry does not seem to be related to the distribution of different bedrock types in the basin. For example, there was no obvious difference in chemistry between sites 4, 8, and 11, which primarily are underlain by mafic bedrock, and sites 3, 6, and 10, which are underlain by felsic rock types. The one spatial pattern that does emerge seems to reflect the primary land-cover types in the basin. This pattern can be seen by comparing the chemistry of tributaries in the western one-half of the basin (sites 8-11) with tributaries in the eastern one-half of the basin (sites 2-7). In general, the western tributaries had lower specific conductances (36 to 96 meq/L) and higher ion balances (8.8 to 37.2 percent) compared to the eastern tributaries, which had higher specific conductances (130 to 260 µmS/cm) and lower ion balances (-3.7 to 2.3 percent). Because the western one-half of the basin contains more wetlands than the eastern one-half, these results probably reflect differences in the contributions of surface runoff and ground-water discharge to streamflow, with the western tributaries receiving greater inputs of dilute, organic-rich waters from large wetland areas in this part of the basin. The low silica concentration at site 2 was somewhat unusual and may be due to biological uptake in two large lakes located upstream from the sampling site. Human activities did not appear to have an effect on nutrient concentrations in stream water, as evidenced by the low nitrite-plus-nitrate concentrations at all sampling sites. The effect of road salting on water quality was somewhat difficult to assess not only because sampling occurred in September but also because roads cross through the headwater areas of the basin. The lowest chloride concentration, however, was measured at site 10, which is the only site sampled upstream from roads that are salted in winter.
Bailey, R.G., Avers, P.E., King, T., and McNab, W.H., eds., 1994, Ecoregions and subregions of the United States with supplementary table of map unit descriptions: Washington, D.C., U.S. Department of Agriculture Forest Service, scale 1:7,500,000(also at URL http://www.fs.fed.us/land/ecosysmgmt/ecoreg1_home.html, accessed 1998).
Baker, L.A., 1991, Regional estimates of atmospheric dry deposition, in Charles, D.F., ed., Acidic deposition and aquatic ecosystems-Regional case studies: New York, Springer-Verlag, p. 645-652.
Clayton, Lee, 1986, Pleistocene geology of Florence County, Wisconsin: Wisconsin Geological and Natural History Survey, Information Circular 51, 13 p.
Durum, W.H., 1978, Historical profile of quality of water laboratories and activities, 1879-1973: U.S. Geological Survey Open-File Report 78-432, 235 p.
Fishman, M.J., Raese, J.W., Gerlitz, C.N., and Husband, R.A., 1994, U.S. Geological Survey approved inorganic and organic methods for the analysis of water and fluvial sediment, 1954-94: U.S. Geological Survey Open-File Report 94-351, 55 p.
Hole, F.D., Olson, G.W., Schmude, K.O., and Milfred, C.J., 1962, Soil survey of Florence County, Wisconsin: Wisconsin Geological and Natural History Survey Bulletin 84, Soil Series 59, 140 p.
Holmstrom, B.K., Olson, D.L., and Ellefson, B.R., 1996, Water resources data, Wisconsin, water year 1995: U.S. Geological Survey Water-Data Report WI-95-1, 562 p.
Husar, R.B., Sullivan, T.J., and Charles, D.F., 1991, Historical trends in atmospheric sulfur deposition and methods for assessing long-term trends in surface water chemistry, in Charles, D.F., ed., Acidic deposition and aquatic ecosystems-Regional case studies: New York, Springer-Verlag, p. 48-92.
Lawrence, C.L., 1987, Streamflow characteristics at hydrologic benchmark stations: U.S. Geological Survey Circular 941, 123 p.
National Climatic Data Center, 1996, Summary of the day: Boulder, Colorado, EarthInfo Incorporated, CD-ROM.
Oakes, Edward, Field, S.J., and Seeger, L.P., 1973, The Pine-Popple River Basin-Hydrology of a wild river area, northeastern Wisconsin: U.S. Geological Survey Water-Supply Paper 2006, 57 p.
Simpkins, W.W., McCartney, M.C., and Mickelson, D.M., 1987, Pleistocene geology of Forest County, Wisconsin: Wisconsin Geological and Natural History Survey, Information Circular 61, 21 p.
Sims, P.K., 1990, Geologic map of Precambrian rocks of Iron Mountain and Escanaba 1° ¥ 2° quadrangles, northeastern Wisconsin and northwestern Michigan: U.S. Geological Survey Miscellaneous Investigations Series Map I-2056, scale 1:250,000.
Sims, P.K., Schulz, K.J., and Peterman, Z.E., 1992, Geology and geochemistry of Early Proterozoic rocks in the Dunbar area, northeastern Wisconsin: U.S. Geological Survey Professional Paper 1517, 65 p.
Sullivan, D.J., Peterson, E.M., and Richards, K.D., 1995, Environmental setting of fixed sites in the western Lake Michigan drainages, Michigan and Wisconsin: U.S. Geological Survey Water-Resources Investigations Report 95-4211-A, 30 p.
a. U.S. Geological Survey topographic maps:
b. Geologic maps:
c. Soil surveys:
d. Miscellaneous maps:
Table B-1. NWIS site-identification numbers and site names for water-quality sampling sites.
|
|
Identification Number |
Site Name |
|
1 |
04063700 |
POPPLE R NR FENCE WISCONSIN |
|
2 |
454440088281100 |
MUD CR NR FENCE WISCONSIN |
|
3 |
454558088314300 |
MORGAN CR NR FENCE WISCONSIN |
|
4 |
454312088341600 |
SIMPSON CR NR FENCE WISCONSIN |
|
5 |
454439088353200 |
S POPPLE R NR FENCE WISCONSIN |
|
6 |
454734088362200 |
RILEY CR NR FENCE WISCONSIN |
|
7 |
454729088405500 |
L POPPLE R AT POPPLE R WISCONSIN |
|
8 |
454426088425900 |
L POPPLE R AT NEWALD WISCONSIN |
|
9 |
454743088452300 |
POPPLE R NR GENERAL MCARTHUR WHITE PINE WISCONSIN |
|
10 |
454727088491100 |
N POPPLE R AT HWY 55 WISCONSIN |
|
11 |
454449088483100 |
UPPER POPPLR R NR HWY 55 WISCONSIN |
| Back to 1173-B Contents |
This page maintained by Nichole Bisceglia.
Last updated July 17, 2000.