
Hydrologic Benchmark Network Stations in the Western U.S. 1963-95 (USGS Circular 1173-D)
To download a printer friendly PDF version of this information click here.
This report details one of the approximately 50 stations in the Hydrologic Benchmark Network (HBN) described in the four-volume U.S. Geological Survey Circular 1173. The suggested citation for the information on this page is:
|
Mast, M.A., and Clow, David W., 2000, Environmental characteristics and water-quality of Hydrologic Benchmark Network stations in the Western United States, U.S. Geological Survey Circular 1173-D, 115 p. |
All of the tables and figures are numbered as they appear in each circular. Use the navigation bar above to view the abstract, introduction and methods for the entire circular, as well as a map and list of all of the HBN sites. Use the table of contents below to view the information on this particular station.
|
Table of Contents |
| 1. Site Characteristics and Land Use |
| 2. Historical Water Quality Data and Time-Series Trends |
| 3. Synoptic Water Quality Data |
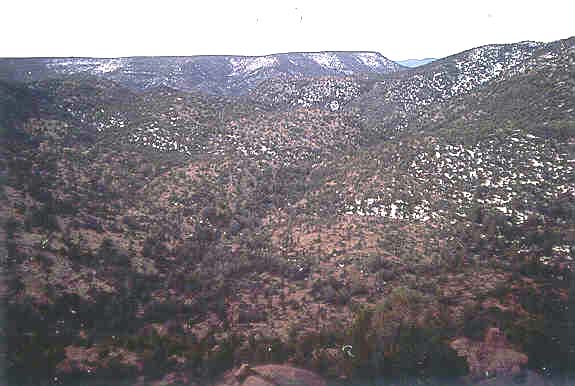
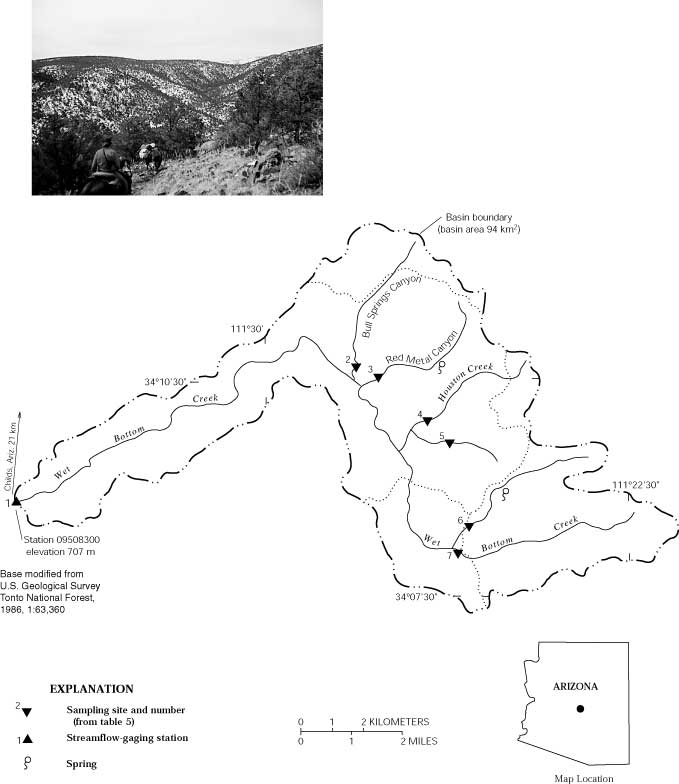
The Wet Bottom Creek HBN Basin is in the Mexican Highland of the Basin and Range physiographic province in central Arizona (Figure 2. Map showing study area in the Wet Bottom Creek Basin and photograph showing the basin landscape). The 94 at the HBN station to 2,271 m along the eastern boundary. Topography consists of west-
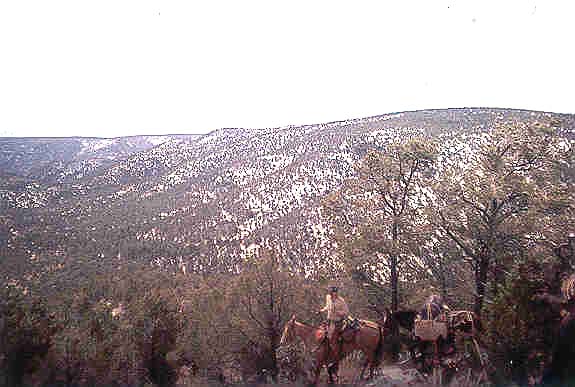 |
The basin is located in the Colorado Plateau Semidesert ecoregion (Bailey and others, 1994). Vegetation grows in zones defined by temperature and soil-moisture regimes, which are in turn dictated by elevation and aspect (Bailey and others, 1994). Low elevations are dominated by arid grasslands characterized by thin, patchy grass and xeric shrubs; cottonwoods grow along some of the streambanks. The woodland zone, which is above the grasslands, is dominated by low, open stands of pinyon pine and juniper. Groundcover includes grama grass, herbs, and shrubs, such as big sagebrush and alderleaf cercocarpus. The montane zone is on the high plateaus and mountains and is characterized by ponderosa pine and occasionally by Douglas-fir. Soils developed along flood plains of major streams are classified as Entisols, and those covering plateau tops, old stream terraces, and alluvial fans are classified as Aridisols (Bailey and others, 1994). Badlands of broken rock and steep slopewash deposits are extensive in the mountains and on the plateaus.
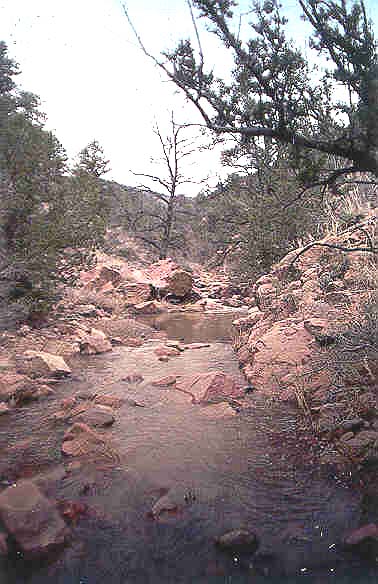
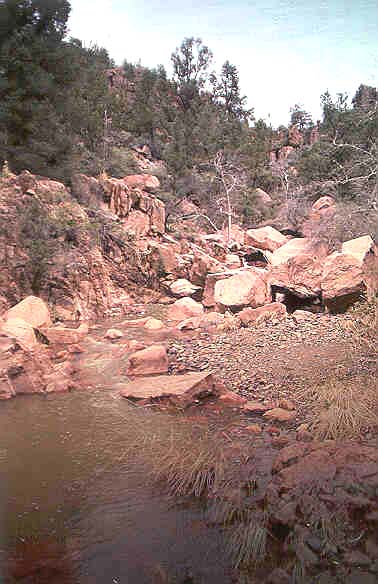
The geology and mineral resources of the Wet Bottom Creek Basin have been mapped by Wrucke and others (1983) and Wrucke and Conway (1987). The predominant rock type is alkali granite, which crops out in the southern two-thirds of the
 |
The Wet Bottom Creek HBN Basin is in the Tonto National Forest and is mostly in the Mazatzal Wilderness Area, which was created in 1964. The HBN station is accessed by flying in a helicopter to a marked landing site near the station. Hiking trails provide access to some of the canyons and plateaus, but much of the basin is relatively inaccessible. The closest access by road is from a trailhead 5 km east of the basin boundary. The basin is protected from human effects except for a minor amount of livestock grazing (Lawrence, 1987). Prospecting has occurred intermittently in the area since the 1870's; however, only one prospect pit is mapped in the Wet Bottom Creek Basin.
The data set for the Wet Bottom Creek HBN station analyzed for this report includes 174 water-quality samples that were
 |
Calculated ion balances for 173 samples that have complete major-ion analyses are shown in figures 3a and 3b. Graphs showing temporal variation of discharge, field pH, major-ion concentrations, and ion balance in Wet Bottom Creek, Arizona. Ion balances ranged from -12 to +17 percent, and 90 percent of the samples had values within the ±5 determinations, issued February 25, 1983, at URL http://water.usgs.gov/admin/memo/) followed by a change to ion chromatography in 1990 (Fishman and others, 1994). The stepped pattern in the time-series plot for concentrations of nitrite plus nitrate was caused by changes in the analytical reporting limit for this constituent that occurred in 1982 and again in 1991.
The median concentrations and ranges of major dissolved constituents in stream water collected at the HBN station and VWM concentrations in wet-only precipitation measured at the Oliver Knoll NADP station are presented in table 2. Precipitation chemistry at the NADP station, which is about 200 km southeast of the HBN station, is dilute and acidic and has a VWM pH of 4.8 for 15 years of record. The predominant cations in precipitation were hydrogen and calcium, which contributed 38 and 24 percent of the total cation charge, respectively. The predominant anions were sulfate and nitrate, which accounted for 64 and 27 percent of the total anion charge, respectively. The predominance of strong acid anions in precipitation may indicate that the chemistry at the NADP station is affected by industrial emissions of sulfur and nitrogen compounds that cause acid rain.
| Parameter | Stream Water | Precipitation VMAa | |||||
| Minimum | First Quartile | Median | Third Quartile | Maximum | n | ||
| Discarge, inst. | 0.00028 | 0.0099 | 0.025 | 0.19 | 6.2 | 173 | -- |
| Spec. cond., field | 17 | 130 | 280 | 360 | 580 | 172 | 11 |
| pH, field | 6.5 | 7.6 | 7.9 | 8.1 | 9.4 | 166 | 4.8b |
| Calcium | 240 | 610 | 1,350 | 1,790 | 3,100 | 174 | 9.9 |
| Magnesium | 88 | 300 | 620 | 880 | 1,600 | 174 | 2.4 |
| Sodium | 110 | 410 | 850 | 1,170 | 1,740 | 174 | 4.1 |
| Potassium | 13 | 23 | 31 | 38 | 87 | 174 | 0.5 |
| Ammonium | <.7 | .8 | 2.1 | 4.3 | 13 | 74 | 9.3 |
| Alkalinity, laboratory | 220 | 1,000 | 2,500 | 3,300 | 5,020 | 174 | -- |
| Sulfate | 31 | 100 | 160 | 210 | 350 | 173 | 28 |
| Chloride | 42 | 140 | 230 | 310 | 850 | 174 | 3.9 |
| Nitrite plus nitrate | <.7 | 1.4 | 3.6 | 7.1 | 28 | 151 | 12c |
| Silica | 130 | 350 | 480 | 580 | 840 | 174 | -- |
a Values are volume-weighted mean concentrations for 1981-95.
b Laboratory pH.
c Nitrate only.
Stream water in Wet Bottom Creek is fairly concentrated and strongly buffered; specific conductance ranged from 17 to 580 mS/cm and alkalinity ranged from 220 to 5,020 meq/L (table 2). The major cations in stream water were calcium and sodium, and the major anion was bicarbonate. The predominance of these solutes in stream water, in addition to relatively high concentrations of silica, is attributed to the weathering of silicate minerals in the alkali granites and volcanic rocks and carbonate minerals in the sedimentary rocks. The median chloride (230 meq/L) and sulfate (160 meq/L) concentrations in stream water were substantially greater than the VWM concentrations of chloride (3.9 meq/L) and sulfate (28 meq/L) in precipitation, indicating that these solutes are derived primarily from sources in the basin. Because land-use activities in the basin are minimal, the most plausible sources of chloride other than wet deposition are wind-blown material from surrounding desert areas (Turk and Spahr, 1991) and weathering of sedimentary rocks in the northeastern part of the basin. Wind-blown material also may be a source of stream-water sulfate; however, most sulfate probably is derived from oxidation of sulfide minerals associated with mineralized areas in the basin. Concentrations of inorganic nitrogen species in stream water were less than the VWM concentrations in precipitation, indicating that most atmospheric nitrogen is retained by vegetation and soils and that livestock grazing in the basin has not substantially affected nutrient concentrations at the HBN station.
[Q, discharge; Ca, calcium; Mg, magnesium; Na, sodium; K, potassium; Alk, alkalinity; SO4, sulfate; Cl, chloride; N, nitrite plus nitrate; Si, silica]
|
|
|
|
|
|
|
|
|
|
|
|
| pH | -0.198 | -- | -- | -- | -- | -- | -- | -- | -- | -- |
| Ca | -.888 | 0.214 | -- | -- | -- | -- | -- | -- | -- | -- |
| Mg | -.872 | .242 | 0.948 | -- | -- | -- | -- | -- | -- | -- |
| Na | -.806 | .274 | .904 | 0.943 | -- | -- | -- | -- | -- | -- |
| K | -.632 | .295 | .723 | .751 | 0.744 | -- | -- | -- | -- | -- |
| Alk | -.882 | .262 | .973 | .974 | .953 | 0.736 | -- | -- | -- | -- |
| SO4 | .339 | -.273 | -.194 | -.206 | -.188 | -.207 | -0.256 | -- | -- | -- |
| Cl | -.800 | .215 | .887 | .896 | .923 | .736 | .901 | -0.147 | -- | -- |
| N | .133 | .000 | -.111 | -.153 | -.079 | -.115 | -.109 | -.083 | -0.094 | -- |
| Si | -.760 | .267 | .815 | .853 | .863 | .672 | .863 | -.382 | 0.780 | -0.038 |
| Parameter |
Unadjusted
|
Flow adjusted
|
||
|
Trend
|
p-value
|
Trend
|
p-value
|
|
| Discharge |
0.001
|
0.001
|
--
|
--
|
|
pH, field
|
<.01
|
.744
|
0.01
|
0.169
|
|
Calcium
|
-21.6
|
.001
|
-7.8
|
.006
|
|
Magnesium
|
-8.0
|
.010
|
-3.2
|
.033
|
|
Sodium
|
-7.7
|
.060
|
-3.9
|
.073
|
|
Potassium
|
-.3
|
.002
|
-.2
|
.014
|
|
Alkalinity, laboratory
|
-25.1
|
.025
|
4.3
|
.360
|
|
Sulfate
|
-3.2
|
.000
|
-3.4
|
.000
|
|
Chloride
|
-3.5
|
.007
|
-1.0
|
.111
|
|
Nitrite plus nitrate
|
(a)
|
--
|
--
|
--
|
|
Silica
|
<.1
|
.608
|
1.8
|
.026
|
a Insufficient data to calculate trend.
The solute composition of stream water was further evaluated by analyzing correlations among solutes and stream discharge (table 3). Most weathering-derived solutes had strong inverse correlations with stream discharge, particularly calcium (rho = -0.888) and alkalinity (rho = -0.882). These results are consistent with a hydrologic system where weathering-enriched base flow is diluted by water from shallow or surficial sources during periods of increased discharge, such as
 |
The results of the seasonal Kendall test for trends in discharge and major dissolved constituents are listed in table 4. Statistically significant trends were detected in discharge and in the unadjusted calcium, magnesium, potassium, sulfate, and chloride concentrations at the 0.01 probability level. The trends in magnesium, potassium, and chloride concentrations were not significant using the flow-adjusted data; however, the trends in flow-adjusted calcium and sulfate remained significant, indicating they were not caused by the upward trend in discharge. The LOWESS curves in figure 3 show somewhat different temporal patterns in the calcium and sulfate concentrations during the period of record. Most of the decline in calcium concentrations occurred prior to 1980, whereas most of the decline in sulfate concentrations occurred after 1980. A change in atmospheric deposition is one possible explanation for the declines in stream-water concentrations at this station. Lynch and others (1995), for example, reported significant downward trends in calcium and sulfate concentrations in precipitation at several NADP stations in the Southwestern United States from 1980 to 1992. Although this change in precipitation chemistry is consistent with the downward trend in stream-water sulfate, it cannot account for the decline in stream- water calcium concentrations, which primarily occurred prior to 1980. Alternatively, trends in stream-water chemistry at this station may be caused by method-related factors. For example, the decline in sulfate occurred during a period when there were two changes in the analytical technique for sulfate, one in 1983 and another in 1990 (Fishman and others, 1994). Method-related factors that may have introduced bias into the calcium records include a switch from a district laboratory to the central laboratory system in 1973 and a change in the analytical technique for calcium from atomic absorption (AA) spectroscopy to inductively coupled plasma (ICP) spectroscopy in 1983 (Office of Water Quality Technical Memorandum No. 82.18, National water-quality networks, issued September 28, 1982, at URL http://water.usgs.gov/admin/memo/).
Chemical results of the surface-water synoptic sampling of March 23 through 26, 1991, are listed in table 5, and locations of sampling sites are shown in figure 2. During the synoptic sampling, average daily discharge at the HBN station was between 3.2 and 6.3 m³/s compared to the median daily discharge of about 0.2 m³/s for March (Lawrence, 1987), indicating that the basin was sampled during high-flow conditions for that time of year. Because of the flow conditions, most of the solute concentrations measured at the HBN station (site 1) during the sampling period were less than the first-quartile values reported for the station during the entire period of record (table 2). Samples from the upstream sites were similar in composition to the sample at site 1; calcium and bicarbonate were the predominant ions, and their concentrations bracketed the concentrations at site 1. Ion balances for all the synoptic samples were positive (range 1.3 to 15 percent), indicating that unmeasured anions, such as organic anions, may have contributed to the ionic content of stream water during the sampling period. Despite the high-flow conditions in the basin, stream- water chemistry was quite variable, particularly for the weathering-derived constituents. For example, calcium ranged from a minimum of 130 meq/L at site 6 to 650 meq/L at site 2, and alkalinity ranged from 92 meq/L at site 5 to 1,120 meq/L at site 2 (table 5). The observed variation in stream chemistry seems to reflect the distribution of mapped bedrock types in the basin. Sites that had high concentrations (sites 2-4) drain areas underlain by sedimentary and volcanic rocks, whereas sites with more dilute water (sites 5-7) drain areas underlain by granitic bedrock. This relation is demonstrated by comparing the average alkalinity of 800 meq/L at sites 2-4 with the average alkalinity of 100 meq/L at sites 5-7. A similar pattern occurred for calcium concentrations, which averaged 510 meq/L at sites 2-4 compared to 140 meq/L at sites 5-7. This pattern in stream-water concentrations seems to be consistent with the concept that the sedimentary and volcanic rocks contain more weatherable minerals, such as carbonates and mafic silicates, than the chemically resistant granites, which primarily consist of quartz and feldspar.
|
Site
|
Station number
|
Q
|
SC
|
pH
|
Ca
|
Mg
|
Na
|
K
|
Alk
|
S04
|
Cl
|
NO3
|
Si
|
Criteriaa
|
Remarks
|
| 1 |
09508300
|
5.07
|
51
|
7.4 |
240
|
120
|
110
|
15
|
320
|
79
|
45
|
4.4
|
230
|
--
|
-- |
| 2 |
341128111353300
|
.069
|
130
|
8.0 |
650
|
500
|
220
|
19
|
1,120
|
130
|
99
|
3.6
|
330
|
BG
|
Sedimentary and volcanic rocks
|
| 3 |
341118111350500
|
.067
|
73
|
7.5 |
340
|
220
|
150
|
16
|
480
|
130
|
85
|
<0.7
|
280
|
BG
|
Sedimentary and volcanic rocks
|
| 4 |
341032111340700
|
.19
|
100
|
7.7 |
550
|
310
|
160
|
13
|
820
|
100
|
73
|
<0.7
|
250
|
BG
|
Mafic volcanic rocks
|
| 5 |
341011111334200
|
.13
|
33
|
6.7 |
150
|
80
|
83
|
18
|
92
|
92
|
59
|
1.4
|
200
|
BG
|
Granite
|
| 6 |
340848111331100
|
--
|
27
|
6.9 |
130
|
69
|
65
|
14
|
100
|
65
|
37
|
1.4
|
170
|
BG
|
Granite
|
| 7 |
340819111333600
|
--
|
27
|
6.9 |
140
|
62
|
61
|
13
|
120
|
58
|
34
|
0.7
|
160
|
BG
|
Granite
|
Bailey, R.G., Avers, P.E., King, T., McNab, W.H., eds., 1994, Ecoregions and subregions of the United States with supplementary table of map unit descriptions: Washington, D.C., U.S. Department of Agriculture, Forest Service, scale 1:7,500,000.
Durum, W.H., 1978, Historical profile of quality of water laboratories and activities, 1879-1973: U.S. Geological Survey Open-File Report 78-432, 235 p.
Fishman, M.J., Raese, J.W., Gerlitz, C.N., and Husband, R.A., 1994, U.S. Geological Survey approved inorganic and organic methods for the analysis of water and fluvial sediment, 1954-94: U.S. Geological Survey Open-File Report 94-351, 55 p.
Lawrence, C.L., 1987, Streamflow characteristics at hydrologic benchmark stations: U.S. Geological Survey Circular 941, 123 p.
Lynch, J.A., Grimm, J.W., and Bowersox, V.C., 1995, Trends in precipitation chemistry in the United States-A national perspective, 1980-1992: Atmospheric Environment, v. 29, no. 11, p. 1231-1246.
Smith, C.F., Duet, N.R., Fisk, G.G., McCormack, H.F., Partin, C.K., Pope, G.L., Rigas, P.D., and Tadayon, S., 1996, Water resources data, Arizona, water year 1995: U.S. Geological Survey Water-Data Report AZ-95-1, 306 p.
Turk, J.T., and Spahr, N.E., 1991, Rocky Mountains, in Charles, D.F., ed., Acidic deposition and aquatic ecosystems-Regional case studies: New York, Springer-Verlag, p. 48-92.
Wrucke, C.T., and Conway, C.M., 1987, Geologic map of the Mazatzal Wilderness and contiguous roadless area, Gila, Maricopa, and Yavapai Counties, Arizona: U.S. Geological Survey Open-File Report 87-664, 22 p.
Wrucke, C.T., Marsh, S.P., Conway, C.M., Ellis, C.E., Kulik, D.M., Moss, C.K., and Raines, G.L., 1983, Mineral resource potential of the Mazatzal Wilderness and contiguous roadless area, Gila, Maricopa, and Yavapai Counties, Arizona: U.S. Geological Survey Miscellaneous Field Studies Map MF-1573-A, 15 p.
a. U.S. Geological Survey Topographic Maps:
b. Geologic Maps:
c. Soil surveys: No soil survey available.
d. Miscellaneous Maps
Table B-1. NWIS site-identification numbers and site names for water-quality sampling sites.
|
|
|
|
| 1 | 09508300 | WET BOTTOM CR NR CHILDS, AZ |
| 2 | 341128111353300 | BULL SPRING TRIB NR CYPRESS BUTTE, AZ |
| 3 | 341118111350500 | RED METAL CR NR CYPRESS BUTTE, AZ |
| 4 | 341032111340700 | HOUSTON CR NR CYPRESS BUTTE, AZ |
| 5 | 341011111334200 | CHALK SPRING CR NR CYPRESS BUTTE, AZ |
| 6 | 340848111331100 | FULLER SEEP CR NR CYPRESS BUTTE, AZ |
| 7 | 340819111333600 | WET BOTTOM CR NR MIDNIGHT MESA, AZ |
| Back to 1173-D Contents |
This page maintained by Nichole Bisceglia.
Last updated August 1, 2000.